Socioeconomic inequalities and dynamic changes in sex differences in lifetime risks of peptic ulcer disease
Dequan Shi, Yuhao Li, Rongshou Zheng, Shengfeng Wang, Ru Chen

TL;DR
This study shows that the risk of peptic ulcers has declined globally but reveals growing disparities by gender and socioeconomic status, with women now at higher risk in many regions.
Contribution
The first comprehensive global assessment of lifetime risks of peptic ulcer disease by sex and socioeconomic index, revealing a reversal in risk patterns between men and women.
Findings
Global lifetime risk of developing PUD decreased from 1990 to 2021, with faster declines among males than females.
Sex ratios of PUD risk show inflection points where female risk surpassed male risk, occurring earlier in low-SDI regions.
High-SDI regions had higher risk of developing PUD but lower risk of dying from it compared to low-SDI regions.
Abstract
Peptic ulcer disease (PUD) is a common digestive system disorder and an important risk factor for gastric cancer. While previous studies have extensively focused on using traditional indicators, lifetime risks of PUD remain relatively scarce. Using Global Burden of Disease (GBD) 2021 data, we estimated lifetime risks of developing and dying from PUD by lifetable method.Trends were assessed by calculating the average annual percent change (AAPC) from 1990 to 2021. By computing the sex ratios(male to female) of lifetime risks and plotting time-trend graphs, we analyzed the dynamic evolution of sex differences. In 2021, the global lifetime risk of developing from PUD was 3.21% (95% CI, 3.20%-3.22%), declining from 1990 (AAPC: -1.24; 95% CI, -1.37 to -1.11), with a more pronounced decrease among males (AAPC: -1.43; 95% CI, -1.53 to -1.33) than females (AAPC: -1.00; 95% CI, -1.10 to…
Genes, proteins, chemicals, diseases, species, mutations and cell lines named across the full text — each resolved to its canonical identifier and authoritative record.
Click any figure to enlarge with its caption.
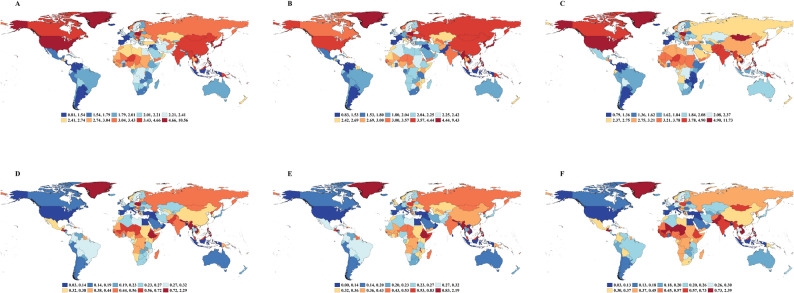 Figure 1
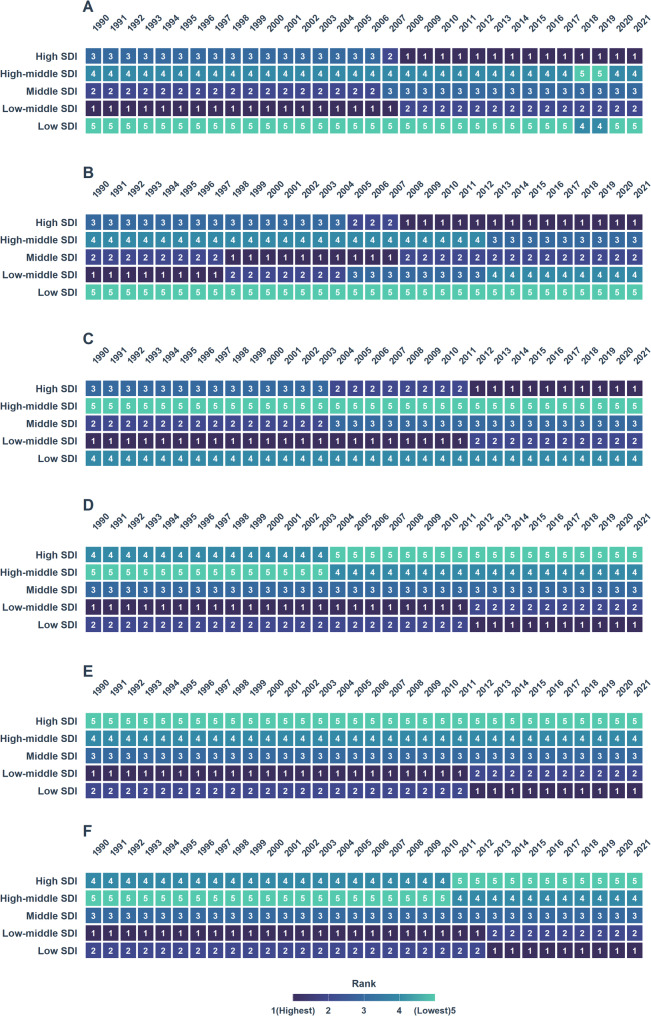 Figure 2
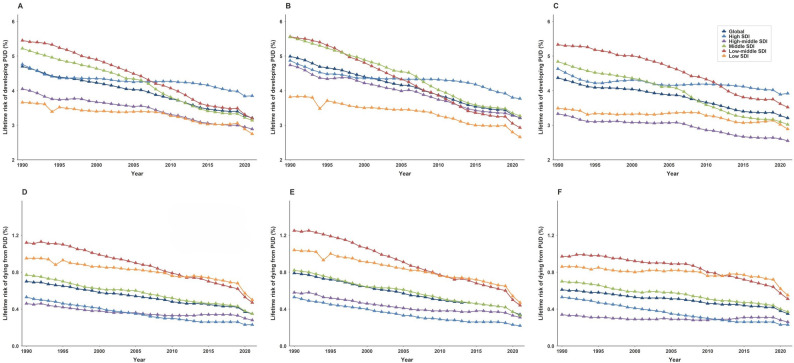 Figure 3
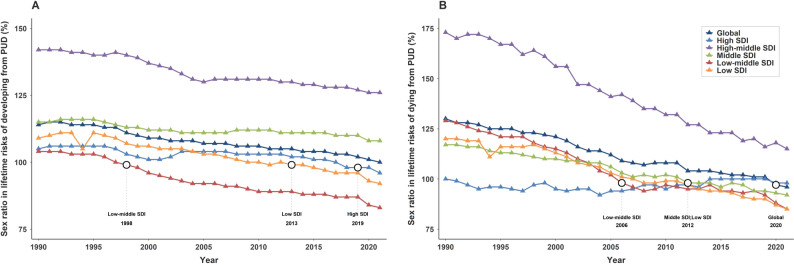 Figure 4
- —Chinese Academy of Medical Sciences Innovation Fund for Medical Sciences
- —National Nature Science Foundation of China
- —Capital's Funds for Health Improvement and Research
- —National Key Research and Development Program of China
Peer Reviews
No public reviews on file for this paper yet. If you reviewed it on a platform where reviews are public (OpenReview, ICLR, NeurIPS, ICML), you can paste yours below so the community can read it here.
Videos
No videos yet. Explain this paper in a talk, walkthrough, or lecture? Add one.
Taxonomy
TopicsHelicobacter pylori-related gastroenterology studies · Gastric Cancer Management and Outcomes · Gastroesophageal reflux and treatments
Introduction
Peptic ulcer disease (PUD) is a common upper gastrointestinal disorder that primarily affects the stomach and proximal duodenum. Its pathogenesis stems from an imbalance between gastric mucosal defense mechanisms and the damaging effects of gastric acid and pepsin [1–3]. Impairment of mucosal defenses, combined with gastric acid hypersecretion, can lead to progression from superficial mucosal injury to deep ulceration, which manifests as symptoms such as abdominal pain and dyspepsia [4]. Acute complications, including gastrointestinal bleeding or perforation, may lead to life-threatening conditions such as shock and sepsis [5, 6]. Moreover, PUD is associated with an increased risk of gastric cancer [7]. In 2021, there were an estimated 2.85 million new cases of PUD and over 230,000 related deaths worldwide [8]. The disease considerably impairs quality of life, and the associated costs of diagnosis, treatment, and hospitalization pose significant challenges to global public health [9–11].
The lifetime risk of PUD represents the probability that an individual will develop or die from it between birth and death, serving as a crucial longitudinal measure of disease burden [12, 13]. Compared with conventional metrics such as incidence, mortality, or cumulative risk from ages 0 to 74 years, lifetime risk incorporates life expectancy, the potential for multiple occurrences, and competing risks from other causes of death, thereby providing a more intuitive perspective on disease burden [12, 13]. Previous studies have identified Helicobacter pylori (H.pylori) infection and nonsteroidal anti-inflammatory drugs (NSAIDs) use as the most common etiologic factors for PUD [14, 15]. The burden of PUD is closely linked to socioeconomic factors and health care accessibility, with the highest age-standardized prevalence rates, mortality rates, and disability-adjusted life-years (DALYs) observed in low- and low-middle sociodemographic index (SDI) regions [16–21].
Sex-specific analyses indicated a consistently higher burden among males than among females from 1990 to 2021 [19, 22]. This disparity may be attributed to physiological and behavioral factors, males typically exhibit higher basal gastric acid secretion and are more likely to engage in risk behaviors such as smoking and alcohol consumption. In contrast, premenopausal women may benefit from the protective effects of estrogen, which enhances mucosal defense through multiple mechanisms including inhibition of acid secretion and stimulation of prostaglandin synthesis. However, this sex-based difference may not be static but rather exhibits dynamic patterns across the lifespan and socioeconomic strata. The protective advantage in women appears to diminish after menopause due to declining estrogen levels, while factors such as nutritional deficiencies in low-SDI regions and increased NSAID use in high-SDI regions may further modulate sex-specific disease risks over time [23, 24].
Leveraging data from the 2021 Global Burden of Disease (GBD) study, this study aimed to estimate the lifetime risks of developing and dying from PUD at global, regional, and SDI-stratified levels. By examining trends from 1990 to 2021, assessing geographic disparities, and evaluating dynamic sex-specific differences, this study seeks to provide a scientific foundation for understanding the burden of PUD and informing global health policies.
Methods
Data sources
The GBD 2021 study is a comprehensive epidemiological assessment that provides data on 371 diseases and injuries worldwide [8]. Data sources included vital registration systems, epidemiological surveys, disease surveillance systems, cancer registries, police records, and open-source databases. Detailed methods for data collection and processing have been described previously. Downstream analyses used advanced statistical models, including meta-regression with Bayesian priors, regularization, and trimming (MR-BRT); DisMod-MR 2.1; and spatiotemporal Gaussian process regression (ST-GPR). All disease terms were standardized using International Classification of Diseases (ICD) codes to ensure accuracy and comparability. The study adhered to the Guidelines for Accurate and Transparent Health Estimates Reporting (GATHER). We extracted age-, sex-, and location-specific incidence and mortality rates for PUD, from 1990 to 2021, as well as total population and all-cause mortality rates. Data encompassed all 21 GBD regions. In addition, we used the SDI, a composite indicator of development level calculated as the geometric mean of 3 scaled components: total fertility rate among persons younger than 25 years, mean educational attainment among persons 15 years or older, and lag-distributed income per capita. The SDI ranges from 0 (lowest development) to 1 (highest development). Based on SDI values, countries and territories were categorized into 5 quintiles: low, low-middle, middle, high-middle, and high SDI, representing varying socioeconomic levels.
Statistical analysis
We estimated lifetime risks of developing and dying from PUD for the overall population, males, and females across 21 regions, and 5 SDI levels using the lifetable method(Additional file1; Supplementary File 2) [12, 13].This approach assumes a PUD related mortality risk of 0 and corrects for the effects of multiple primary events in incidence rates. Age-specific incidence, mortality, and all-cause mortality rates, stratified by 5-year age groups, were used to calculate lifetime risks for males and females in each age group, representing the probability of developing or dying from PUD from the index age onward. Lifetime risks were assumed to be uniformly distributed within the given 95% CI, and male-to-female lifetime risk ratios with 95% CIs were derived via 100 000 resamples.Table 1. Lifetime risks(%) of developing and dying from PUD in 1990 and 2021, both sexLocation****LRDE (95% CI)****AAPC(95% CI),1990–2021****P-valuefor AAPC ****LRDY (95% CI)****AAPC(95% CI),1990–2021P-value for AAPC199020211990****2021Global4.70(4.69,4.71)3.21(3.20,3.22)−1.24 (−1.37, −1.11)< 0.0010.70(0.70,0.70)0.35(0.34,0.35)−2.25 (−2.57, −1.93)< 0.001High SDI4.76(4.73,4.79)3.85(3.81,3.88)−0.69 (−0.76, −0.62)< 0.0010.53(0.52,0.53)0.23(0.22,0.23)−2.71 (−3.04, −2.38)< 0.001High-middle SDI4.05(4.03,4.07)2.89(2.87,2.92)−1.07 (−1.21, −0.92)< 0.0010.46(0.45,0.46)0.28(0.28,0.29)−1.54 (−1.79, −1.29)< 0.001Middle SDI5.22(5.20,5.23)3.14(3.13,3.15)−1.62 (−1.77, −1.48)< 0.0010.77(0.76,0.77)0.35(0.35,0.35)−2.53 (−2.70, −2.35)< 0.001Low-middle SDI5.45(5.43,5.47)3.20(3.18,3.21)−1.71 (−1.83, −1.60)< 0.0011.12(1.11,1.13)0.47(0.47,0.48)−2.77 (−3.06, −2.48)< 0.001Low SDI3.66(3.64,3.68)2.75(2.74,2.77)−0.96 (−1.14, −0.77)< 0.0010.95(0.94,0.96)0.50(0.50,0.51)−2.10 (−2.41, −1.78)< 0.001RegionalSouthern Latin America1.86(1.82,1.91)1.48(1.44,1.53)−0.75 (−0.87, −0.63)< 0.0010.37(0.35,0.40)0.17(0.16,0.18)−2.44 (−3.29, −1.59)< 0.001Western Europe2.81(2.79,2.83)1.86(1.83,1.89)−1.37 (−1.43, −1.31)< 0.0010.57(0.56,0.57)0.21(0.21,0.21)−3.21 (−3.38, −3.05)< 0.001High-income North America5.85(5.81,5.90)4.76(4.71,4.80)−0.70 (−0.77, −0.63)< 0.0010.34(0.33,0.35)0.12(0.12,0.13)−3.38 (−4.04, −2.73)< 0.001Australasia3.96(3.84,4.08)2.00(1.89,2.11)−2.19 (−2.30, −2.07)< 0.0010.79(0.74,0.84)0.19(0.17,0.21)−4.41 (−5.04, −3.77)< 0.001High-income Asia Pacific5.97(5.87,6.07)4.78(4.57,5.00)−0.71 (−0.90, −0.52)< 0.0010.64(0.63,0.66)0.24(0.23,0.25)−3.12 (−3.52, −2.72)< 0.001Caribbean2.94(2.83,3.05)2.11(2.02,2.20)−1.12 (−1.52, −0.71)< 0.0010.74(0.70,0.78)0.34(0.32,0.35)−2.14 (−2.44, −1.85)< 0.001Central Latin America3.26(3.22,3.31)1.66(1.64,1.68)−2.26 (−2.43, −2.10)< 0.0011.16(1.13,1.19)0.35(0.34,0.36)−3.95 (−4.36, −3.55)< 0.001Tropical Latin America3.71(3.66,3.75)1.81(1.79,1.83)−2.28 (−2.55, −2.00)< 0.0010.52(0.50,0.54)0.28(0.27,0.29)−1.94 (−2.30, −1.58)< 0.001Andean Latin America3.59(3.48,3.71)1.89(1.84,1.94)−2.11 (−2.32, −1.91)< 0.0011.04(0.98,1.10)0.22(0.20,0.23)−5.27 (−5.86, −4.67)< 0.001Central Sub-Saharan Africa2.30(2.25,2.35)2.30(2.25,2.34)−0.02 (−0.17, 0.12)0.7610.54(0.52,0.57)0.42(0.41,0.44)−0.89 (−1.08, −0.69)< 0.001Eastern Sub-Saharan Africa2.14(2.12,2.17)1.97(1.95,1.99)−0.36 (−0.70, −0.02)< 0.0010.72(0.71,0.74)0.48(0.47,0.48)−1.32 (−1.87, −0.77)< 0.001Southern Sub-Saharan Africa2.70(2.64,2.77)1.84(1.81,1.87)−1.22 (−1.57, −0.88)< 0.0010.57(0.54,0.60)0.26(0.25,0.27)−2.57 (−2.94, −2.21)< 0.001Western Sub-Saharan Africa2.93(2.89,2.97)2.94(2.91,2.98)−0.01 (−0.10, 0.08)0.8120.57(0.56,0.59)0.43(0.42,0.43)−0.91 (−1.08, −0.75)< 0.001North Africa and Middle East3.08(3.05,3.11)2.41(2.39,2.44)−0.81 (−0.89, −0.73)< 0.0010.56(0.54,0.57)0.21(0.21,0.22)−3.17 (−3.35, −2.99)< 0.001South Asia6.33(6.31,6.36)3.30(3.28,3.32)−2.08 (−2.22, −1.94)< 0.0011.31(1.30,1.32)0.51(0.50,0.51)−3.02 (−3.30, −2.74)< 0.001East Asia6.32(6.29,6.34)3.89(3.87,3.92)−1.57 (−1.68, −1.46)< 0.0010.74(0.74,0.75)0.35(0.34,0.35)−2.41 (−2.63, −2.20)< 0.001Southeast Asia4.36(4.33,4.39)3.16(3.13,3.19)−1.03 (−1.23, −0.82)< 0.0010.70(0.69,0.71)0.39(0.39,0.40)−1.76 (−1.97, −1.54)< 0.001Oceania(Expect Australasia)5.66(5.29,6.02)4.60(4.35,4.86)−0.63 (−0.80, −0.45)< 0.0010.83(0.72,0.94)0.45(0.40,0.50)−1.85 (−2.04, −1.65)< 0.001Central Asia2.79(2.72,2.85)2.75(2.68,2.81)−0.07 (−0.29, 0.15)0.5260.38(0.36,0.40)0.34(0.33,0.36)−0.45 (−0.88, −0.01)< 0.001Eastern Europe3.06(3.03,3.09)3.08(3.04,3.13)0.01 (−0.38, 0.40)0.9580.33(0.32,0.33)0.42(0.41,0.42)0.79 (−0.21, 1.80)0.121Central Europe3.88(3.83,3.94)3.59(3.49,3.69)−0.23 (−0.35, −0.11)< 0.0010.51(0.49,0.52)0.44(0.43,0.45)−0.47 (−0.90, −0.04)< 0.001LRDE = lifetime risk of developing(%); LRDY = lifetime risk of dying(%);CI = confidence interval; SDI: sociodemographic index
This study assessed temporal trends in lifetime risk using the average annual percentage change (AAPC) with corresponding 95% confidence intervals (CIs), which were calculated with the Joinpoint Trend Analysis Software (command line version 5.3.0)(Supplementary File 2). The AAPC serves as a summary measure that captures the average rate of change over a specified period, while accounting for potential shifts in trend direction. Joinpoint regression analysis identifies points in time where statistically significant changes in trends occur by fitting a sequence of joined straight lines on a logarithmic scale. The software applies a grid search method to determine the optimal number and location of joinpoints, and assesses statistical significance using Monte Carlo permutation tests. This approach enables the detection of complex temporal patterns and provides robust estimates of trend changes, making it particularly suitable for analyzing long-term epidemiological data characterized by potential dynamic variations over time [25]. Negative AAPC indicates a declining trend, while positive AAPC indicates an increasingtrend.
We calculated time-varying sex ratios (male to female) for lifetime risks of developing and dying from PUD across SDI levels and identified inflection points (the point after which female lifetime risks exceeded those of males). We assessed the strength and direction of correlations between lifetime risk of developing PUD and cumulative risks from ages 0 to 74 years using standardized linear regression models and computed differences between estimates with 95% CIs. Standardized linear regression model refers to a quadratic regression model wherein the predictor variable (cumulative risk from 0 to 74 years) was standardized prior to model fitting. The cumulative risk values were initially transformed into Z-scores; subsequently, both these standardized values and their squared terms were incorporated into the model to establish the quadratic regression framework.The 95% CIs were calculated assuming a Poisson distribution for lifetime risk of developing and dying from PUD. All analyses were performed using SAS (version 9.4) and R (version 4.4.1).
Results
Global and regional lifetime risks of developing and dying from PUD
Lifetime risk of developing from PUD
The global lifetime risk of developing from PUD was 3.21% in 2021 (95% CI, 3.20%−3.22%) (Table 1; Fig. 1A).Although this risk was nearly consistent for both males (3.21%; 95% CI, 3.20%−3.22%) and females (3.21%; 95% CI, 3.20%−3.23%), significant regional variations were observed (Table 1; Fig. 1A, Additional file1:Table S1, Table S2). High-income Asia Pacific exhibited the highest lifetime risk of developing (4.78%; 95% CI, 4.57%−5.00%), while Southern Latin America had the lowest risk (1.86%; 95% CI, 1.82%−1.91%) (Table 1; Fig. 1A, Additional file1:Table S1, Table S2, Fig.S1A). In 2021, significant disparities in lifetime risk of developing from PUD were also observed across SDI regions. The highest risk was in high-SDI regions (3.85%; 95% CI, 3.81%−3.88%) and the lowest in low-SDI regions (2.75%; 95% CI, 2.74%−2.77%)(Table 1; Fig. 2A).Globally, the lifetime risk of developing PUD in 2021 demonstrated a significant decreasing trend compared to 1990, with an AAPC of − 1.24 (95% CI: −1.37 to − 1.11,P < 0.001). Males experienced a faster decline (AAPC:−1.43; 95% CI,−1.53 to − 1.33) than females (AAPC:−1.00; 95% CI,−1.10 to − 0.89,P < 0.001) (Table 1; Fig. 3A-C, Additional file1:Table S1,Table S2). The most rapid decline occurred in low-middle SDI regions (AAPC:−1.71; 95% CI, − 1.83 to − 1.60,P < 0.001), contrasting with the slowest reduction in high-SDI regions (AAPC, − 0.69; 95% CI, − 0.76 to − 0.62,P < 0.001) (Table 2, Additional file1:Fig.S2A, Fig.S3A). For males, the fastest decrease occurred in low-middle SDI regions (AAPC, − 2.06; 95% CI, − 2.19 to − 1.93,P < 0.001), while their risk in high-SDI regions showed the most modest decline (AAPC, − 0.82; 95% CI, − 0.91 to − 0.74,P < 0.001)(Table S1,Additional file1:Fig.S3B). Females exhibited the greatest improvement in middle-SDI regions (AAPC, − 1.51; 95% CI, − 1.68 to − 1.33,P < 0.001), with the high-SDI regions demonstrating the least progress (AAPC, − 0.54; 95% CI, − 0.66 to − 0.42,P < 0.001) (Table S2, Additional file1:Fig.S3C).
Fig. 1. Lifetime risks of developing and dying from PUD for the whole population, males and females in 2021. A Lifetime risk of developing PUD in the whole population B Lifetime risk of developing PUD in males C Lifetime risk of developing PUD in females D Lifetime risk of dying from PUD in the whole population E Lifetime risk of dying from PUD in males F Lifetime risk of dying from PUD in females
Fig. 2. Heatmap of the lifetime risk of developing and dying from PUD by SDI for the whole population, males and females from 1990 to 2021 A Lifetime risk of developing PUD in the whole population B Lifetime risk of developing PUD in males C Lifetime risk of developing PUD in females D Lifetime risk of dying from PUD in the whole population E Lifetime risk of dying from PUD in males F Lifetime risk of dying from PUD in females
Fig. 3. Trends in lifetime risks of developing and dying from PUD by SDI for the whole population, males and females from 1990 to 2021 A Trends in lifetime risk of developing from PUD in the whole population B Trends in lifetime risk of developing from PUD in males C Trends in lifetime risk of developing from PUD in females D Trends in lifetime risk of dying from PUD in the whole population. E Trends in lifetime risk of dying from PUD in males F Trends in lifetime risk of dying from PUD in females
Lifetime risk of dying from PUD
The global lifetime risk of dying from PUD was estimated at 0.35% in 2021 (95% CI, 0.34%−0.35%), with a risk of 0.34% (95% CI, 0.34%−0.34%) for males and 0.35% (95% CI, 0.35%−0.36%) for females (Table 1; Fig. 1A, Additional file1:Table S1, Table S2). South Asia exhibited the highest lifetime risk of death (0.51%; 95% CI, 0.50%−0.51%), while High-Income North America had the lowest risk (0.12%; 95% CI, 0.12%−0.13%) (Table 1; Fig. 1D, Additional file1:Fig.S1D). In 2021, the highest lifetime risk of dying from PUD was found in low-SDI regions (0.50%; 95% CI, 0.50%−0.51%), while high-SDI regions showed the lowest risk (0.23%; 95% CI, 0.22%−0.23%) (Table 1; Fig. 2D).Globally, the AAPC in lifetime risk of dying from PUD showed a significant decline from 1990 to 2021, with an overall AAPC of − 2.25 (95% CI, − 2.57 to − 1.93,P < 0.001) (Table 1; Fig. 3D). Sex-specific analyses revealed a more pronounced decrease among males (AAPC: −2.73; 95% CI, − 2.86 to − 2.60,P < 0.001) compared with females (AAPC: −1.80; 95% CI, − 2.00 to − 1.60,P < 0.001) (Fig. 3E-F, Additional file1:Table S1, Table S2). From 1990 to 2021, low-middle SDI regions experienced the most rapid decline in lifetime risk of dying from PUD (AAPC: −2.77; 95% CI, − 3.06 to − 2.48,P < 0.001), whilehigh-middle SDI regions had the slowest reduction (AAPC: −1.54; 95% CI, − 1.79 to − 1.29,P < 0.001) (Table 1; Fig. 3D, Additional file1:Fig.S3D). For males, the fastest decrease occurred in low-middle SDI regions (AAPC: −3.31; 95% CI, − 3.52 to − 3.10,P < 0.001), whereas high-middle SDI regions showed the most modest decline (AAPC: −2.11; 95% CI, − 2.42 to − 1.80)(Fig. 3E, Additional file: Table S1, Fig.S3E). Among females, high-SDI regions exhibited the greatest improvement (AAPC: −2.69; 95% CI, − 2.91 to − 2.48), while high-middle SDI regions demonstrated the least progress (AAPC: −0.85; 95% CI, − 1.36 to − 0.35,P < 0.001) (Fig. 3F, Additional file: Table S2, Fig.S3F).
Sex-specific disparities and Temporal trends in lifetime risks of developing and dying from PUD
Sex ratio in lifetime risks of developing from PUD
Globally, the sex ratio (male to female) in the lifetime risk of developing from PUD decreased from 1.14 (95% CI, 1.14–1.15) in 1990 to 1.00 (95% CI, 0.99–1.00.99.00) in 2021, approaching parity. Regional disparities were evident across SDI regions in 1990, with the highest male predominance in high-middle SDI regions (1.42; 95% CI, 1.41–1.44), followed by middle-SDI regions (1.15; 95% CI, 1.14–1.16), low-SDI regions (1.09; 95% CI, 1.08–1.11), high-SDI regions (1.05; 95% CI, 1.04–1.07), and low-middle SDI regions (1.04; 95% CI, 1.03–1.05) (Table 2). By 2021, all regions showed a decline in the sex ratio compared with 1990; low-middle SDI regions had the lowest ratio (0.83; 95% CI, 0.82–0.84), followed by low-SDI regions (0.92; 95% CI, 0.91–0.93), high-SDI regions (0.96; 95% CI, 0.94–0.99), middle-SDI regions (1.08; 95% CI, 1.07–1.09), and high-middle SDI regions (1.26; 95% CI, 1.24–1.29) (Table 2).The global AAPC in the sex ratio was − 0.42 (95% CI, − 0.45 to − 0.40,P < 0.001). The steepest decline occurred in low-middle SDI regions (AAPC: −0.71; 95% CI, − 0.72 to − 0.66,P < 0.001), while the smallest decline was observed in middle-SDI regions (AAPC: −0.19; 95% CI, − 0.22 to − 0.15,P < 0.001) (Table 2; Fig. 4A). Notably, by 2021, sex ratios in high-SDI, low-middle–SDI, and low-SDI regions had all fallen below 1.00, indicating a higher lifetime risk of developing PUD in females compared with males. However, in high-middle and middle-SDI regions, males continued to bear a higher overall risk than females, though the disparity has been gradually diminishing.In low-middle SDI regions, the inflection point(The year when the risk for females first exceeded that for males) occurred in 1998, after which the lifetime risk for females surpassed that of males. For low-SDI regions, the inflection point emerged in 2013, and in high-SDI regions, it appeared in 2019. (Fig. 4A, Additional file1:Table S3).
Table 2. The sex ratio of global and regional lifetime risk of developing and dying PUD in 1990 and 2021LocationSex ratio of LRDE (95% CI)AAPC(95 CI%),1990–2021P-value for AAPCSex ratio of LRDY (95% CI)AAPC(95 CI%),1990–2021P-value for AAPC1990202119902021Global1.14(1.14,1.15)1.00(0.99,1.00)−0.42(−0.45,−0.40)< 0.0011.30(1.28,1.31)0.96(0.95,0.97)−0.96(−1.01,−0.91)< 0.001High SDI1.05(1.04,1.07)0.96(0.94,0.99)−0.23(−0.29,−0.17)< 0.0011.00(0.99,1.01)0.98(0.96,1.00)−0.18(−0.45, 0.09)0.191High-middle SDI1.42(1.41,1.44)1.26(1.24,1.29)−0.42(−0.46,−0.38)< 0.0011.73(1.69,1.77)1.15(1.12,1.18)−1.44(−1.51,−1.38)< 0.001Middle SDI1.15(1.14,1.16)1.08(1.07,1.09)−0.19(−0.22,−0.15)< 0.0011.17(1.15,1.20)0.92(0.90,0.94)−0.79(−0.83,−0.75)< 0.001Low-middle SDI1.04(1.03,1.05)0.83(0.82,0.84)−0.71(−0.77,−0.66)< 0.0011.29(1.27,1.31)0.85(0.85,0.86)−1.29(−1.41,−1.16)< 0.001Low SDI1.09(1.08,1.11)0.92(0.91,0.93)−0.55(−0.60,−0.50)< 0.0011.20(1.17,1.23)0.85(0.83,0.88)−1.10(−1.18,−1.03)< 0.001LRDE = lifetime risk of developing(%); LRDY = lifetime risk of dying(%);CI = confidence interval; SDI: sociodemographic index
Fig. 4. Sex ratio in lifetime risks of developing and dying from PUD by SDI from 1990 to 2021 A Sex ratio in lifetime risks of developing from PUD B Sex ratio in lifetime risks of dying from PUD
Sex ratio in lifetime risks of dying from PUD
The global sex ratio for the lifetime risk of dying from PUD declined from 1.30 (95% CI, 1.28–1.31) in 1990 to 0.96 (95% CI, 0.95–0.97) in 2021. In 1990, high-middle SDI regions exhibited the largest male predominance (1.73; 95% CI, 1.69–1.77), followed by low-middle SDI regions (1.29; 95% CI, 1.27–1.31), low-SDI regions (1.20; 95% CI, 1.17–1.23), middle-SDI regions (1.17; 95% CI, 1.15–1.18).While high-SDI regions showed no sex disparity (1.00; 95% CI, 0.99–1.01) (Table 2). By 2021, sex ratios showed declining trends across all SDI regions except for high-SDI regions, which demonstrated no significant change. High-middle SDI regions (1.15; 95% CI, 1.12–1.18), middle-SDI regions (0.92; 95% CI, 0.90–0.94), low-middle SDI regions (0.85; 95% CI, 0.85–0.86), and low-SDI regions (0.85; 95% CI, 0.83–0.88).The most rapid decline occurred in high-middle SDI regions (AAPC:−1.44; 95% CI, − 1.51 to − 1.38,P < 0.001), while the slowest reduction was observed in middle-SDI regions (AAPC: −0.79; 95% CI, − 0.83 to − 0.75,P < 0.001). By 2021, with the exception of high-middle SDI regions where males continued to have a higher lifetime risk of dying than females, all other SDI regions demonstrated a higher lifetime risk of dying among females (Table 2; Fig. 4B). For lifetime risk of dying from PUD, the corresponding inflection points occurred in 2006 in low-middle SDI regions, 2012 in middle and low SDI regions. (Table 2; Fig. 4B, Additional file1:Table S4).
Lifetime risks of developing and dying from PUD according to age at diagnosis in 2021
The lifetime risks of developing and dying from PUD decreased significantly with increasing age globally. For the birth-to-death interval, the overall lifetime risk of developing PUD was 3.21% (95% CI, 3.20%−3.22%), which declined to 1.10% (95% CI, 1.10%−1.10%) for those starting at age 70 years. Similarly, the lifetime risk of dying from PUD decreased from 0.35% (95% CI, 0.34%−0.35%) to 0.23% (95% CI, 0.23%−0.23%) across the same age intervals, with a more pronounced reduction observed after age 50 years(Additional file1:Table 5 and Fig.S4).
Comparison between lifetime risk of developing PUD and cumulative risk for ages 0 to 74 years
In 2021, the global cumulative risk of PUD was 3.64% (95% CI, 3.62%−3.66%), higher than the lifetime risk of developing PUD (3.21%; 95% CI, 3.20%−3.22%). Significant variations were observed across SDI regions, the difference between lifetime risk of developing and cumulative incidence risk was greatest in low-SDI regions, reaching 1.37% (95% CI, 1.25%−1.49%). In contrast, in high-SDI regions, cumulative incidence risk was lower than the lifetime risk of developing, with a difference of − 0.45% (95% CI, − 0.55% to − 0.35%)(Additional file1:Table 6 and Fig.S5).
Discussion
Using the GBD 2021 database, this study provides the first comprehensive assessment of lifetime risks of developing and dying from PUD across 21 GBD and 5 SDI regions. Our findings indicate significant global declines in both lifetime risks over the past three decades, alongside pronounced sex and geographic disparities. Previous studies have consistently documented substantial decreases in age-standardized incidence, prevalence, mortality, and disability-adjusted life years(DALYS) of PUD globally since 1990, with these studies consistently reporting higher disease burden in low and low-middle SDI regions and a generally greater burden among males than females. However, using lifetime risk as a new metric, we identified dynamic inflection points where females risks surpassed males risks, challenging prior assumptions of uniformly higher PUD burden in males [19–22, 26].
Between 1990 and 2021, global lifetime risk of developing from PUD decreased from 4.70% to 3.21%, and lifetime risk of dying declined from 0.70% to 0.35%, signifying an overall reduction in the global PUD burden [20–22, 26–28]. The reduction in lifetime risks may be attributed to global efforts in controlling H. pylori infection, rational antibiotic use [29–33], and widespread proton pump inhibitor (PPI) adoption [34–39]. The decline in lifetime risk of dying is likely closely linked to the extensive application of endoscopic technologies; improvements in early diagnosis and treatment have enabled timely and effective intervention for severe PUD complications [40–42]. It is noteworthy that the largest declines in lifetime risks of developing and dying occurred in low-middle SDI regions, likely reflecting higher baseline risks and accelerated improvements.
In 2021, lifetime risk distribution showed marked asymmetry across SDI levels: high-SDI regions carried the highest risk of developing PUD but the lowest risk of dying, while low-SDI regions exhibited the opposite pattern. This asymmetry phenomenon highlights inequities in health resource distribution. Factors contributing to the higher lifetime risk of developing in high-SDI regions include longer life expectancy, lower competing mortality risks from infectious diseases [43–45], and prevalent factors like diets high in fat and sugar [46], NSAIDs use in secondary prevention of cardiovascular and cerebrovascular disease [34], and psychological stressors such as anxiety and depression [47]. At a biological level, chronic psychological stress activates the hypothalamic-pituitary-adrenal axis and sympathetic nervous system, leading to catecholamine and corticosteroid release. This cascade induces intense gastric mucosal vasoconstriction mediated by angiotensin II and endothelin-1, while simultaneously suppressing key defensive mediators like prostaglandins and mucus secretion, thereby disrupting the mucosal barrier and increasing susceptibility to PUD [48]. However, standardized PPI use and widespread availability of advanced endoscopic hemostasis techniques significantly reduced lifetime risk of dying in these regions, while established gastrointestinal cancer screening systems in high-SDI regions concurrently enhanced early-stage PUD intervention rates [7, 39, 49]. In contrast, low-SDI regions face shorter life expectancy, higher competing mortality risks, low endoscopic screening rates, and nonstandardized diagnostic practices, leading to underdiagnosis and thus lower observed lifetime risk of developing [8, 50, 51]. Yet, due to nutritional deficiencies, scarce medical resources, inadequate H. pylori eradication, and limited treatment accessibility, patients with severe PUD often lack timely access to critical care, resulting in higher lifetime risk of dying compared with high-SDI regions [31, 32, 52]. The widespread nutritional deficiencies in these regions, particularly of zinc (a critical cofactor for DNA synthesis and cellular proliferation) and selenium, directly impair mucosal healing and repair processes. Concurrently, limited access to eradication therapy allows H. pylori-induced chronic inflammation and oxidative stress to persist unchecked, significantly increasing the risk of lethal complications [48, 53, 54].These findings suggest that high-SDI regions should further refine NSAIDs prescription management and promote healthy lifestyles, while low-SDI regions need to strengthen diagnostic networks and emergency care systems to mitigate global disparities in PUD burden.
In contrast to the established conclusion from prior research that males remain at persistently higher risk [22],our study reveals dynamic sex-specific patterns in the lifetime risks of PUD, with distinct inflection points in the sex ratio of risk observed across regions stratified by SDI. The earlier reversals in low-middle and low SDI regions may be attributable to socioeconomic disadvantages that disproportionately affect women, including malnutrition, particularly deficiencies in iron and other micronutrients that compromise gastric mucosal barrier function [52], multiparity-related stressors, and delays in screening and eradication of H. pylori infection [17, 18], leading to accelerated accumulation of lifetime risk of developing PUD early in life. In contrast, the delayed reversal in high-SDI regions likely reflects benefits from advanced socioeconomic development and medical technologies, which have substantially reduced overall lifetime risk of developing PUD; however, factors such as population aging, extended female life expectancy, increased NSAID use, and age-related declines in estrogen-mediated protection and gastric mucosal defenses ultimately culminate in female risk exceeding male risk at later time points [34, 55]. The protective role of estrogen is multifaceted. During reproductive years, estrogen contributes to gastric mucosal defense by inhibiting gastric acid secretion, upregulating cyclooxygenase-2 expression to promote the synthesis of cytoprotective prostaglandins, and enhancing mucosal blood flow and duodenal bicarbonate secretion to ensure adequate oxygen supply and neutralize retro-diffused hydrogen ions. The post-menopausal decline in estrogen thus removes this significant biological safeguard, unmasking women’s susceptibility to PUD in their later years [24, 56, 57]. Additionally, since 2020, the lifetime risk of dying from PUD has become higher for females than for males globally, with the exception of high-middle SDI regions. But in high-middle SDI regions, the sex ratio has been declining steadily and is expected to reverse around 2030.This finding challenges the longstanding assumption of persistently higher PUD mortality rates in males and underscores the need for heightened attention to women’s health in lower SDI regions. These findings underscore that global progress has been uneven, leaving low-SDI populations and women disproportionately vulnerable.
Furthermore, discrepancies exist between lifetime risk of developing PUD and the 0- to 74-year cumulative risk. Globally and across high-middle, middle, low-middle, and low-SDI regions, cumulative risk exceeded lifetime risk of developing, with the largest discrepancy observed in low-SDI regions, likely stemming from inadequate chronic disease management, lower survival rates among older adults, and shorter life expectancy. Conversely, in high-SDI regions, cumulative risk was lower than lifetime risk of developing, possibly reflecting better health care standards and longer life expectancy [8, 16].The use of cumulative risk assessment (ages 0–74 years) to estimate PUD burden may introduce bias due to variations in socioeconomic development, health care access, and life expectancy across regions. For instance, this method likely overestimates the actual burden in low-SDI regions while substantially underestimating it in high-SDI regions.
This study innovatively applies the lifetable method to quantify the lifetime risk of PUD, providing new indicators, revealing clear sex- and socioeconomic disparities and underscoring the need for stratified, population-specific policies.In low SDI regions, primary healthcare systems should be strengthened, and facilities should be equipped with rapid urease test reagents to conduct initial screening for H. pylori in patients with typical symptoms. Additionally, for women—particularly those of reproductive age, with multiparity, or experiencing undernutrition—gastrointestinal health assessment should be integrated into antenatal and perinatal services, with provision of selenium and zinc as well as iron supplementation and targeted dietary support. In high SDI regions, weight management policies need to be implemented, with anxiety screening incorporated into routine assessments in gastroenterology clinics. Meanwhile, regular remote endoscopic training should be provided to support low-resource regions. At the global level, PUD should be incorporated into WHO NCD and UHC indicator frameworks with sex- and poverty-disaggregated metrics; remote endoscopy training should be expanded; and interventions targeting women in low-SDI regions should be subject to ongoing evaluation.
While this study has limitations. First, reliance on GBD 2021 data, may introduce diagnostic bias in regions with underdeveloped health systems, potentially leading to overestimation or underestimation of risks in some areas. Second, the analysis reflects regional averages and may not fully capture subnational variations; differences in health care systems, diagnostic criteria, reporting practices, and public health policies could affect accuracy. Future research should validate these estimates using higher-quality epidemiological data and incorporate a broader range of socioeconomic and biological determinants, such as relevant biomarkers, to enhance precision.
Conclusion
This study provides the first global assessment of lifetime risks of developing and dying from PUD, showing marked declines from 1990 to 2021. Yet, disparities remain across SDI regions and sexes. High-SDI regions face higher lifetime risk of developing from PUD but lower lifetime risk of dying, reflecting better healthcare access, while low-SDI regions show the opposite due to diagnostic and treatment gaps. Over time, the burden has shifted, with females surpassing males in several SDI regions. These results highlight the need for equitable, context-specific strategies, including wider H. pylori eradication, rational NSAIDs use, improved endoscopy, and targeted support for women in low-SDI regions. Integrating PUD care into universal health coverage is key to reducing burden and advancing health equity.
Supplementary Information
Supplementary Material 1.
Supplementary Material 2.
Supplementary Material 3.
The reference list from the paper itself. Each links out to its DOI / PubMed record.
- 1NIH Consensus Conference. Helicobacter pylori in peptic ulcer disease. NIH Consensus Development Panel on Helicobacter pylori in Peptic Ulcer Disease. JAMA. 1994;272(1):65–69.8007082 · pubmed ↗
- 2Abdul Rahim NR, Benson J, Grocke K et al. Prevalence of Helicobacter pylori infection in newly arrived refugees attending the migrant health Service, South Australia. Helicobacter. 2017;22(2). 10.1111/hel.12360.10.1111/hel.1236027717096 · doi ↗ · pubmed ↗