Surface Density-Dependent Interactions between Photoactivated Sensory Rhodopsin 2 and Its Transducer
Tatsuya Sakamoto, Jingyi Tang, Soichiro Kato, Insyeerah Binti Muhammad Jauhari, Tatsuro Nishikino, Yuji Furutani

TL;DR
This study investigates how a light-sensitive protein interacts with its transducer, revealing how signals are transmitted in microbial systems.
Contribution
The study uses surface-enhanced infrared spectroscopy to show that the HAMP domain may not be essential for initial signal transduction.
Findings
The light-induced structural changes in pSRII-pHtrII are strongly attenuated in a surface-density-dependent manner.
The suppression of the amide I region is similar in both constructs with and without the HAMP domain.
The conformational change in the membrane region appears to be key for initial signal transduction.
Abstract
Sensory rhodopsin 2 from Natronomonas pharaonis (pSRII) is a heptahelical transmembrane protein that functions as a photosensor of a microbe with its cognate transducer protein, pHtrII, which is a bihelical transmembrane protein with a long cytoplasmic domain for regulation of flagella rotation. It was revealed that pSRII and pHtrII form a 2:2 complex, and the photoreaction induces tilting of the sixth helix (the F helix) in pSRII, which rotates a transmembrane helix of pHtrII. The conformational change is presumably transferred to the cytoplasmic domain through HAMP domains, which are ubiquitous for chemosensory systems. X-ray crystallography on the pSRII complex with pHtrII truncated C-terminal domain did not resolve a HAMP domain because of its structural flexibility. Thus, the involvement of the HAMP domain in the protein–protein interactions between the pSRII and pHtrII complexes…
Genes, proteins, chemicals, diseases, species, mutations and cell lines named across the full text — each resolved to its canonical identifier and authoritative record.
Click any figure to enlarge with its caption.
 1
1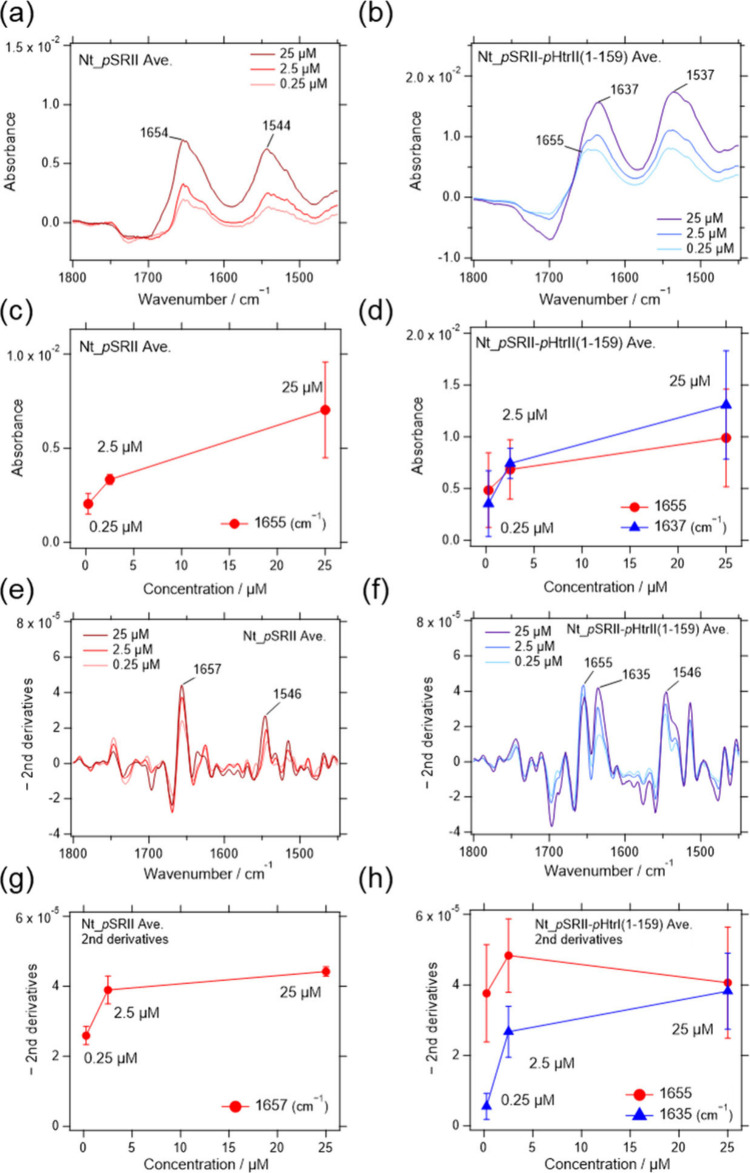 2
2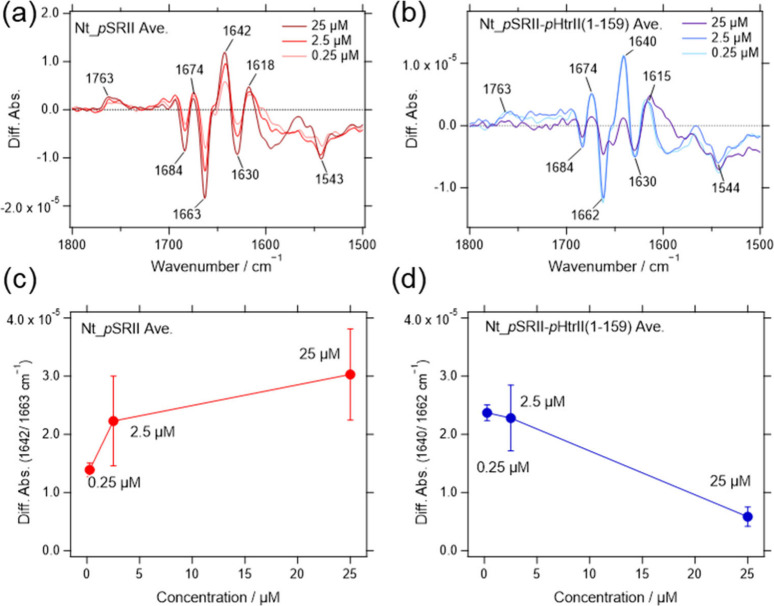 3
3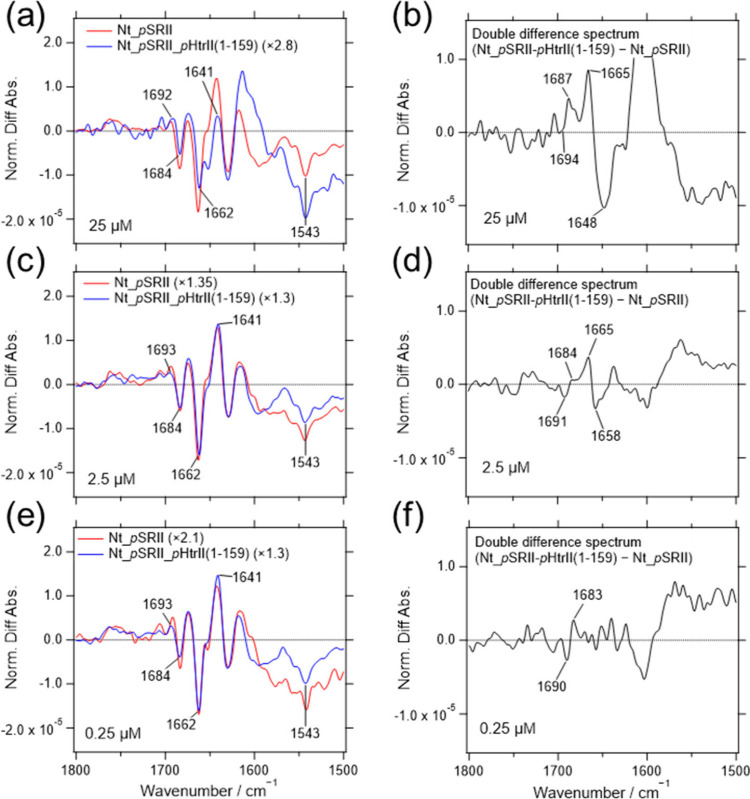 4
4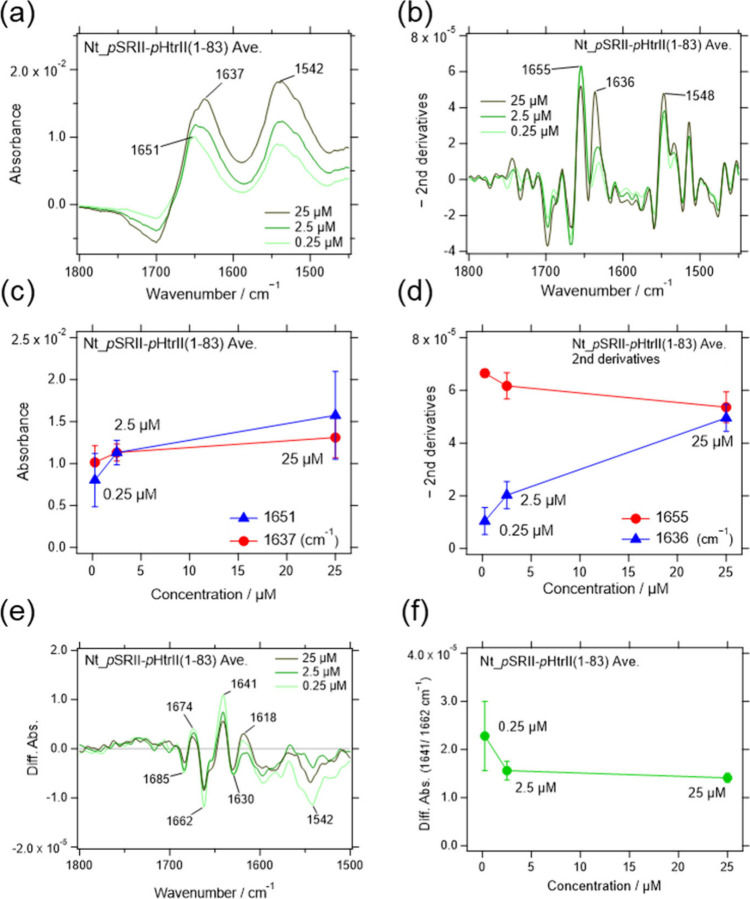 5
5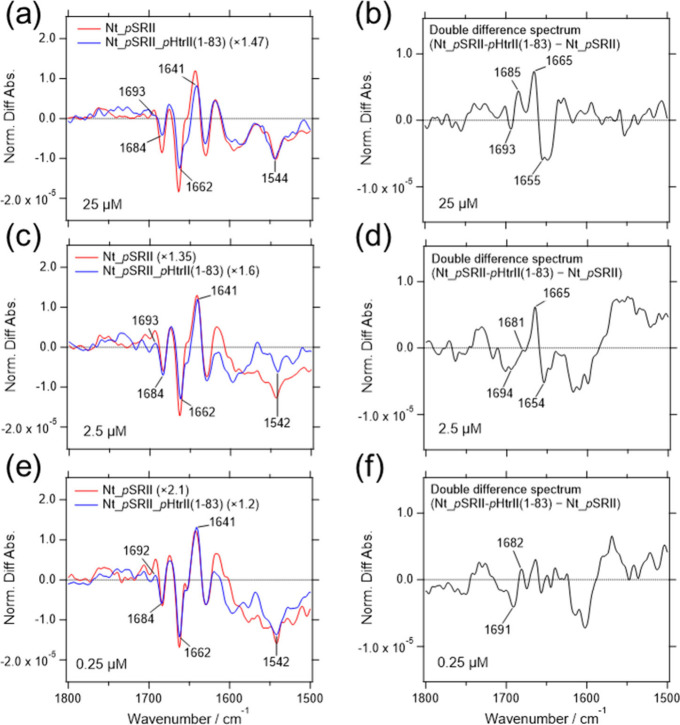 6
6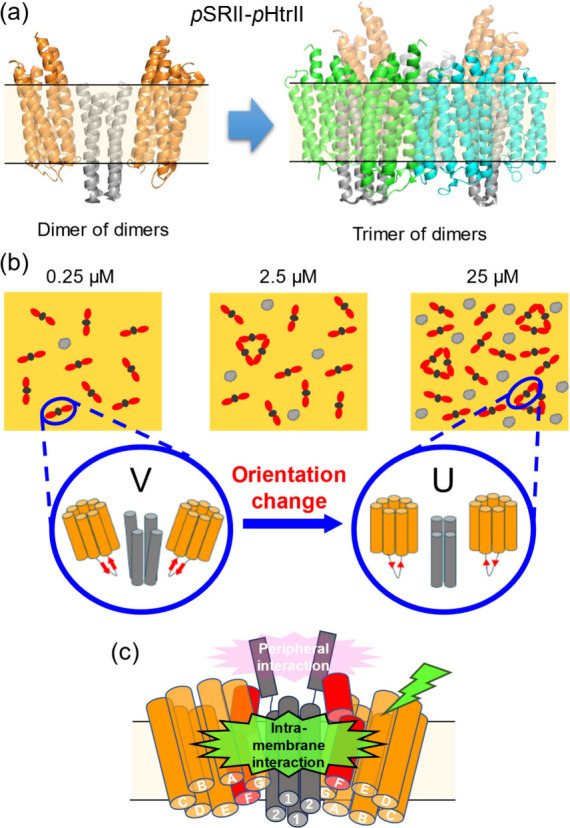 7
7- —Daiko Foundation10.13039/100015120
- —Tatematsu Foundation10.13039/100016729
- —Japan Society for the Promotion of Science10.13039/501100001691
- —Ministry of Education, Culture, Sports, Science and Technology10.13039/501100001700
- —Core Research for Evolutional Science and Technology10.13039/501100003382
Peer Reviews
No public reviews on file for this paper yet. If you reviewed it on a platform where reviews are public (OpenReview, ICLR, NeurIPS, ICML), you can paste yours below so the community can read it here.
Videos
No videos yet. Explain this paper in a talk, walkthrough, or lecture? Add one.
Taxonomy
TopicsPhotoreceptor and optogenetics research · Light effects on plants · Photosynthetic Processes and Mechanisms
Introduction
1
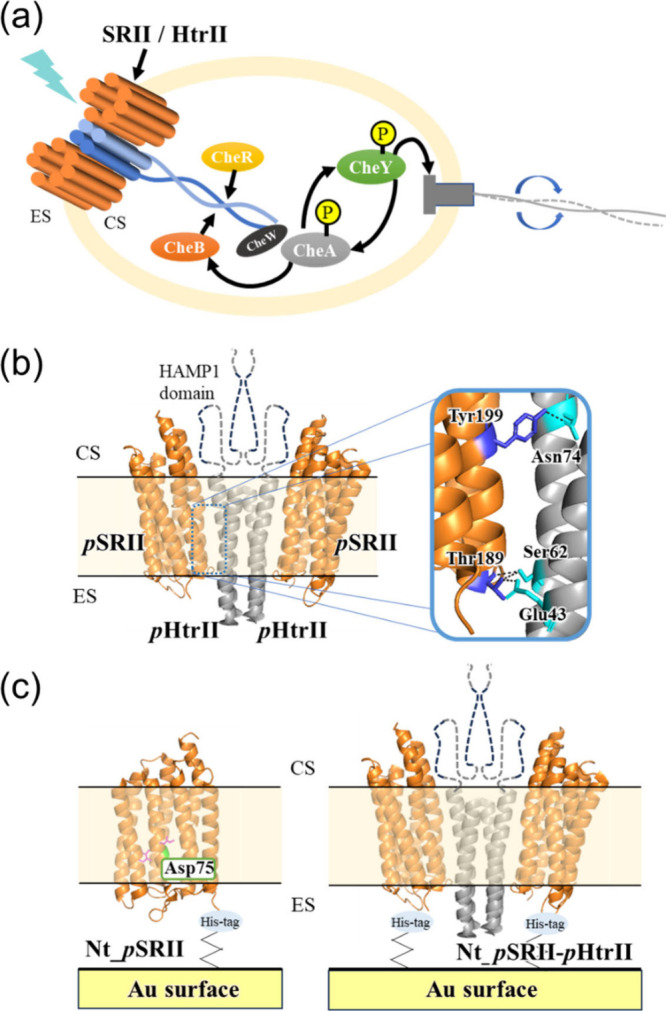
Light detection in the biological system starts with a photoresponsive protein, such as rhodopsin, in our vision, which possesses a retinal chromophore for capturing light. ?,? Photoisomerization of the chromophore (e.g., 11-cis to all-trans in vision) induces a conformational change of the receptor protein and transfers the signal to another protein through protein–protein interaction (PPI). Rhodopsin in vision binds to a trimeric G protein (transducin) as a transducer. In archaea, microbial rhodopsins with all-trans retinal chromophore propagate light signal through a cognate halobacterial transducer protein, HtrI or HtrII. ?−? ? For the negative phototaxis response, sensory rhodopsin 2 (SRII) functions as a light sensor and interacts with HtrII, which regulates the kinases (CheA, CheB, CheR, CheW, and CheY) involved in the two-component system? (Figurea). HtrII interacts with CheW and regulates the phosphorylation of CheA, which is also regulated by CheB and CheR. Finally, phosphorylated CheY interacts with a flagellar motor to change the swimming direction of an archaeal cell.?
(a) Schematic illustration of a bacterial cell possessing a light sensor, the SRII/HtrII complex (2:2), and kinases (CheA, CheB, CheR, CheW, and CheY) involved in the signal transduction, a two-component system, for regulating rotation of a flagellar motor. (b) X-ray crystal structure of pSRII complexed with truncated pHtrII. The HAMP1 domain was not solved by X-ray crystallography, which was included in our expression plasmid. pSRII interacts with pHtrII through hydrogen bonds shown in the inset. (c) The orientation of the pSRII and pSRII-pHtrII fusion proteins used in this study. His-tag at the N-terminus binds the Ni-NTA linker on the gold surface. The ribbon models of pSRII and pHtrII from the PDB codes of 3QAP (pSRII monomer) and 1H2S (pSRII/pHtrII complex) are colored orange and gray, respectively. CS: cytoplasmic side, ES: extracellular side.
The all-trans to 13-cis isomerization of the retinal chromophore initiates the photocyclic reaction of SRII, which sequentially forms intermediates K, L, M, and O and returns to the original state. ?−? ? ? ? ? ? ? ? ? ? ? ? ? ? ? ? The protonated retinal Schiff base (PRSB), which forms a covalent bond with a lysine residue on the seventh helix (G helix), transfers the proton to its counterion, an aspartate residue on the third helix (C helix) upon formation of the M intermediate,? which is the active state of SRII and changes the interaction with HtrII. ?−? ? ? ? ? ? ? ? ? The precise molecular events were mostly studied in SRII found from Natronomonas pharaonis (pSRII), which can be heterologously expressed in E. coli and purified under low-salt conditions. For their feasibility for biophysical experiments, the molecular mechanisms of the photoreaction of pSRII and its signal transduction to pHtrII have been extensively studied. ?−? ? ? ? ? ? ? ? ? ? ? ? ? ? ? ? ? ? ? ? ? ? ? ? ? ? ? ? ? ? ? ? ? ? ? ? ? ? ? ? ? ? ? ? ? ?
Previous X-ray crystallographic studies solved the atomic structures of pSRII alone ?,?,? and its complex with truncated pHtrII. ?,?,?,?
pSRII/ pHtrII forms a 2:2 complex (dimer of dimers) in the unphotolyzed state and the tilt of the F helix in pSRII rotates the second transmembrane helix (TM2) in pHtrII upon formation of the M intermediate state,? which was initially observed by electron paramagnetic resonance (EPR) spectroscopy. ?,?,? According to several reports, the light signal is transmitted to the C-terminal of pHtrII, where the histidine kinase CheA coupled with CheW is attached, through two HAMP domains. ?,?,?,?,?−? ? ?,?−? ? The HAMP1 domain was included in the expression construct for X-ray crystallography; however, the atomic details were not clarified ?,?,?,? (Figureb). It has been widely accepted that a HAMP domain is composed of two α helical regions that interact side by side and are connected to a linker region. ?−? ?,?,?,?,?−? ? ?,?−? ? Therefore, the ambiguity in the X-ray structure was probably due to its structural flexibility. More precise information on PPI was monitored by light-induced difference Fourier transform infrared (FTIR) spectroscopy. ?,?,?,?−? ? The initial proton transfer from the PRSB to its counterion, Asp75, induces the conformation change of pSRII (formation of the intermediate M)^15^ and the hydrogen bond between Tyr199 in pSRII and Asn74 in pHtrII was strengthened ?,? (Figureb). Furthermore, the tilting of the F helix of pSRII is attenuated by the interaction with pHtrII at room temperature upon the formation of the M intermediate. ?,?
Surface-enhanced infrared spectroscopy (SEIRAS) is a powerful tool for measuring infrared absorption spectra of a monolayer of molecules formed on the surface of a gold thin film. ?,? The enhancement is generally limited to ∼10 nm from the surface and highly dependent on the orientation of a vector of a vibrational transition moment of a molecule.? That is, the vibrational mode with the vibrational transition moment perpendicular to the gold surface is highly enhanced. For the transmembrane helical protein, the axis of α helix tends to parallel the membrane normal. ?,? When transmembrane proteins are attached to the surface of the thin gold film with orientation perpendicular to the surface plane, the amide I mode of the helix (∼1654 cm^–1^) is highly enhanced, but the amide II mode (∼1550 cm^–1^) is not. ?,? The amide I mode is mainly composed of the CO stretching modes of the peptide backbone, while the amide II mode is mainly composed of the N–H bending modes. ?,? For the transmembrane helical protein oriented perpendicularly to the gold surface, the CO bonds vibrate along the helix axis; hence, the vibrational transition moments also orient along the normal of the gold surface. On the other hand, the N–H groups laterally vibrate with vibrational transition moments perpendicular to the helix axis and the normal of the gold surface. ?,?
In this study, SEIRAS was applied with light-induced difference spectroscopy to analyze the interactions of pSRII and pHtrII upon the formation of the active state (M intermediate). In particular, the samples were attached to the gold surface by a Ni-NTA linker at the N-terminus of pSRII, allowing the molecules to orient the extracellular side close to the surface and the intracellular side toward the opposite (Figurec). Therefore, PPIs are expected to occur in a similar manner on a native biological membrane. Furthermore, the pHtrII domain truncated at the 83rd or 159th position was fused to the C-terminus of pSRII (Figure S1). The former construct (pSRII-pHtrII(1-83)) does not contain the HAMP1 domain, but the latter construct (pSRII-pHtrII(1-159)) does. The effect of the HAMP1 domain on PPIs was investigated. It should be noted that SEIRAS enhancement is expected to extend throughout the membrane-embedded region, although it may be slightly less sensitive to the HAMP1 domain. Infrared absorption of pSRII increased the intensities dependent on surface density as expected, while those of pSRII-pHtrII(1-83) and pSRII-pHtrII(1-159) changed not only the intensities but also the spectral shapes. The light-induced difference spectra of pSRII-pHtrII(1-83) and pSRII-pHtrII(1-159) were attenuated under the high surface density, which were basically similar to the previous experimental results obtained from randomly oriented samples of pSRII/ pHtrII^28^ (pSRII and the truncated pHtrII(1-159) were prepared separately) and the fusion protein pSRII-pHtrII(1-120).? On the basis of these experimental results, the molecular mechanisms of signal transduction between the pSRII and pHtrII domains are discussed, especially in the integral and peripheral regions of the membrane.
Materials and Methods
2
Construction of the pSRII-pHtrII Fusion Proteins
2.1
To construct the plasmid, pET21a_NtpSRII, cording a hexa-histidine tag for affinity purification fused in the N-terminal of pSRII (Nt_pSRII), the fragment of the pSRII gene was amplified from the plasmid pET21aCtpSRII by PCR using a forward primer containing the NdeI site and hexa-histidine codons (AAGGAGATATACATATGCACCACCACCACCACCACGTGGGACTTACGACCCTC) and a reverse primer containing SacI and EcoRI sites (GACGGAGCTCGAATTCTTAGTCGGCGACCGCAG). The pET21a vector was digested with NdeI and EcoRI, and then, the restricted vector fragment was purified by electrophoresis. The Nt_pSRII gene fragment was inserted into the amplified pET21a vector fragment using In-fusion cloning (Takara), and named pET21aNt_pSRII.
To construct the plasmid pET21a_pSRII-pHtrII_1-159, the vector pET21a with the his 6-pSRII gene was amplified from the plasmid pET21a_Nt_pSRII by PCR using a forward primer containing EcoRI and SacI sites (TAAGAATTCGAGCTCCGTCGAC) and a reverse primer containing the polypeptide linker “ASASNGASA” as used in previous studies ?,? (GACGCGCCTGCGGTCGCCGACGCGAGCGCGAGCAACGGCGCGAGCGCGATGTCGCTGAACGTA). Furthermore, the 1-159 truncated fragment of the pHtrII gene (pHtrII_1-159) was amplified from plasmid pET21a_pHtrII by PCR using a forward primer (ATGTCGCTGAACGTATCACGG) and a reverse primer containing EcoRI and SacI sites (GAGGAGATCAACACGGAACTATAAGAATTCGAGCTC). The pHtrII_1-159 fragment was inserted into the amplified pET21a vector fragment with the his 6 -pSRII gene using In-fusion cloning and named pET21a_pSRII-pHtrII_1-159.
Construction of the plasmid pET21a_pSRII-pHtrII1-83, coding a 1-83 truncation of pHtrII fused in the C-terminal of His_6-pSRII, is performed using the QuikChange method (Agilent) from the plasmid pET21a_pSRII-pHtrII_1-159 using a forward primer (CTTGTCGACGGAGCTCGAATTCTTAGCCCAGCGTGGCAGCAAC) and a reverse primer (GTTGCTGCCACGCTGGGCTAAGAATTCGAGCTCCGTCGACAAG).
All constructs were confirmed by DNA sequencing. The amino acid sequences are shown in Figure S1. The transformation of E. coli was performed by using a standard method using CaCl_2_.
Preparation of the pSRII
Protein
2.2
pSRII possessing a hexa-histidine tag at the N-terminus was expressed in the E. coli C41(DE3) strain. Bacterial cells were grown overnight in 10 mL of 2x YT medium (1.6% (w/v) Tryptone, 1.0% (w/v) Yeast extract, and 0.5% (w/v) NaCl) in shaker flasks at 37 °C and 180 rpm, inoculated in 1.0 L of 2x YT medium, and cultured at 37 °C adding air. When the density of the cells at OD_660_ approximately reached 0.3, isopropyl β-D-thiogalactopyranoside (IPTG) and all-trans retinal were added to final concentrations of 1 mM and 10 μM, respectively, to induce protein overexpression and cultured for 4 h at 37 °C. Cells were harvested by centrifugation and were washed in buffer A (50 mM Tris(hydroxymethyl)aminomethane (Tris)-HCl [pH 8.0], 300 mM NaCl and 5 mM imidazole). To break the cells, the suspension was treated twice with a French press (No. 5501-M, Ohtake Works) at 100 MPa. After unbroken cells were removed by low-speed centrifugation, the samples were ultracentrifuged at 118,000 × g for 1 h. The pellet was suspended and homogenized in buffer B (50 mM 2-morpholinoethanesulfonic acid (MES)-NaOH [pH 6.5], 300 mM NaCl, 5 mM imidazole) and stored at −80 °C until use. The frozen sample was thawed and stirred in a water bath. To solubilize the suspension, n-dodecyl-β-d-maltoside (DDM) was added to the final concentration of 1% (w/v) and stirred overnight at 4 °C. The insoluble materials were removed by centrifugation (118,000 × g for 30 min). The resulting supernatants were mixed with 10 mL of nickel-nitrilotriacetic acid (Ni-NTA) agarose resin (QIAGEN) in a polypropylene column by a batch method. After the supernatant was eluted in the column, buffer C (50 mM MES-NaOH [pH 6.5], 300 mM NaCl, 50 mM imidazole, 0.1% (w/v) DDM) was added to wash the column. To elute the His-tag protein from the resin, buffer E (50 mM Tris-HCl [pH 7.0], 300 mM NaCl, 150 mM imidazole, and 0.1% (w/v) DDM) was added, and the mixture was collected.
Preparation of the pSRII-pHtrII Fusion Proteins
2.3
E. coli C41 (DE3) cells carried the plasmid based on pET21a coded pSRII-pHtrII_1-159 or pSRII-pHtrII_1-83 with a hexa-histidine tag at its N-terminus cultured for protein expression. The cultivation, solubilization, and purification with a Ni-NTA column were modified from the protocol described in the previous section. For further purification, size-exclusion chromatography was applied after Ni-NTA column purification.
The bacterial cells were grown overnight in 20 mL of LB medium (1.0% (w/v) Tryptone, 0.5% (w/v) Yeast extract, and 0.5% (w/v) NaCl) at 37 °C, inoculated in 2.0 L of 2x YT medium, and cultured at 37 °C. When the cell density at OD_660_ approximately reached at 0.4, IPTG and all-trans retinal were added to a final concentration of 1.0 mM and 10 μM, respectively, to induce protein overexpression and cultured for 1 day at 37 °C. Cells were harvested by centrifugation, the cells weight was measured, and suspended in 7 mL of buffer F (50 mM Tris-HCl [pH 8.0], 300 mM NaCl and 5 mM Imidazole) per 1 g (wet weight) of cells. To break the cells, the suspension was treated twice by the French press at 100 MPa. After unbroken cells were removed by low-speed centrifugation, the samples were ultracentrifuged at 118,000 × g for 1 h. The pellet was suspended in the original volume of buffer F and stored at −80 °C until use. The frozen sample was thawed and stirred in the water bath. To solubilize the suspension, DDM was added to the final concentration of 1% (w/v) and stirred for at least 60 min at 4 °C. Insoluble materials were removed by centrifugation (118,000 × g for 30 min). The resulting supernatants were mixed with 30 mL of Ni-NTA agarose resin (Fujifilm Wako) in a polypropylene column by batch method. After eluting the supernatant in the column, 150 mL of buffer B′ (50 mM Tris-HCl [pH 8], 300 mM NaCl, 10 mM Imidazole, 0.1% (w/v) DDM) was added to wash the column. To elute the His-tag protein from the resin, 40 mL of buffer C’ (50 mM Tris-HCl, pH 7.0, 300 mM NaCl, 300 mM imidazole, and 0.1% (w/v) DDM) was added and collected in 5 mL fractions. The His-tag affinity-purified pSRII-pHtrII(1-159) or pSRII-pHtrII(1-83) proteins were concentrated in 0.4 mL using an Amicon device with 30 kDa cutoff (Merck Millipore), loaded onto a size-exclusion column (Superdex 200 increase 10/300 column, Citiva) equilibrated with buffer D (100 mM NaH_2_PO_4_ [pH7.0], 150 mM NaCl and 0.1% (w/v) DDM) and eluted with buffer D at the flow rate of 0.5 mL min^–1^. The peak fractions were collected and measured by 500 and 280 nm absorption using ultraviolet–visible (UV–vis) spectrometry (V-730, Jasco).
Vacuum Deposition of a Thin Gold Film for
SEIRAS
2.4
A vacuum chamber was used for the deposition of a thin gold film on a Si crystal (ATR crystal used for VeeMaxII, PIKE Technology, USA), which was performed similarly to previous papers. ?,? To avoid oil mist contamination, in this study, a turbomolecular pump (HiPace 80, PFEIFFER, Germany) was used connected to a dry vacuum pump (NeoDry15 × 10^–1^, Kashiyama, Japan). The thickness of the gold thin film was monitored by a QCM sensor (008–101-G10, 6 MHz gold-coated crystal) connected to a deposition monitor (XTM/2 deposition monitor, INFICON). A 9.0 nm gold thin film was evaporated onto the Si crystal at a deposition rate of 0.1 nm/min up to 1.0 and 0.2 nm/min beyond 1.0 nm, in a vacuum of 0.50 × 10^–5^ Torr or less. The Si crystal and QCM were cooled by circulating water at 25 °C (Si crystal) and 24 °C (QCM) from thermostatic baths (ALPHA RA8, LAUDA).
Modification of the Thin Gold Surface for
Protein Adsorption with Ni-NTA Linker
2.5
A gold thin film used for SEIRAS was modified by Ni-NTA according to the previous report. ?,? Each modification step was monitored in situ by SEIRAS. First, the gold thin film was exposed to a 200 μL solution of 2 mg/mL dithiobis (succinimidyl propionate) (DTSP, Thermo Fisher Scientific) in dimethyl sulfoxide (DMSO) for 20 min. After washing the surface with 200 μL of DMSO four times, the DMSO solution was dried in a nitrogen stream. Next, the TSP monolayer was immersed in 200 μL aqueous solution of 40 mg/mL of N-(5-amino-1-carboxypentyl)-iminodiacetic acid (AB-NTA, Dojindo) in 0.5 M K_2_CO_3_ buffer (pH 9.8). The excess AB-NTA was removed by washing the surface with 200 μL of high-purity water three times and then once with a 200 μL solution of 50 mM acetate buffer (pH 5.5). The NTA-modified surface was incubated with a 200 μL solution of 40 mM NiSO_4_ in 50 mM acetate buffer (pH 5.5). In this process, a Ni^2+^ ion is coordinated via three carboxylates and a tertiary amine in an NTA linker. After washing the surface with 200 μL of buffer D twice, 200 μL of the protein-solubilized solution was added and left for 1 h 40 min to connect the hexa-histidine-tag pSRII or pSRII-pHtrII fusion proteins with Ni-NTA linkers. The sample concentration for the adsorption process was 0.25, 2.5, or 25 μM (0.01, 0.1, or 1.0 absorbance at λ_max_ (∼500 nm) of each sample). After the protein monolayer was formed on the gold surface, excess protein-solubilized solution was removed and the surface was washed with 200 μL buffer D three times. Reconstitution of the protein into the lipid bilayer was carried out by adding 200 μL solution of 2 mg/mL L-α-phosphatidylcholine (egg-PC, SIGMA) in PC buffer (50 mM HEPES, 140 mM NaCl, 0.2 w/v% DDM (pH 7.0)) and then removing the DDM detergent with 20 mg of adsorbent (SM-2, Biobeads, Bio-Rad). Finally, the protein monolayer embedded in the lipid bilayer was washed by dialysis buffer without DDM until all excess lipid was removed.
Light-Induced Difference Spectroscopy with
SEIRAS
2.6
Infrared spectra of SEIRAS were measured with a FTIR spectrometer (Vertex70, Bruker) at a resolution of 2 cm^–1^, sample scan: 32 scans, background scan: 128 scans, save data range: 4000–700 cm^–1^, aperture: 4 mm, acquisition range: 6000–0 cm^–1^, and averaged 100 times for each condition. The protein-modified Si ATR crystal was placed on an ATR accessory (VeeMaxII, PIEK Technology, USA). The incident angle was set to 48 degrees. An IR polarizer was not installed to increase the signal-to-noise ratio. The sample chamber temperature was kept at 20 °C by placing a copper jacket with circulating water from a thermostat bath (Alpha RA8, LAUDA). The sample was irradiated with 30 mW light from a metal halide light source (IMH-250, SIGMAKOKI, Japan) through a 500 nm interference filter, and the dark and light procedure cycle (30 s in the dark and 10 s of light irradiation) was repeated 100 times to calculate the light-dark difference spectrum. For accumulating the light state (M intermediate), measurements of the light spectra were performed during light irradiation. Then, the optical filter was changed to 560 nm; measurements were made in the same way as for 500 nm; and the difference spectrum was calculated. Finally, the light-dark difference spectrum at 560 nm was subtracted from the light-dark difference spectrum at 500 nm to remove the spectral change caused by photoreactions other than protein samples (photoresponse of the Si surface covered by a thin gold film).
Results
3
Infrared Absorption Spectra of pSRII and pSRII-pHtrII(1-159) in
the Amide I and II Regions Recorded by SEIRAS at Different Protein Concentrations
3.1
SEIRAS makes it possible to measure a protein monolayer on a metal surface (usually Au). ?,?,?,?,?−? ? ? ? The constructs of pSRII and pSRII-pHtrII contain a hexa-histidine tag at the N-terminus (Figure S1). Therefore, the extracellular sides of the pSRII and pSRII-pHtrII molecules are expected to attach to the gold surface through a Ni-NTA linker, as shown in Figurec. Protein orientations are also expected to be uniformly aligned on the surface. ?,? The situation would be different from the proteins reconstituted in liposomes with a random orientation. In the physiological membrane in bacteria, the N-terminus of pSRII protrudes outward from the membrane, and the C-terminus of pHtrII is prolonged to the intracellular side. Therefore, SEIRAS is an ideal IR measurement method for analyzing the molecular interactions between pSRII and pHtrII with physiological orientations in the lipid bilayer.
The peptide backbone is composed of the CO and N–H groups in the peptide bonds, which exhibit strong infrared absorption bands called amide I (1695–1623 cm^–1^) and amide II (∼1550 cm^–1^). ?,? SEIRAS monitored the adsorption processes of pSRII and pSRII-pHtrII(1-159) in the amide I and II regions (Figures S2 and S3). The final infrared absorption spectra recorded after incubation for 100 min are shown in Figure. As expected, the intensities of the amide I (1654 cm^–1^) band of pSRII increased depending on the concentrations of pSRII (Figurec). The spectral shapes were unchanged (Figurea), suggesting that the conformation of pSRII did not change with increasing surface density on the Ni-NTA-modified gold surface. The results were demonstrated more clearly by calculating the second derivative of the spectra (Figurese,g).
Infrared absorption spectra of (a) pSRII and (b) pSRII-pHtrII(1-159) obtained by SEIRAS Sample concentrations for adsorption on the Ni-NTA-modified gold surface were 0.25, 2.5, and 25 μM. Three and four experiments were averaged for pSRII and pSRII-pHtrII(1-159), respectively. (c, d) Absorption at the peaks (pSRII; 1654 cm–1, pSRII-pHtrII(1-159); 1637 and 1655 cm–1) are plotted against the sample concentrations. (e, f) The second derivatives multiplied by −1 were calculated for each sample. (g, h) The peak values in the second derivative spectra were plotted as in (c, d).
However, pSRII-pHtrII(1-159) exhibited unexpected spectral changes dependent on the protein concentrations. As shown in Figureb, the amide I bands showed a broad shape compared with pSRII. Furthermore, the peak positions gradually changed from 1655 to 1637 cm^–1^ (Figureb,d). The results were also confirmed in the second derivative spectra (Figuref,h). The peak position of an amide I band is generally used for analysis of the secondary structure of protein. ?,? A protein with helical structures exhibits a strong peak at ∼1654 cm^–1^, while that with β-sheet structures exhibits a strong peak at 1634 cm^–1^. ?,? Therefore, it might suggest that pSRII-pHtrII(1-159) increases the β-sheet structure with an increase in the surface density. However, it is not likely that, according to the X-ray structure of the 2:2 complex of pSRII and pHtrII? (Figureb), the major parts are composed of helical structures except for a small β-sheet structure in the extracellular loop in pSRII. Furthermore, such spectral changes were not observed in the absorption spectra of pSRII-pHtrII(1-159) reconstituted in liposomes (Figure S4). Therefore, concentration-dependent spectral changes of pSRII-pHtrII(1-159) were only observable by SEIRAS. The optical purities of pSRII and pSRII-pHtrII fusion proteins are shown in Figure S5. The absorbance ratio at 278 and 498 nm is 1.56 for pSRII and 2.23 for pSRII-pHtrII(1-159), indicating that pSRII-pHtrII(1-159) has slightly lower purity than pSRII. No obvious contamination by unidentified proteins was observed in conventional FTIR spectroscopy (Figure S4); however, an unidentified protein component was detected in SEIRAS measurements. This may suggest that the contaminating proteins were preferentially adsorbed onto the Ni-NTA-modified gold surface.
A noticeable negative band around 1700 cm^–1^ is observed, particularly in pSRII-pHtrII fusion proteins. This feature may arise from the removal of interfacial water moleculesspecifically their O–H bending vibrationsupon protein adsorption to the surface, as well as from changes in the refractive index associated with an increase in the amount of material on the gold surface. The depletion of water molecules is also supported by the presence of a negative band in the 3000–3600 cm^–1^ region (Figure S6).
As shown in Figure S7, no disappearance of the amide I band was observed after reconstitution. The band at 1631 cm^–1^ is attributed to the O–H bending vibrations of water that were excluded during the formation of the lipid bilayer. The band at 1743 cm^–1^ likely originates from the CO stretching vibration of the ester groups in the lipid molecules. In the C–H stretching region, bands at 2924 and 2853 cm^–1^ are clearly assigned to the CH stretching vibrations of the alkyl chains of the lipids.
These spectra were recorded after re-establishing the background following the immobilization of pSRII or the pSRII–pHtrII fusion proteins on the Ni-NTA-modified surface. If protein denaturation or desorption had occurred during the lipid reconstitution process, we would expect detectable changes in the amide I or II regions. However, no such changes were observed, further supporting that the proteins remained structurally intact throughout the reconstitution procedure.
Comparison of Light-Induced Structural Changes
of pSRII and pSRII-pHtrII(1-159) with Different Surface Concentrations Monitored by SEIRAS
3.2
The active state of pSRII, M intermediate, is formed by irradiation with blue light. ?,? To investigate the molecular mechanism of signal transmission from pSRII to pHtrII, blue light (500 nm) was irradiated on pSRII and pSRII-pHtrII(1-159) modified on the gold surface and reconstituted into a lipid bilayer. Light-induced difference spectra were measured by SEIRAS. However, the light-induced difference spectrum recorded between the continuously illuminated condition and the dark state containing spectral changes of components adsorbed on the Si surfacesuch as the Ni-NTA linker, proteins, lipids, and interfacial water molecules, is influenced by the photoresponse of the silicon substrate, as shown in Figure S8a. Therefore, the light-induced difference spectra with green light illumination (560 nm), which does not activate pSRII, were measured as a reference. The double difference spectra between these two illumination conditions were calculated as the final light-induced difference spectra of pSRII and pSRII-pHtrII(1-159). For example, the light-induced difference spectrum of pSRII was obtained as shown in Figure S8b. Upon the formation of the M intermediate, the protonated retinal Schiff base is deprotonated, and its counterion, Asp75, receives the proton.? The positive band at 1762 cm^–1^ was previously assigned to the carboxyl CO stretching band of Asp75.? The negative band at 1543 cm^–1^ was assigned to the ethylenic CC stretching mode of the retinal chromophore in the dark state of pSRII. These features are very characteristic of the light-induced difference spectrum between the M intermediate and the dark state of pSRII.
The protein concentration dependencies on the light-induced difference spectra of pSRII and pSRII-pHtrII(1-159) were analyzed (Figure). The amplitude of the spectral change of pSRII increased with increasing protein concentration (Figurea,c), which is reasonable because the surface density of pSRII increases, as seen in the absorption spectra (Figurea). That is, the amplitudes of the amide I bands between 1642 and 1663 cm^–1^ (Figurec) showed a trend similar to those of the amide I bands at 1655 cm^–1^ in the absorption spectra (Figurec). However, the amplitude of the spectral change of pSRII-pHtrII(1-159) decreased despite the increase in protein concentration (Figureb,d). Consequently, the amplitudes of the amide I bands between 1640 and 1662 cm^–1^ (Figured) showed a trend opposite those of the amide I bands at 1637 and 1655 cm^–1^ in the absorption spectra (Figured). Our results suggest that the fractional coverage of pSRII-pHtrII(1-159) on the Ni-NTA-modified gold surface decreases with increasing the protein concentration. Increased adsorption of β-sheet-rich contaminants (monitored at 1637 cm^–1^) likely dilutes the surface density of pSRII-pHtrII(1-159), resulting in a smaller light-induced difference signal. Could PPIs between pSRII and pHtrII further influence the surface packing and signal amplitude?
Light-induced difference infrared spectra of (a) pSRII and (b) pSRII-pHtrII(1-159) obtained by SEIRA spectroscopy. The spectra were recorded in the samples adsorbed on the Ni-NTA-modified gold surface at protein concentrations of 0.25, 2.5, and 25 μM. The difference in absorbance between 1642 and 1663 cm–1 is plotted with a function of protein concentration for (c) pSRII and (d) pSRII-pHtrII(1-159) (d). The error bars are the standard deviations calculated from three independent experiments (pSRII) and four (pSRII-pHtrII (1-159)).
The concentration-dependent effects of the formation of the complex with the pHtrII(1-159) domain were analyzed by comparing the light-induced difference spectra of pSRII and pSRII-pHtrII(1-159) after normalization using the negative peak at 1543 cm^–1^ (Figure). Interestingly, the attenuation of the peaks at 1641 and 1662 cm^–1^ was clearly dependent on the protein concentration applied in the adsorption process, as shown in Figurea, c, e. That is, the decrease in the light-induced difference spectra in pSRII-pHtrII(1-159) at a high protein concentration cannot be solely explained by the existence of contaminated proteins. It was also confirmed in the double difference spectra in Figureb,d,f. The pair of maximums at 1648 and 1665 cm^–1^ was evidently observed in Figureb (25 μM). The small pair of peaks at ∼1683 and ∼1690 cm^–1^ was probably originated from the CO stretching vibration of Asn74 at pHtrII, which was assigned in the previous studies. ?,? The CO stretching vibration of Asn74 was generally observed at concentrations of 0.25, 2.5, and 25 μM. These results suggest that the hydrogen-bonding interaction of Asn74 in pHtrII with Tyr199 in pSRII changes similarly independent of the surface density of the complex. However, the PPI that prevents the tilting motion of the F helix in pSRII is highly dependent on the surface density. Attenuation of the spectral change in the amide I region was also confirmed in the reconstituted liposomes of pSRII-pHtrII(1-159) (Figure S9) as reported for the complex of pSRII and pHtrII(1-159) proteins prepared separately? and the fusion protein pSRII-pHtrII(1-120).? In liposomes, the complexes of pSRII-pHtrII(1-159) formed structures of higher order (trimer of dimers) observed by electron microscopy.? The formation of higher-order structures may be hampered in pSRII-pHtrII(1-159) dispersedly adsorbed on the Ni-NTA modified gold surface.
Comparison of the light-induced difference spectra of pSRII and pSRII-pHtrII(1-159) after normalization The light-induced difference spectra (a, c, e in the left panel) were normalized based on the substantial amplitude of the negative peak at the retinal ethylenic CC stretching vibration at 1543 cm–1. The normalization factors are shown in parentheses after the sample names. The double difference spectra (b, d, and f in the right panel) were calculated by subtracting the difference spectrum of pSRII from those of the pSRII-pHtrII(1-159). Sample concentrations for adsorption were 25, 2.5, and 0.25 μM as indicated in each panel.
The HAMP1 Domain Is Not Critical for Protein–Protein
Interactions between pSRII and pHtrII in the Membrane-Embedded Domains
3.3
The light-induced difference spectra with different surface densities elucidated the PPIs between pSRII and pHtrII truncated at the 159th position. Concentration-dependent suppression of light-induced conformation change after the formation of the M intermediate is reflected in the decrease in the positive band at 1641 cm^–1^ and the negative band at 1662 cm^–1^ in accordance with the increase in the protein concentration (Figure). In previous FTIR spectroscopy on the pSRII/pHtrII(1-159) complex reconstituted in liposomes, the attenuation of the spectral change in the amide I bands was observed in a temperature-dependent manner.? This difference highlights the characteristic features of the SEIRAS experiments. It should be mentioned that attenuation was not observed in the pSRII complex with the G83C or G83F mutant of pHtrII(1-159).? Therefore, the previous report stressed the importance of the HAMP1 domain, which plays a crucial role in the suppression of the tilting movement of the F helix of pSRII upon M formation.?
Interestingly, a concentration-dependent increase in the amide I band was observed similarly at 1637 cm^–1^ in pSRII-pHtrII(1-83) lacking the HAMP1 domain (Figurea–d). This result excluded the possibility that the HAMP1 domain formed β-sheet structure in the condensed environment, which is consistent with previous experimental and theoretical studies reporting that the HAMP domains are mainly constructed from α helical structures. ?,?,?,?−? ? ?,?,? It also supports the assumption that the increase in the 1637 cm^–1^ band is probably due to contaminated proteins.
Infrared absorption spectra of pSRII-pHtrII(1-83) obtained by SEIRAS. (a) Sample concentrations for adsorption on the Ni-NTA-modified gold surface were 0.25, 2.5, and 25 μM. Three experiments were averaged. (b) The second derivatives multiplied by −1 were calculated for each sample. (c) Absorption at the peaks (pSRII-pHtrII(1-83); 1637 and 1651 cm–1) are plotted against the sample concentrations. (d) The peak values in the second derivative spectra were plotted similarly to (c). (e) The light-induced difference infrared spectra of pSRII-pHtrII(1-83) were obtained by SEIRA spectroscopy. (f) The amplitudes between the positive peak at 1641 cm–1 and the negative peak at 1662 cm–1 are plotted as a function of the sample concentrations.
The amide I bands at 1641 and 1662 cm^–1^ in the light-induced difference spectra of pSRII-pHtrII(1-83) decreased their intensities with increased protein concentration (Figuree,f). The reduction was slightly reduced compared to that observed in pSRII-pHtrII(1-159) (Figureb,d), suggesting that the interaction with the HAMP1 domain partially contributes to the suppression of the tilt of the F helix in pSRII. This fact was confirmed in this SEIRAS experiment for the first time. The fusion protein pSRII-pHtrII(1-83) would force the pHtrII transmembrane domain to lie adjacent to the pSRII domain, which cannot be achieved by the complex formation of separately prepared pSRII and pHtrII(1-83) due to their weak affinity.?
After normalizing the light-induced difference spectra and calculating the double difference spectra between the pSRII and pSRII-pHtrII(1-83) spectra, the CO stretching band of Asn74 in the pHtrII(1-83) was confirmed under the conditions of 0.25, 2.5, and 25 μM concentrations (Figure). The results are further evidence of the existence of the PPI in the pSRII-pHtrII(1-83) fusion protein in the membrane-embedded region. Concentration-dependent suppression of the positive band at 1641 cm^–1^ and the negative band at 1662 cm^–1^ in the amide I region was observed in pSRII-pHtrII(1-83) as well. The reduction was slightly lower than that of the pSRII-pHtrII(1-159) especially at 25 μM concentration (compare Figurea,b with Figurea,b, respectively), which would be interpreted as indicating that the HAMP1 domain contributes partially to the suppression.
Comparison of the light-induced difference spectra of pSRII-pHtrII(1-83) after normalization The light-induced difference spectra (a, c, and e in the left panel) were normalized based on the substantial amplitude of the negative peak from the retinal ethylenic CC stretching vibration at 1543 cm–1. The normalization factors are shown in parentheses after the sample names. The double difference spectra (b, d, and f in the right panel) were calculated by subtracting the difference spectrum of pSRII from those of the pSRII-pHtrII(1-83). The sample concentrations for adsorption were 25, 2.5, and 0.25 μM as indicated in each panel.
To confirm the validity of the pSRII-pHtrII fusion constructs, the PPIs between the pSRII and truncated pHtrII domains were analyzed by flash photolysis spectroscopy (Figure S10). The decay kinetics of the M intermediate of pSRII was reported to be delayed in the formation of the complex with a truncated pHtrII. ?,?,? Flash photolysis data of pSRII, pSRII-pHtrII(1-83), and pSRII-pHtrII(1-159) were recorded at 390 (M intermediate) and 500 nm (the dark state). The sample concentrations were approximately equal to 10 μM. The time constants were obtained by fitting the data with multiple exponential functions (Table S2). The rise kinetics (τ_1_ and τ_2_) of the M intermediate are almost the same among the three samples. However, the decay kinetics (τ_3_ and τ_4_) of the M intermediates were different from each other. The weighted average of the M decay time constants (τ_M_) increased from 0.61 s in pSRII to 0.88 s in pSRII-pHtrII(1-83) and 0.99 s in pSRII-pHtrII(1-159) (Table S2). The value of the pSRII was almost the same as the previous experiment (0.60 s), although the value of pSRII-pHtrII(1-159) was slightly lower than the previous experiment with the complex of pSRII and pHtrII(1-159) prepared separately (1.22 s).? A previous experiment reported that pSRII did not bind to pHtrII(1-83) due to the low affinity.? Therefore, the effect of pHtrII(1-83) on the decay kinetics of the M intermediate has not been clarified so far. It is interesting that the decay time constant of pSRII-pHtrII(1-83) was between those of the other two. These results support the notion that the PPIs between pSRII and the truncated pHtrII in the membrane-embedded domains mainly affect the decay kinetics of the M intermediate pSRII in the fusion proteins.
Discussion
4
Two molecules of pSRII and pHtrII form a 2:2 complex, and three sets of the 2:2 complex gather to form a trimer of dimers, as reported in previous studies ?,?,? (Figurea). Furthermore, six sets of the trimers form an O-shaped ring structure even in detergent micelles.? In addition to the formation of the large quaternary structure of the pSRII and pHtrII complexes, two types of protein conformation were reported in the transmembrane region (U and V shapes) by X-ray crystallography. ?,? These experimental aspects would be useful for understanding the SEIRAS experiments in this study.
X-ray crystal structure of the pSRII/ pHtrII complex and a putative model of the trimer of dimers (a) and schematic figures explaining the surface density-dependent conformation change of the pSRII and pHtrII complex (b) and its photoinduced structural change (c) (a) Three 2:2 complexes of pSRII and pHtrII (dimer of dimers) gather to form a trimer (trimer of dimers). The ribbon models of pSRII and pHtrII from PDB entry 1H2S are shown in orange and gray. Additional pSRII and pHrtII are duplications and are colored green and cyan. (b) Two conformers (V- and U-shaped) were reported by X-ray crystallography, which change the orientations of α helices that make up pSRII and pHtrII. The formation of the trimer of dimers and the conformation changes may depend on the surface density of pSRII and pHtrII molecules. Contaminate proteins are depicted by gray objects. (c) SEIRAS demonstrated that the light-induced conformation change of pSRII is mainly suppressed by intramembrane interaction with pHtrII. The cylinder models of pSRII and pHtrII in the same color as (a) are shown and the F-helices of pSRII are colored in red.
SEIRAS monitored surface density-dependent spectral changes in the amide I region of the pSRII-pHtrII fusion proteins. pSRII-pHtrII(1-159) contains a HAMP1 domain, and pSRII-pHtrII(1-83) does not. Therefore, the increases in the amide I band at 1637 cm^–1^, which is characteristic of β sheet structure, cannot be assigned to the change in conformation of the HAMP1 domain. According to the literatures, pSRII and pHtrII are basically composed of α helical structures. ?,?,?,?,?−? ? Therefore, it was very unlikely that these α-helical structures would convert to β sheet structures. The HAMP1 domain is a flexible region and the atomic structure of the domain was not solved by X-ray crystallography.? However, analysis using nuclear magnetic resonance (NMR) spectroscopy in solution state revealed that the HAMP1 domain is also composed of helical structures.? At the beginning of this study, we speculated that the HAMP1 domain can be converted to β sheet structures in the trimer form. This possibility was completely abolished by the fact that pSRII-pHtrII(1-83) increases the amide I band at 1637 cm^–1^ as similarly to pSRII-pHtrII(1-159).
It could also be possible that, in the case of the pSRII-pHtrII fusion protein, partial unfolding may occur due to structural instability within the pHtrII region. Moreover, in the SEIRA spectra, the amide I/amide II ratio is not as high as would be predicted based on the orientation selectivity of SEIRAS. However, in the light-induced difference spectra obtained by SEIRA, the CC stretching vibration of the retinal polyene chain appears relatively small, whereas the amide I changes are pronounced, as compared with the conventional light-induced difference spectra shown in Figure S9. These observations suggest that at least for the photoactive fractions of pSRII and the pSRII-pHtrII fusion protein, the proteins are indeed oriented within the lipid membrane.
To understand the SEIRAS results for the light-induced difference spectra of pSRII-pHtrII fusion proteins, we propose a working hypothesis that the pSRII-pHtrII fusion proteins change their quaternary structures in response to increased molecular crowding within the lipid membrane (Figureb). In a dispersed condition, most of the α helices in the pSRII-pHtrII fusion proteins orient almost perpendicularly to the gold surface. However, the absence of neighboring proteins may allow pSRII-pHtrII in dimers to tilt the helices to some extent (a model in the left circle in Figureb). This form would be like the V-shaped form revealed by previous X-ray crystallography.? In proportion to the increase in surface density, the pSRII-pHtrII fusion proteins form complexes with higher orders such as trimer of dimers. ?,?,? In addition, other membrane proteins may act as compressor molecules, increasing the number of tight interactions between pSRII-pHtrII complexes. This effect was unexpectedly observed in this study, where an unintentionally contaminated β-sheet–rich protein acted as a molecular crowder. In a condensed state, the helices in the pSRII-pHtrII fusion proteins tend to be tightly packed similar to the U-shaped form reported in the X-ray crystal structure? (a model in the right circle in Figureb). The quaternary structural change would be required to reduce the light-induced spectral change in the amide I region.The molecular mechanism of the signal transfer from pSRII to pHtrII has been extensively studied. Here is the first experimental result obtained by SEIRAS for this topic. In the previous FTIR study, PPI in the membrane domain was detected as a downshift of the CO stretching vibration of Asn74 in pHtrII. ?,? Similar spectral changes, probably due to the hydrogen bonding change of Asn74 in pHtrII, were observed in both fusion proteins pSRII-pHtrII(1-83) and pSRII-pHtrII(1-159) independent of surface densities (Figures and ?). Previous FTIR spectroscopy detected suppression of the spectral change in the amide I region (1663/1644 cm^–1^), ?,? which is probably a signature of the PPI that the tilt of the F helix of pSRII is transferred to the rotation of TM2 in pHtrII. ?,?,? Spectral attenuation was hampered at low temperature (250 K) and in the complex with pHtrII G83C and G83F mutants,? reducing the flexibility of the HAMP1 region. Furthermore, signal transduction in bacterial cells was not observed in the G83C and G83F mutations in pHtrII.? Therefore, it was concluded that the HAMP1 domain involves the PPIs related to the tilt of the F-helix in pSRII and the rotation of TM2 in pHtrII.?
In this study, the light-induced difference SEIRAS was applied not only to the pSRII-pHtrII(1-159) fusion protein, which is basically similar to the previous FTIR experiment, ?,? but also to the pSRII-pHtrII(1-83), which is a pHtrII truncated before the HAMP1 domain. Unexpectedly, a reduction in the spectral change in the amide I region also occurred in the pSRII-pHtrII(1-83) fusion protein. This experimental result strongly suggests that the HAMP1 domain is not important for the PPI regarding the F-helix tilting of pSRII and the rotation of TM2 in pHtrII. The membrane-embedded region probably plays crucial roles in the PPIs, and the HAMP1 domain plays a minor role (Figurec). Our result does not deny that the HAMP1 domain is important in transducing the rotation of TM2 to the intracellular domain of pHtrII. The previous FTIR experiments ?,? may be interpreted that the low temperature and the G83C and G83F mutations in pHtrII inhibited clustering of the pSRII/pHtrII complex to form higher-order structures such as trimer of dimers and/or the conformation change of the pSRII/pHtrII complex from V-shaped to U-shaped form, resulting in suppression of the PPI regarding the F-helix tilting of pSRII and rotation of TM2 in pHtrII. The latter possibility was supported by X-ray crystallography on pSRII-pHtrII(1-135: G83F), which exhibited the V-shaped form in the ground state.? Molecular dynamics simulations reported that the U-shaped form in the ground state (closed state) and its conversion to the V-shaped form (open state) upon the formation of the M intermediate represent a key conformational change of the pSRII/pHtrII complex.? In other words, the V-shaped forms in the ground state of pSRII-pHtrII(1-135: G83F) and our pSRII-pHtrII constructs (1-83 and 1-159) under dispersed conditions do not efficiently transmit the light-induced conformational changes to the pHtrII regions.
The changes observed in the amide I region for the pSRII-pHtrII fusion proteinsshowing surface-density dependent attenuation of amide I bands characteristic of α-helices, are, to our knowledge, the first such features reported in SEIRA measurements. We speculate that this phenomenon may be explained by the specific orientation imposed in SEIRAS, where the fusion proteins are aligned through Ni-NTA binding with the extracellular side facing the surface. This orientation is different from that in liposome-based conditions, and such differences may account for the spectral behavior observed here.
Conclusions
5
Protein–protein interactions between pSRII and pHtrII were analyzed by SEIRAS for the first time. The light-induced spectral changes of the pSRII-pHtrII fusion proteins were highly dependent on their surface density, suggesting that a substantial quaternary structural reorganizationsuch as the formation of a trimer of dimers, may occur as molecular crowding increases. Furthermore, after normalizing the reduction in spectral intensity caused by dilution with the β-sheet–rich protein acting as a molecular crowder, the light-induced spectral changes of the pSRII-pHtrII fusion proteins in the amide I region were attenuated under the condensed conditions, regardless of the presence or absence of the HAMP1 domain. These results suggest that suppression of the F-helix tilt in pSRII does not require an interaction with the HAMP1 domain. This study provides a new aspect of the molecular mechanism of signal transfer from pSRII to pHtrII on the basis of the results obtained by SEIRAS applied to the pSRII and pHtrII fusion proteins under physiological orientation in the membrane.
Supplementary Material
The reference list from the paper itself. Each links out to its DOI / PubMed record.
- 1Shichida Y.Matsuyama T.Evolution of opsins and phototransduction Philos. Trans. R Soc. London B Biol. Sci.200936415312881289510.1098/rstb.2009.005119720651 PMC 2781858 · doi ↗ · pubmed ↗
- 2Ernst O. P.Lodowski D. T.Elstner M.Hegemann P.Brown L. S.Kandori H.Microbial and animal rhodopsins: Structures, functions, and molecular mechanisms Chem. Rev.2014114112616310.1021/cr 400376924364740 PMC 3979449 · doi ↗ · pubmed ↗
- 3Spudich J. L.Jung K.-H.Handbook of photosensory receptors 200512310.1002/352760510 X.ch 1 · doi ↗
- 4Klare, J. P. ; Chizhov, I. ; Engelhard, M. In Bioenergetics: Energy conservation and conversion; Schäfer, G. , Penefsky, H. S. , Eds.; Springer Berlin Heidelberg: 2008; pp 73–122.
- 5Spudich J. L.Sineshchekov O. A.Govorunova E. G.Mechanism divergence in microbial rhodopsins Biochim. Biophys. Acta 20141837554655210.1016/j.bbabio.2013.06.00623831552 PMC 3844102 · doi ↗ · pubmed ↗
- 6Hazelbauer G. L.Falke J. J.Parkinson J. S.Bacterial chemoreceptors: High-performance signaling in networked arrays Trends Biochem. Sci.200833191910.1016/j.tibs.2007.09.01418165013 PMC 2890293 · doi ↗ · pubmed ↗
- 7Hoff W. D.Jung K. H.Spudich J. L.Molecular mechanism of photosignaling by archaeal sensory rhodopsins Annu. Rev. Biophys. Biomol. Struct.19972622325810.1146/annurev.biophys.26.1.2239241419 · doi ↗ · pubmed ↗
- 8Sasaki J.Spudich J. L.The transducer protein htrii modulates the lifetimes of sensory rhodopsin ii photointermediates Biophys. J.19987552435244010.1016/S 0006-3495(98)77687-89788938 PMC 1299917 · doi ↗ · pubmed ↗