Association between serum phosphate levels within the normal range and all-cause mortality among US adults
Mayuko Yamamoto, Sho Katsuragawa, Yuichi Takashi, Dai Nagata, Kyoko Toyokawa, Kosuke Inoue, Daiji Kawanami

TL;DR
This study found that higher-normal phosphate levels are linked to increased mortality in people with chronic kidney disease but not in the general population.
Contribution
The study reveals that phosphate levels within the normal range may still impact mortality risk in individuals with CKD.
Findings
Higher-normal phosphate levels were not associated with increased mortality in the general population.
In individuals with CKD, higher-normal phosphate levels were linked to a 13% increased mortality risk.
No association was found between higher-normal phosphate and mortality in those without CKD.
Abstract
Hyperphosphatemia is associated with increased mortality in chronic kidney disease (CKD), but the clinical relevance of variation within the normal serum phosphate range remains unclear. This study evaluated the association between higher-normal serum phosphate levels within the normal range and all-cause mortality among US adults. We conducted a cohort study using data from 15 848 individuals aged ≥20 years with serum phosphate levels between 2.5 and 4.5 mg/dL from the Third National Health and Nutrition Examination Survey (1988-1994) linked to mortality data ascertained by the National Center for Health Statistics with the National Death Index through December 2019. Baseline serum phosphate was the exposure. Participants were categorized into lower-normal (2.5 mg/dL to <3.5 mg/dL; n = 7691) and higher-normal (3.5 mg/dL to ≤4.5 mg/dL; n = 8157) serum phosphate groups. Cox proportional…
Genes, proteins, chemicals, diseases, species, mutations and cell lines named across the full text — each resolved to its canonical identifier and authoritative record.
Click any figure to enlarge with its caption.
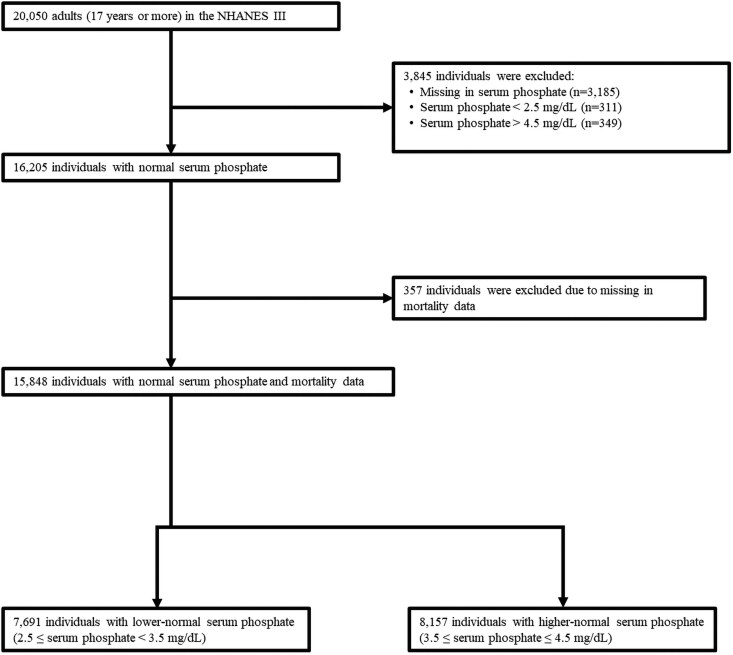 Figure 1
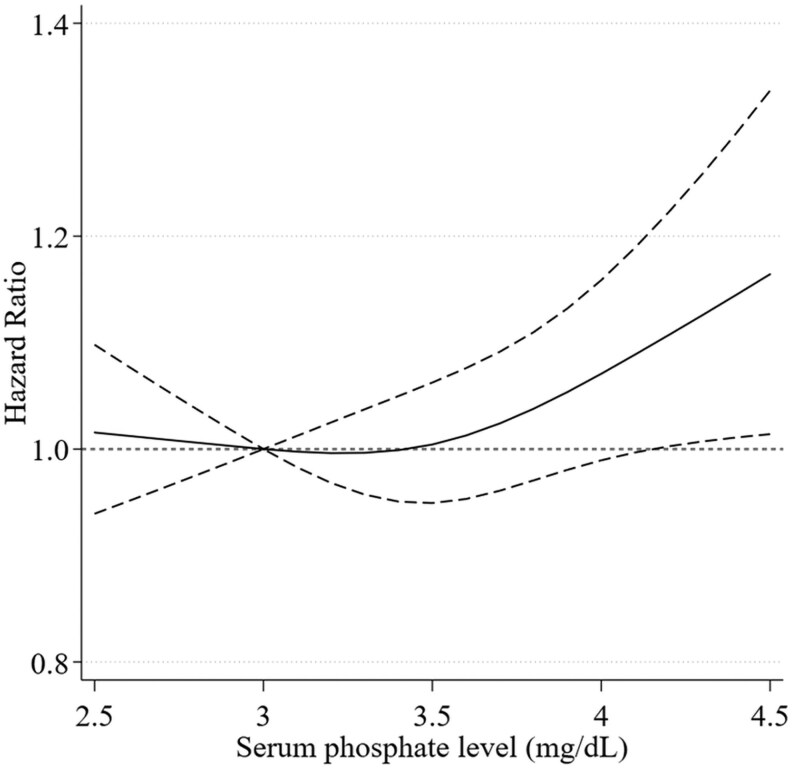 Figure 2
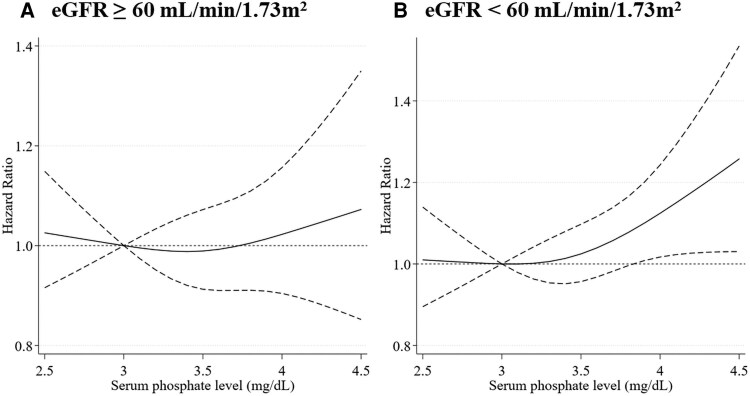 Figure 3
| Total | Serum phosphate levels (mg/dL) | ||
|---|---|---|---|
| Lower-normal (≤2.5, <3.5) | Higher-normal (≤3.5, ≤4.5) | ||
| n = 15 848 | n = 7691 | n = 8157 | |
| Serum phosphate, mg/dL | 3.5 (0.4) | 3.1 (0.2) | 3.8 (0.3) |
| Age, years | 47.4 (20.0) | 49.6 (19.8) | 45.3 (20.1) |
| 17-20 | 922 (5.8%) | 265 (3.4%) | 657 (8.1%) |
| 21-40 | 6164 (38.9%) | 2830 (36.8%) | 3334 (40.9%) |
| 41-60 | 3949 (24.9%) | 1997 (26.0%) | 1952 (23.9%) |
| 61-80 | 3747 (23.6%) | 2012 (26.2%) | 1735 (21.3%) |
| ≥81 | 1066 (6.7%) | 587 (7.6%) | 479 (5.9%) |
| Sex | |||
| Male | 7386 (46.6%) | 4059 (52.8%) | 3327 (40.8%) |
| Female | 8462 (53.4%) | 3632 (47.2%) | 4830 (59.2%) |
| Ethnicity | |||
| Non-Hispanic White | 6623 (41.8%) | 3407 (44.3%) | 3216 (39.4%) |
| Non-Hispanic Black | 4237 (26.7%) | 2001 (26.0%) | 2236 (27.4%) |
| Mexican American | 4361 (27.5%) | 1992 (25.9%) | 2369 (29.0%) |
| Others | 627 (4.0%) | 291 (3.8%) | 336 (4.1%). |
| Education | |||
| Less than high school | 3740 (23.8%) | 1877 (24.6%) | 1863 (23.0%) |
| High school | 7604 (48.3%) | 3613 (47.3%) | 3991 (49.2%) |
| Higher than high school | 4398 (27.9%) | 2144 (28.1%) | 2254 (27.8%) |
| Missing | 106 (0.7%) | 57 (0.7%) | 49 (0.6%) |
| Smoking | |||
| Never | 8026 (50.6%) | 3772 (49.0%) | 4254 (52.2%) |
| Former | 3822 (24.1%) | 2075 (27.0%) | 1747 (21.4%). |
| Current | 3999 (25.2%) | 1844 (24.0%) | 2155 (26.4%). |
| Missing | 1 (0.0%) | 0 (0.0%) | 1 (0.0%) |
| Total | Serum phosphate levels (mg/dL) | ||
|---|---|---|---|
| Lower-normal (≤2.5, <3.5) | Higher-normal (≤3.5, ≤4.5) | ||
| n = 15 848 | n = 7691 | n = 8157 | |
| Diabetes mellitus | 1246 (7.9%) | 623 (8.1%) | 623 (7.6%) |
| Missing | 18 (0.1%) | 9 (0.1%) | 9 (0.1%) |
| Hypertension | 4204 (26.8%) | 2206 (28.9%) | 1998 (24.7%) |
| Missing | 145 (0.9%) | 65 (0.8%) | 80 (1.0%) |
| Dyslipidemia | 2691 (33.8%) | 1309 (33.0%) | 1382 (34.6%) |
| Missing | 7884 (49.7%) | 3721 (48.4%) | 4163 (51.0%) |
| Cardiovascular disease | 1302 (8.3%) | 685 (9.0%) | 617 (7.7%) |
| Missing | 209 (1.3%) | 94 (1.2%) | 115 (1.4%) |
| Cancer | 1175 (7.4%) | 619 (8.0%) | 556 (6.8%) |
| Missing | 3 (0.0%) | 1 (0.0%) | 2 (0.0%) |
| Body mass index, kg/m2 | 27.0 (5.8) | 27.2 (5.7) | 26.7 (5.8) |
| <18.5 | 364 (2.3%) | 147 (1.9%) | 217 (2.7%) |
| ≤18.5, < 25 | 6077 (38.4%) | 2775 (36.2%) | 3302 (40.6%) |
| ≤25, < 30 | 5453 (34.5%) | 2788 (36.3%) | 2665 (32.8%) |
| ≤30 | 3916 (24.8%) | 1966 (25.6%) | 1950 (24.0%) |
| Missing | 38 (0.2%) | 15 (0.2%) | 23 (0.3%) |
| Systolic blood pressure, mm Hg | 125.3 (19.8) | 127.0 (19.8) | 123.6 (19.8) |
| Missing | 336 (2.1%) | 161 (2.1%) | 175 (2.1%) |
| Diastolic blood pressure, mm Hg | 73.9 (10.7) | 74.9 (10.7) | 73.0 (10.6) |
| Missing | 344 (2.2%) | 162 (2.1%) | 182 (2.2%) |
| Estimated glomerular filtration rate, mL/min/1.73 m2 | 77.6 (20.9) | 76.1 (20.0) | 79.0 (21.5) |
| ≤60 | 12 626 (79.7%) | 6049 (78.7%) | 6577 (80.6%) |
| ≤30, < 60 | 3081 (19.4%) | 1588 (20.6%) | 1493 (18.3%) |
| <30 | 141 (0.9%) | 54 (0.7%) | 87 (1.1%) |
| Adjusted serum calcium, mg/dL | 9.4 (0.4) | 9.3 (0.4) | 9.4 (0.4) |
| Follow-up duration, years | 26.3 [15.5-28.5] | 26.1 [13.7-28.3] | 26.5 [17.5-28.7] |
| Serum phosphate level (mg/dL) | ||
|---|---|---|
| Lower-normal (≤2.5, <3.5) | Higher-normal (≤3.5, ≤4.5) | |
|
| ||
|
| ||
| Number analyzed | 7691 | 8157 |
| Number of events | 3493 | 3167 |
| Hazard ratio (95% CI) | Reference | 0.91 (0.85-0.97) |
|
| ||
| Number analyzed | 7691 | 8157 |
| Number of events | 3493 | 3167 |
| Hazard ratio (95% CI) | Reference | 1.10 (1.02-1.18) |
|
| ||
| Number analyzed | 7634 | 8107 |
| Number of events | 3464 | 3143 |
| Hazard ratio (95% CI) | Reference | 1.08 (1.00-1.15) |
|
| ||
| Number analyzed | 7519 | 7963 |
| Number of events | 3411 | 3094 |
| Hazard ratio (95% CI) | Reference | 1.06 (0.98-1.13) |
|
| ||
|
| ||
| Number analyzed | 7691 | 8157 |
| Number of events | 1318 | 1189 |
| Hazard ratio (95% CI) | Reference | 0.91 (0.81-1.03) |
|
| ||
| Number analyzed | 7691 | 8157 |
| Number of events | 1318 | 1189 |
| Hazard ratio (95% CI) | Reference | 1.11 (0.98-1.27) |
|
| ||
| Number analyzed | 7634 | 8107 |
| Number of events | 1307 | 1180 |
| Hazard ratio (95% CI) | Reference | 1.10 (0.97-1.25) |
|
| ||
| Number analyzed | 7519 | 7963 |
| Number of events | 1289 | 1163 |
| Hazard ratio (95% CI) | Reference | 1.08 (0.95-1.22) |
| Total | Estimated glomerular filtration rate (mL/min/1.73 m2 | |||
|---|---|---|---|---|
| ≥60 | ≤30, <60 | <30 | ||
| n = 15 482 | n = 12 327 | n = 3018 | n = 137 | |
| Serum phosphate, mg/dL | 3.5 (0.4) | 3.5 (0.4) | 3.4 (0.4) | 3.6 (0.5) |
| Serum phosphate category | ||||
| 2.5-2.9 mg/dL | 2115 (13.7%) | 1642 (13.3%) | 462 (15.3%) | 11 (8.0%) |
| 3.0-4.0 mg/dL | 11 758 (75.9%) | 9393 (76.2%) | 2266 (75.1%) | 99 (72.3%) |
| 4.1-4.5 mg/dL | 1609 (10.4%) | 1292 (10.5%) | 290 (9.6%) | 27 (19.7%) |
| Estimated glomerular filtration rate, mL/min/1.73 m2 | 77.5 (20.8) | 84.9 (15.8) | 49.6 (7.7) | 23.7 (5.8) |
| Age, years | 47.4(20.0) | 41.1 (16.5) | 71.8 (11.7) | 77.2 (10.3) |
| Sex | ||||
| Male | 7220 (46.6%) | 5926 (48.1%) | 1234 (40.9%) | 60 (43.8%) |
| Female | 8262 (53.4%) | 6401 (51.9%) | 1784 (59.1%) | 77 (56.2%) |
| Cardiovascular disease | 1274 (8.2%) | 574 (4.7%) | 651 (21.6%) | 49 (35.8%) |
| Diabetes mellitus | 1214 (7.8%) | 742 (6.0%) | 430 (14.2%) | 42 (30.7%) |
| Serum phosphate levels (mg/dL) | |||
|---|---|---|---|
| Lower-normal (≤2.5, <3.5) | High-normal (≤3.5, ≤4.5) |
| |
|
| |||
| | |||
| Number analyzed | 5919 | 6408 | 0.139 |
| Number of events | 1995 | 1737 | |
| Hazard ratio (95% CI) | Reference | 1.01 (0.92-1.12) | |
| | |||
| Number analyzed | 1600 | 1555 | - |
| Number of events | 1416 | 1357 | |
| Hazard ratio (95% CI) | Reference | 1.13 (1.02-1.25) | |
- —KAKENHI10.13039/501100001691
- —Japan Endocrine Society10.13039/100032369
- —Okinaka Memorial Institute for Medical Research10.13039/100012832
- —Takeda Science Foundation10.13039/100007449
- —Suzuken Memorial Foundation10.13039/100007434
Peer Reviews
No public reviews on file for this paper yet. If you reviewed it on a platform where reviews are public (OpenReview, ICLR, NeurIPS, ICML), you can paste yours below so the community can read it here.
Videos
No videos yet. Explain this paper in a talk, walkthrough, or lecture? Add one.
Taxonomy
TopicsParathyroid Disorders and Treatments · Magnesium in Health and Disease · Dialysis and Renal Disease Management
Phosphate is an essential nutrient for the human body, with approximately 85% stored in the skeleton in the form of hydroxyapatite [1]. The remaining phosphate is distributed intracellularly (14%) and within the extracellular fluid (<1%). Phosphate plays diverse physiological roles. Intracellular phosphate is vital for biological processes, such as signal transduction, membrane synthesis, pH regulation, and energy metabolism, particularly through the synthesis of adenosine triphosphate [2]. Because extracellular phosphate is crucial for bone matrix mineralization, hypophosphatemia causes rickets/osteomalacia characterized by aberrant bone mineralization, whereas hyperphosphatemia induces ectopic calcification or ossification [3]. Therefore, serum phosphate levels are tightly regulated within a narrow range, typically between 2.5 and 4.5 mg/dL in adults [2].
Previous studies have consistently demonstrated that hyperphosphatemia is associated with increased risks of carotid atherosclerosis, coronary calcification, cardiovascular disease (CVD), and mortality, particularly in patients with chronic kidney disease (CKD) [4-11]. In addition, several studies have reported that higher serum phosphate levels are associated with an increased risk of CVD [12-14] and end-stage renal disease [15] in individuals without CKD. Accordingly, current nephrology guidelines recommend targets and treatment strategies aimed at correcting serum phosphate levels toward the normal range [16]. Although the systematic review included some analyses of serum phosphate levels within the normal range, most of the evidence was derived from examining phosphate levels outside the normal range—namely hypophosphatemia and hyperphosphatemia—and their associations with cardiovascular mortality and coronary artery disease [11]. Despite these insights, it remains unclear whether higher serum phosphate levels within the normal range are associated with long-term mortality risks.
To address this knowledge gap, using the nationally representative data in the United States with a 30-year follow-up, we investigated the association between higher-normal serum phosphate levels within the normal range and all-cause mortality. Given the previous evidence, we also assessed the relationship among adults with and without CKD.
Materials and methods
Data source and study population
We conducted a population-based cohort study using the Third National Health and Nutrition Examination Survey (NHANES III) and its linked national mortality data through December 2019. NHANES III was a nationwide survey to assess the health and nutritional status of the US population conducted from 1988 to 1994 [17]. It employed a stratified, multistage probability sampling design [18]. Data of structured interviews, physical examinations, and laboratory tests were available in NHANES III. From the data of 20 050 adults in NHANES III, we included 16 205 individuals whose serum phosphate levels were within the normal range (2.5-4.5 mg/dL) [19]. After excluding 357 individuals with missing mortality data, a total of 15 848 individuals were analyzed (Fig. 1).
Flow of sample selection. A total of 20 050 adults participated in the Third National Health and Nutrition Examination Survey (NHANES III) from 1988 to 1994. Of these, 16 205 individuals with serum phosphate levels within the normal range (2.5-4.5 mg/dL) were included. After excluding 357 individuals with missing mortality data, 15 848 individuals were included in the final analysis. Mortality data were linked through December 2019.
Exposure variable: serum phosphate level within a normal range
Our primary exposure was serum phosphate levels at the survey. In NHANES III, serum phosphate levels were measured with a Hitachi Model 737 multichannel analyzer (Boehringer Mannheim Diagnostics, Indianapolis, USA) [20]. We categorized 15 848 participants into 2 groups according to their serum phosphate levels using a median value of 3.5 mg/dL as the cutoff: lower-normal serum phosphate group (serum phosphate level: 2.5-<3.5 mg/dL; n = 7691) and higher-normal serum phosphate group (serum phosphate level: 3.5-≤4.5 mg/dL; n = 8157) (Fig. 1).
Outcome variables
Our primary outcome was all-cause mortality, and the secondary outcome was cardiovascular mortality. These outcomes were ascertained by the National Center for Health Statistics with the National Death Index, with record matching by social security number, name, date of birth, race-ethnicity, sex, and state of residence. Cardiovascular mortality was defined as death from heart diseases and stroke using the International Classification of Diseases, 10th revision: acute rheumatic fever and chronic rheumatic heart diseases (I00-I09), hypertensive heart disease (I11), hypertensive heart and renal disease (I13), ischemic heart diseases (I20-I25), other heart diseases (I26-I51), and cerebrovascular diseases (I60-I69). Time to events was calculated from the date of serum phosphate measurement to the death date or the end of follow-up (ie, December 2019), whichever occurred earlier.
Covariates
Sociodemographic characteristics including age (years), sex (male, female), race/ethnicity (non-Hispanic White, non-Hispanic Black, Mexican American, others), educational status (lower than high school, high school, higher than high school), and smoking status (never, former, current) were self-reported. Histories of diabetes, CVD (heart failure, heart attack, stroke), and cancer were also ascertained based on self-report. Anthropometric data and laboratory test data were measured based on the NHANES III manuals [20]. Body mass index (BMI) was calculated as weight in kilograms divided by height in meters squared. Estimated glomerular filtration rate (eGFR) was calculated using the Chronic Kidney Disease Epidemiology Collaboration equation: eGFR = 141 × min [serum creatinine/k, 1] × max [serum creatinine/k, 1] − 1.209 × 0.993 age × 1.018 [if female] × 1.159 [if Black]; k = 0.9 for male and 0.7 for female, a = −0.411 for male and −0.329 for female, and min indicates the minimum of serum creatinine/k or 1 and max indicates the maximum of serum creatinine/k or 1 [21]. Serum calcium level was adjusted when serum albumin level was less than 4.0 g/dL using a formula as follows: adjusted serum calcium (mg/dL) = calcium (mg/dL) – albumin (g/dL) + 4.0 [22].
Statistical analyses
Continuous variables were presented as mean or median and categorical variables were presented as proportion according to serum phosphate levels. We applied multivariable Cox proportional hazard models adjusting for potential confounders to estimate adjusted hazard ratios (aHR) for all-cause and cardiovascular mortality for serum phosphate levels (higher-normal serum phosphate group vs lower-normal serum phosphate group [reference]). In model 1, age (continuous), age-squared (continuous), sex, race/ethnicity, educational status, smoking status, history of diabetes, history of cardiovascular disease, and history of cancer were included. Model 2 further included BMI (continuous), BMI-squared (continuous), eGFR (≥60, 30-60, <30 mL/min/1.73 m^2^), and adjusted serum calcium (continuous) in addition to the covariates in model 1. In each of model 1 and model 2, we excluded participants with missing data in the covariates: educational status (n = 106), smoking status (n = 1), history of diabetes (n = 17), history of cardiovascular disease (n = 204), history of cancer (n = 3), and BMI (n = 35). We then fitted restricted cubic spline models for Cox proportional hazard models with 3 knots at the 10th, 50th, and 90th percentiles of serum phosphate levels to investigate the association of continuous serum phosphate levels with all-cause mortality. Last, to assess the association of serum phosphate levels with mortality by CKD status, we incorporated an interaction term of serum phosphate levels and eGFR (≥60, <60 mL/min/1.73 m^2^) in our Cox proportional hazard models (model 2).
In all analyses, we applied the NHANES sampling weights to account for the differential probability of selecting the participants and the nonresponse of those eligible and approached [23]. All statistical analyses were performed using R software version 4.3.2. and Stata software version 15.
Results
Participants’ characteristics
Of a total of 15 848 participants, 7386 (46.6%) were male, and the mean age was 47.4 years (Table 1). Mean age was 49.6 years in the lower-normal group and 45.3 years in the higher-normal group. In the lower-normal serum phosphate group, 47.2% were female and 44.3% were of non-Hispanic White ethnicity, whereas the corresponding proportion in the higher-normal group were 59.2% and 39.4%, respectively. Histories of diabetes (8.1% vs 7.6%), hypertension (8.9% vs 24.7%), dyslipidemia (33.0% vs 34.6%), cardiovascular disease (9.0% vs 7.7%), and cancer (8.0% vs 6.8%) were also reported (Table 2). The mean BMI was 27.2 kg/m^2^ in the lower-normal group and 26.7 kg/m^2^ in the higher-normal group, and mean eGFR was 76.1 mL/min/1.73m^2^ and 79.0 mL/min/1.73m^2^, respectively.
Serum phosphate levels within the normal range and mortality
Over the median follow-up duration of 26.3 years, a total of 6660 (42.0%) all-cause mortality and 2507 (15.8%) cardiovascular mortality were ascertained. After adjusting for age and sex, the higher serum phosphate level within the normal range was associated with all-cause mortality (aHR 1.10 [95% CI, 1.02-1.18], Table 3). However, the association disappeared after adjusting for the potential confounders in model 1 (aHR 1.08 [95% CI, 1.00-1.15]) and model 2 (aHR 1.06 [95% CI, 0.98-1.13], Table 3). The serum phosphate levels within the normal range were not associated with cardiovascular mortality (Table 3). The restricted cubic spline of the overall population showed a trend of increased mortality with higher serum phosphate levels within the normal range, particularly for levels above 3.5 mg/dL (Fig. 2).
Association of serum phosphate level and all-cause mortality in the overall population using a restricted cubic spline model. The model adjusted for age, age-squared, sex, race/ethnicity, educational status, smoking status, history of diabetes, history of cardiovascular diseases, history of cancer, body mass index, body mass index-squared, estimated glomerular filtration rate, and adjusted serum calcium. The restricted cubic spline was modeled with 3 knots at the 10th, 50th, and 90th percentiles of serum phosphate level. The dash lines represent the 95% CIs for the spline model (reference is 3.0 mg/dL).
Subgroup analysis by CKD
We also conducted a subgroup analysis stratifying participants by eGFR. Clinical characteristics according to eGFR level (eGFR <30 mL/min/1.73 m^2^, 30 ≤ eGFR <60 mL/min/1.73 m^2^, eGFR ≥60 mL/min/1.73 m^2^) were presented in Table 4. Individuals with eGFR of <30 mL/min/1.73 m^2^ had a higher proportion of having a high phosphate level (4.1-4.5 mg/dL), history of diabetes, and history of CVD than those with eGFR of ≥60 mL/min/1.73 m^2^ or eGFR of ≥30 mL/min/1.73 m^2^ and <60 mL/min/1.73 m^2^. A total of 3732 (30.3%) deaths from all causes was observed among 12 327 participants with an eGFR of 60 mL/min/1.73 m^2^ or more, and 2773 (87.9%) deaths from all causes were observed among 3155 participants with eGFR < 60 mL/min/1.73 m^2^. The higher serum phosphate level within the normal range was associated with all-cause mortality in the subgroup with eGFR <60 mL/min/1.73 m² (aHR 1.13; 95% CI, 1.02-1.25), indicating a 13% higher risk of death after adjustment for confounders (eg, age, age-squared, sex, race/ethnicity, educational status, smoking status, history of diabetes, history of cardiovascular diseases, history of cancer, body mass index, body mass index-squared, adjusted serum calcium, serum phosphate, eGFR, and the interaction term between serum phosphate level and eGFR) despite null association in the subgroup with eGFR of 60 mL/min/1.73 m^2^ or more (aHR 1.01 [95% CI, 0.92-1.12]; P for interaction, .14; Table 5). In the restricted cubic splines for each subgroup, the association of higher serum phosphate levels within the normal range with all-cause mortality was prominent in the subgroup with eGFR < 60 mL/min/1.73 m^2^ (Fig. 3).
Association of serum phosphate level and all-cause mortality in subgroups stratified by participants’ renal function using a restricted cubic spline model. (A) Participants with eGFR ≥60 mL/min/1.73 m2. (B) Participants with eGFR <60 mL/min/1.73 m2. The model adjusted for age, age-squared, sex, race/ethnicity, educational status, smoking status, history of diabetes, history of cardiovascular diseases, history of cancer, body mass index, body mass index-squared, estimated glomerular filtration rate, and adjusted serum calcium. The restricted cubic spline was modeled with 3 knots at the 10th, 50th, and 90th percentiles of serum phosphate level. The dash lines represent the 95% CIs for the spline model (reference is 3.0 mg/dL).
Discussion
In this cohort study of US nationally representative adults, higher-normal serum phosphate levels within the normal range were associated with increased risk of all-cause mortality among adults with CKD. We found no association among those without CKD. This pattern was also observed in the restricted cubic spline model, suggesting the important role of serum phosphate levels even within the normal range on long-term health among individuals with CKD.
To our knowledge, this is the first study to investigate the association between serum phosphate levels within the normal range and risk of mortality. It has been well established that hyperphosphatemia is associated with increased risk of mortality, especially in patients with CKD [4-11, 24]. A meta-analysis including 47 cohort studies of patients with CKD demonstrated that the risk of death increased 18% for every 1 mg/dL increase in serum phosphate level, whereas there was no significant association between all-cause mortality and serum calcium or PTH [9]. In addition, there is observational evidence that higher serum phosphate levels are associated with increased risk of death, even in individuals with normal kidney function [12-15]. In the present study, the trend was also found in serum phosphate level within the normal range, and the association was even more clearly shown in patients with CKD.
There are several potential mechanisms that would explain the association of higher-normal serum phosphate levels within the normal range with greater risk of mortality. Phosphate is a relatively abundant mineral found in almost all places in the human body. Although it has important physiological roles in maintaining musculoskeletal functions, it can also become pathogenic in extraskeletal system as the term “phosphate toxicity” implies. Phosphate activates inflammatory signaling pathways, particularly through nuclear factor kappa B (NF-kB) [25]. These signals are linked to oxidative stress, which activates a DNA damage response, and can further induce inflammation and promote cell senescence [26-29]. As a result, phosphate induces various pathologies including not only vascular calcification but also increased tumorigenesis, increased cell death, impaired cell signaling, and premature aging [30-33].
Serum phosphate levels are modifiable; however, the factors that determine individual serum phosphate levels are not fully understood. Although definitive evidence is lacking, genetic influences may contribute to individual variations in serum phosphate levels. Daily dietary habits are also likely to play an important role [34]. Similar to the use of phosphate-restricted diets for hyperphosphatemia in patients with kidney dysfunction, serum phosphate levels can be modified by reviewing and adjusting dietary phosphorus intake. Because large amounts of phosphate are contained in processed foods and food additives, public health measures to raise awareness of excessive phosphate consumption are of considerable importance.
Current nephrology guidelines, including those from Kidney Disease Improving Global Outcomes, make weak recommendations for correcting serum phosphate levels toward the normal range in patients with CKD, based on evidence suggesting the association between hyperphosphatemia and increased risk of CVD and mortality [16]. Importantly, the guideline does not address the prognostic significance of serum phosphate levels within the normal range, particularly among individuals with impaired kidney function.
However, no recommendations specify how much to lower serum phosphate levels within the normal range because no studies have explored the relationship between serum phosphate levels within the normal range and various clinical outcomes among patients with CKD [24]. Our study specifically demonstrated that, among participants with reduced renal function, those with higher serum phosphate levels within the normal range had an increased risk of mortality. This finding suggests that even modest elevations in serum phosphate—below the threshold of overt hyperphosphatemia—may have clinical relevance in this population, an aspect not covered by existing guidelines. In this context, our results provide important evidence supporting the consideration of maintaining serum phosphate at the lower end of the normal range for individuals with impaired kidney function.
Strengths and limitations
The strengths of our study include that we used a nationwide representative sample in the United States, allowing for generalizing the findings to the entire US population. The data from the NHANES III were also linked to the national mortality data with long-term follow-up (ie, median follow-up >25 years), resulting in a sufficient number of outcome events to provide precise estimates.
However, several limitations need to be considered. First, the exposure variable (ie, serum phosphate level) was measured only 1 time point at the survey, and the exact time of blood collection was not available. Although several epidemiologic studies have used a single measurement of serum phosphate evaluate to long-term outcomes [11], we could not account for diurnal variation in serum phosphorus levels, which may have introduced nondifferential measurement error.
Second, the information of the covariates included in our statistical models was measured at the same time point as the exposure variable, serum phosphate levels, in NHANES III, which leaves the temporal ordering of these variables unclear. This may have caused the risk of adjusting for mediators, not confounders, that could have biased the estimates. Third, the risk of confounding bias because of unmeasured confounders cannot be ruled out because of the observational nature of our study. Last, since the information of several covariates collected was self-reported, the risk of information bias due to misclassification remains.
Conclusions
Among US adults, higher serum phosphate levels within the normal range were associated with increased all-cause mortality only among patients with CKD. Given that randomized controlled trials have not shown the reduction in CVD or mortality from controlling serum phosphate levels using phosphate-binding agents among patients with CKD or hemodialysis [35], future research is needed to determine whether correcting higher-normal serum phosphate levels can reduce long-term adverse health outcome.
The reference list from the paper itself. Each links out to its DOI / PubMed record.
- 1Takashi Y, Fukumoto S. Phosphate-sensing. Adv Exp Med Biol. 2022;1362:27‐35.35288870 10.1007/978-3-030-91623-7_4 · doi ↗ · pubmed ↗
- 2Takashi Y . Phosphate-sensing mechanisms and functions of phosphate as a first messenger. Endocr J. 2024;71(4):335‐343.38556320 10.1507/endocrj.EJ 24-0082 · doi ↗ · pubmed ↗
- 3Kinoshita Y, Fukumoto S. X-linked hypophosphatemia and FGF 23-related hypophosphatemic diseases: prospect for new treatment. Endocr Rev. 2018;39(3):274‐291.29381780 10.1210/er.2017-00220 · doi ↗ · pubmed ↗
- 4Goodman WG, Goldin J, Kuizon BD, et al Coronary-artery calcification in young adults with end-stage renal disease who are undergoing dialysis. N Engl J Med. 2000;342(20):1478‐1483.10816185 10.1056/NEJM 200005183422003 · doi ↗ · pubmed ↗
- 5Oh J, Wunsch R, Turzer M, et al Advanced coronary and carotid arteriopathy in young adults with childhood-onset chronic renal failure. Circulation. 2002;106(1):100‐105.12093777 10.1161/01.cir.0000020222.63035.c 0 · doi ↗ · pubmed ↗
- 6Ishimura E, Taniwaki H, Tabata T, et al Cross-sectional association of serum phosphate with carotid intima-medial thickness in hemodialysis patients. Am J Kidney Dis. 2005;45(5):859‐865.15861351 10.1053/j.ajkd.2005.02.008 · doi ↗ · pubmed ↗
- 7Tuttle KR, Short RA. Longitudinal relationships among coronary artery calcification, serum phosphorus, and kidney function. Clin J Am Soc Nephrol. 2009;4(12):1968‐1973.19965546 10.2215/CJN.01250209 PMC 2798869 · doi ↗ · pubmed ↗
- 8Kestenbaum B, Sampson JN, Rudser KD, et al Serum phosphate levels and mortality risk among people with chronic kidney disease. J Am Soc Nephrol. 2005;16(2):520‐528.15615819 10.1681/ASN.2004070602 · doi ↗ · pubmed ↗