Evaluation of biochemical, histopathological, hematological, and genotoxic effects of some indigenous weed plant extracts in albino rats toward a natural and safe alternative to synthetic insecticides
Muhammad Asif Zahoor, Muhammad Kashif Zahoor, Hina Rizvi, Zeeshan Nawaz, Aftab Ahmed, Bushra Munir, Mudassir Hassan, Muhammad Zulhussnain

TL;DR
This study compares the toxicity of two weed plant extracts to a synthetic insecticide in rats, finding the plants to be safer and less harmful.
Contribution
The study provides new evidence that indigenous weed plant extracts are less toxic than synthetic insecticides in vertebrates.
Findings
Plant extracts showed no significant toxicity in liver, kidney, or blood parameters in rats.
Cypermethrin caused histopathological damage and genotoxic effects in rats.
Weed plant extracts are potential candidates for natural, safe biopesticides.
Abstract
The indiscriminate use of pesticides poses a significant risk to human health and the environment. Plant-based biopesticides offer an alternative to insecticides for integration into insect pest management programs. The current study assessed the toxicological effects of leaf extracts from indigenous weed plants, Chenopodium murale and Achyranthes aspera, in albino rats, Rattus norvegicus. The extract-mixed diet was fed in three different doses (100 ppm, 150 ppm, and 250 ppm) for 28 days, while the Cypermethrin insecticide was used as a reference insecticide at the same dose levels. Samples from liver and kidney tissues were collected for histopathological study, and the blood serum was obtained for biochemical assay. Histopathological analysis of cypermethrin revealed congestion in the central vein, hemorrhage in hepatic tissues, and necrosis of liver tissues, while kidney tissues…
Genes, proteins, chemicals, diseases, species, mutations and cell lines named across the full text — each resolved to its canonical identifier and authoritative record.
Click any figure to enlarge with its caption.
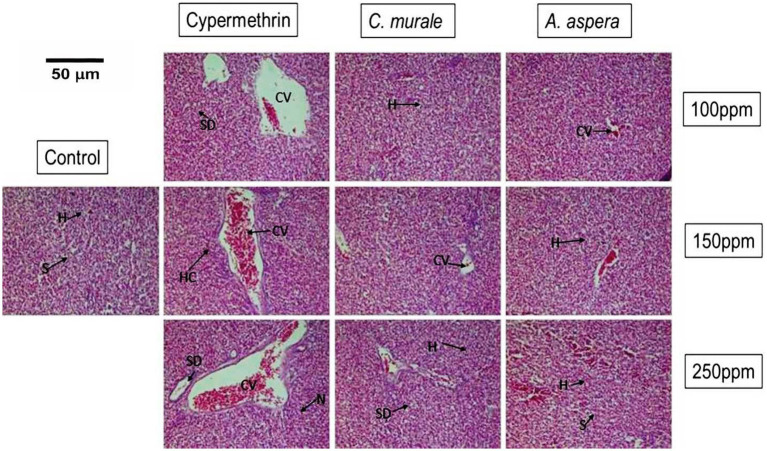 Figure 1
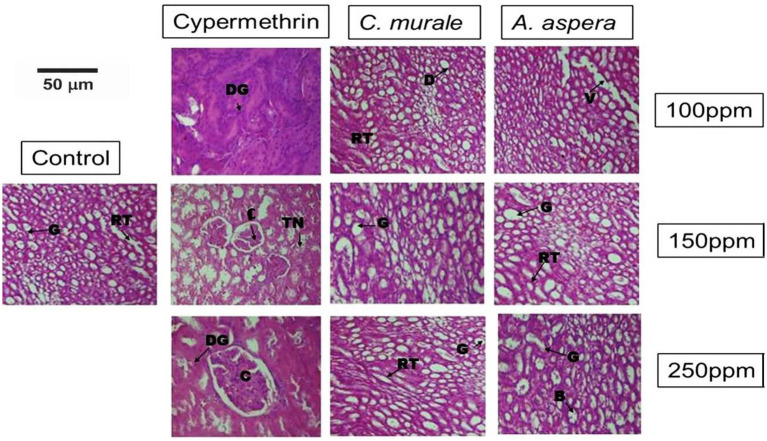 Figure 2
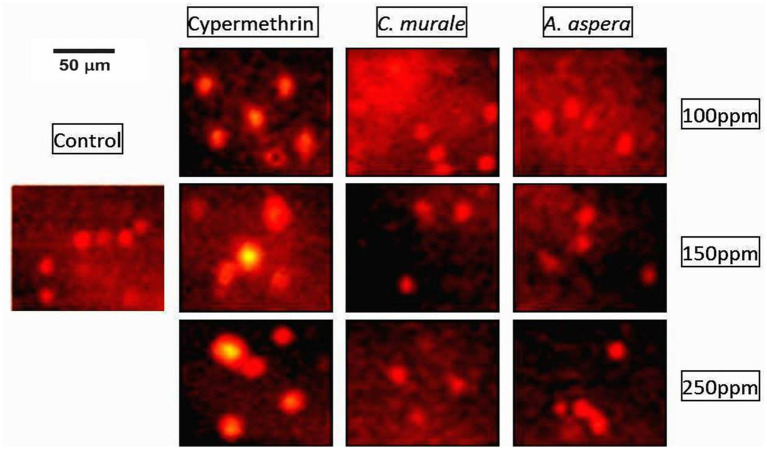 Figure 3
| Treatment | Days | AChE | AlkP | ||||||
|---|---|---|---|---|---|---|---|---|---|
| Conc./ppm | – | Control | 100 ppm | 150 ppm | 250 ppm | Control | 100 ppm | 150 ppm | 250 ppm |
| Cyper | 7 days | 0.278 ± 0.007a | 0.255 ± 0.002c | 0.243 ± 0.01b | 0.235 ± 0.001b | 253 ± 3.56a | 276 ± 4.32b | 280 ± 1.22c | 287 ± 0.68c |
| ( | ( | ||||||||
| 14 days | 0.278 ± 0.007a | 0.248 ± 0.003b | 0.240 ± 0.005b | 0.213 ± 0.002c | 253 ± 3.56a | 278 ± 3.12ab | 291 ± 2.16c | 301 ± 1.27c | |
| ( | ( | ||||||||
| 21 days | 0.278 ± 0.007a | 0.232 ± 0.005b | 0.228 ± 0.007b | 0.187 ± 0.003c | 253 ± 3.56a | 285 ± 6.31b | 298 ± 5.77b | 317 ± 2.30d | |
| ( | ( | ||||||||
| 28 days | 0.278 ± 0.007a | 0.217 ± 0.003b | 0.203 ± 0.002c | 0.172 ± 0.009d | 253 ± 3.56a | 291 ± 4.71b | 307 ± 2.63c | 321 ± 3.82d | |
| ( | ( | ||||||||
| P1 | 7 days | 0.278 ± 0.007a | 0.278 ± 0.003a | 0.278 ± 0.009a | 0.275 ± 0.005a | 253 ± 3.56a | 247 ± 6.17a | 253 ± 1.96a | 256 ± 4.03a |
| ( | ( | ||||||||
| 14 days | 0.278 ± 0.007a | 0.279 ± 0.004a | 0.276 ± 0.003a | 0.276 ± 0.002a | 253 ± 3.56a | 245 ± 5.77a | 251 ± 2.57a | 255 ± 2.88a | |
| ( | ( | ||||||||
| 21 days | 0.278 ± 0.007a | 0.280 ± 0.002a | 0.278 ± 0.005a | 0.277 ± 0.004a | 253 ± 3.56a | 250 ± 2.72a | 253 ± 0.57a | 254 ± 2.13a | |
| ( | ( | ||||||||
| 28 days | 0.278 ± 0.007a | 0.279 ± 0.06a | 0.275 ± 0.005a | 0.275 ± 0.002a | 253 ± 3.56d | 252 ± 3.46a | 254 ± 1.73a | 256 ± 2.88a | |
| ( | ( | ||||||||
| P2 | 7 days | 0.278 ± 0.007a | 0.276 ± 0.004a | 0.275 ± 0.002a | 0.275 ± 0.003a | 253 ± 3.56a | 249 ± 4.76a | 252 ± 2.28a | 255 ± 2.79a |
| ( | ( | ||||||||
| 14 days | 0.278 ± 0.007a | 0.278 ± 0.003a | 0.277 ± 0.005a | 0.274 ± 0.003a | 253 ± 3.56a | 253 ± 3.45a | 253 ± 4.84a | 258 ± 5.14a | |
| ( | ( | ||||||||
| 21 days | 0.278 ± 0.007a | 0.278 ± 0.003a | 0.276 ± 0.001a | 0.276 ± 0.007a | 253 ± 3.56a | 256 ± 3.72a | 256 ± 4.27a | 257 ± 4.65a | |
| ( | (F = 10.25; d.f. = 3; | ||||||||
| 28 days | 0.278 ± 0.007a | 0.276 ± 0.005a | 0.275 ± 0.007a | 0.273 ± 0.005a | 253 ± 3.56a | 258 ± 3.46a | 257 ± 4.96a | 258 ± 5.02 a | |
| ( | ( | ||||||||
| Sr. # | Parameter | Cypermethrin |
|
|
|---|---|---|---|---|
| 1 | Hepatocytes (H) |
|
|
|
| 2 | Central veins (CV) |
|
|
|
| 3 | Sinusoids (S) |
|
|
|
| 4 | Congestion |
|
|
|
| 5 | Cytoplasmic vacuolation (V) |
|
|
|
| 6 | Sinusoidal dilatation (SD) |
|
|
|
| 7th day of treatment | |||||||||||
|---|---|---|---|---|---|---|---|---|---|---|---|
| Parameters | Ref. value | Control group | Cypermethrin |
|
| ||||||
| 100 ppm | 150 Ppm | 250 ppm | 100 ppm | 150 ppm | 250 ppm | 100 Ppm | 150 ppm | 250 ppm | |||
| 0.2–1.2 | 0.34 ± 0.005a | 2.3 ± 0.01b | 2.4 ± 0.01b | 2.9 ± 0.02c | 0.36 ± 0.05a | 0.38 ± 0.03a | 0.40 ± 0.05a | 0.32 ± 0.01a | 0.38 ± 0.05a | 0.32 ± 0.03a | |
| S. G. O. T (u/L) | 10–35 | 15 ± 0.57a | 60 ± 1.05c | 62 ± 1.12c | 70 ± 1.03c | 18 ± 2.77a | 20 ± 5.04a | 20.5 ± 4.63a | 16 ± 1.89a | 18 ± 1.22a | 17 ± 0.63a |
| S. G. P. T (u/L) | 9–34 | 17 ± 0.57a | 50 ± 2.01b | 52 ± 1.67c | 55 ± 0.26c | 16.5 ± 2.57a | 19 ± 2.73a | 19 ± 1.92a | 18 ± 1.57a | 17 ± 1.05a | 20 ± 2.58 a |
| A. phosphatase (u/L) | 65–306 | 268 ± 2.76a | 350 ± 0.01b | 354 ± 0.01b | 359 ± 0.01bc | 268 ± 1.46a | 272 ± 3.02a | 273 ± 2.84a | 270 ± 0.59a | 272 ± 1.07a | 273 ± 1.99a |
| 14th day of treatment | |||||||||||
| S. bilirubin (mg/dL) | 0.2–1.2 | 0.40 ± 0.05a | 2.5 ± 0.01b | 2.6 ± 0.02bc | 2.96 ± 0.03c | 0.42 ± 0.01a | 0.45 ± 0.03a | 0.47 ± 0.05a | 0.42 ± 0.02a | 0.43 ± 0.01a | 0.45 ± 0.02a |
| S. G. O. T (u/L) | 10–35 | 30 ± 0.57a | 65 ± 0.63b | 66 ± 0.79b | 78 ± 0.47c | 29 ± 0.28a | 28 ± 0.57a | 30 ± 0.73a | 30 ± 0.53a | 31 ± 0.05a | 33 ± 1.47a |
| S. G. P. T (u/L) | 9–34 | 25 ± 0.57a | 54 ± 0.03b | 55 ± 0.72b | 59 ± 0.15bc | 23 ± 2.05a | 26 ± 1.07a | 27 ± 2.03a | 24 ± 1.15a | 26 ± 1.05a | 28 ± 2.79a |
| A.phosphatase (u/L) | 65–306 | 270 ± 3.21a | 353 ± 3.34b | 356 ± 2.78b | 364 ± 3.59c | 272 ± 1.58a | 272 ± 0.52a | 274 ± 1.33a | 271 ± 0.63a | 273 ± 1.67a | 275 ± 3.95a |
| 21st day of treatment | |||||||||||
| 0.2–1.2 | 0.50 ± 0.05a | 2.7 ± 0.05b | 2.8 ± 0.01b | 3.0 ± 0.03c | 0.48 ± 0.14a | 0.52 ± 0.01a | 0.53 ± 0.02a | 0.50 ± 0.01a | 0.51 ± 0.03a | 0.55 ± 0.04a | |
| S. G. O. T (u/L) | 10–35 | 30 ± 0.57a | 67 ± 0.01b | 78 ± 0.05c | 84 ± 0.01c | 30.5 ± 0.59a | 32 ± 1.75a | 33 ± 2.80a | 31 ± 0.78a | 33 ± 2.17a | 33.5 ± 1.56a |
| S. G. P. T (u/L) | 9–34 | 38 ± 0.05a | 56 ± 0.78b | 58 ± 1.02b | 63 ± 0.89c | 37 ± 0.57a | 39 ± 0.95a | 41 ± 0.86a | 40 ± 1.68a | 39.5 ± 0.93a | 39.9 ± 1.24a |
| A. phosphatase (u/L) | 65–306 | 275 ± 3.81a | 355 ± 3.57b | 380 ± 2.73c | 390 ± 5.38d | 277 ± 2.01a | 277 ± 1.81a | 279 ± 1.57a | 276 ± 0.63a | 278 ± 1.84a | 280 ± 2.53a |
| 28th day of treatment | |||||||||||
| S. bilirubin (mg/dL) | 0.2–1.2 | 0.52 ± 0.04a | 3.0 ± 0.05b | 3.2 ± 0.15c | 3.5 ± 0.68c | 0.51 ± 0.02a | 0.53 ± 0.02a | 0.52 ± 0.03a | 0.52 ± 0.02a | 0.53 ± 0.01a | 0.54 ± 0.03a |
| S. G. O. T (u/L) | 10–35 | 31 ± 0.57a | 68 ± 0.09b | 80 ± 0.06c | 89 ± 1.72 cd | 31 ± 0.64a | 33 ± 1.03a | 33 ± 1.38a | 32 ± 1.05a | 33.5 ± 1.57a | 34 ± 2.07a |
| S. G. P. T (u/L) | 9–34 | 37 ± 1.53a | 61 ± 1.21b | 68 ± 1.76c | 76 ± 2.25c | 38 ± 1.03a | 39 ± 0.63a | 41 ± 0.68a | 41 ± 1.16a | 40 ± 0.68a | 41 ± 1.09a |
| A. phosphatase (u/L) | 65–306 | 290 ± 4.32a | 360 ± 1.67b | 388 ± 1.86c | 397 ± 1.05 cd | 291 ± 0.54a | 290 ± 0.69a | 293 ± 3.22a | 292 ± 2.07a | 292 ± 1.97a | 293 ± 2.60a |
| Sr. # | Parameter | Cypermethrin |
|
|
|---|---|---|---|---|
| 1 | Glomerulus (G) |
|
|
|
| 2 | Bowman’s capsule (B) |
|
|
|
| 3 | Vascular congestion (C) |
|
|
|
| 4 | Degeneration (D) |
|
|
|
| 5 | Tubular necrosis (TN) |
|
|
|
| 6 | Renal tubules (RT) |
|
|
|
| Parameters | Reference value | Control group | Cypermethrin |
|
| ||||||
|---|---|---|---|---|---|---|---|---|---|---|---|
| 100 ppm | 150 ppm | 250 ppm | 100 ppm | 150 ppm | 250 ppm | 100 ppm | 150 ppm | 250 ppm | |||
| 7 days | |||||||||||
| Urea (mg/dL) | 10–50 | 15 ± 0.5c | 51 ± 0.5a | 52 ± 0.5a | 53 ± 0.5a | 17 ± 0.0c | 20 ± 0.0c | 22 ± 0.0bc | 22 ± 0.5bc | 24 ± 0.0bc | 26 ± 0.0bc |
| 0.6–1.2 | 0.37 ± 0.5b | 0.6 ± 0.0a | 0.7 ± 0.0a | 0.8 ± 0.2a | 0.39 ± 0.8b | 0.40 ± 0.5b | 0.42 ± 0.1a | 0.44 ± 0.5b | 0.46 ± 0.5b | 0.48 ± 0.5b | |
| 3.4–7.1 | 4.0 ± 0.5b | 7.9 ± 0.3a | 8.1 ± 0.5a | 8.2 ± 0.5a | 4.2 ± 0.5b | 4.6 ± 0.5b | 4.8 ± 0.5b | 4.6 ± 0.5b | 4.8 ± 0.5b | 4.9 ± 0.5b | |
| 14 days | |||||||||||
| Urea (mg/dL) | 10–50 | 15 ± 0.5d | 53 ± 0.5a | 53 ± 0.5a | 57 ± 0.5ab | 21 ± 0.0d | 22 ± 0.0d | 24 ± 0.0 cd | 24 ± 0.5 cds | 26 ± 0.0c | 29 ± 0.0c |
| 0.6–1.2 | 0.37 ± 0.5b | 0.7 ± 0.0a | 0.9 ± 0.0a | 0.8 ± 0.2a | 0.42 ± 0.2b | 0.44 ± 0.5b | 0.46 ± 0.1b | 0.44 ± 0.5b | 0.46 ± 0.5b | 0.48 ± 0.5b | |
| 3.4–7.1 | 4.0 ± 0.5b | 7.9 ± 0.3a | 8.5 ± 0.5a | 8.7 ± 0.5a | 4.8 ± 0.5b | 5.0 ± 0.5b | 5.2 ± 0.5b | 5.4 ± 0.5b | 5.6 ± 0.5b | 5.8 ± 0.5b | |
| 21 days | |||||||||||
| Urea (mg/dL) | 10–50 | 15 ± 0.5c | 52 ± 0.5a | 53 ± 0.5a | 54 ± 0.5a | 22 ± 0.0c | 24 ± 0.0c | 27 ± 0.00bc | 27 ± 0.05bc | 30 ± 0.00b | 35 ± 0.00b |
| 0.6–1.2 | 0.37 ± 0.5b | 0.9 ± 0.0a | 0.8 ± 0.0a | 0.9 ± 0.2a | 0.50 ± 0.2b | 0.52 ± 0.5b | 0.54 ± 0.1b | 0.56 ± 0.5b | 0.57 ± 0.5b | 0.59 ± 0.5b | |
| 3.4–7.1 | 4.0 ± 0.5b | 7.9 ± 0.3a | 8.9 ± 0.5a | 8.9 ± 0.5a | 6.0 ± 0.5b | 6.2 ± 0.5b | 6.4 ± 0.5b | 6.6 ± 0.5b | 6.8 ± 0.5b | 6.9 ± 0.5b | |
| 28 days | |||||||||||
| Urea (mg/dL) | 10–50 | 15 ± 0.5c | 51 ± 0.5a | 52 ± 0.5a | 53 ± 0.5a | 27 ± 0.0bc | 29 ± 0.00bc | 30 ± 0.00bc | 32 ± 0.5bc | 34 ± 0.00b | 36 ± 0.00b |
| 0.6–1.2 | 0.37 ± 0.5b | 0.6 ± 0.0a | 0.7 ± 0.0a | 0.8 ± 0.2a | 0.50 ± 0.8b | 0.52 ± 0.5b | 0.54 ± 0.1b | 0.46 ± 0.5b | 0.58 ± 0.5b | 0.60 ± 0.5b | |
| 3.4–7.1 | 4.0 ± 0.5b | 7.9 ± 0.3a | 8.1 ± 0.5a | 8.2 ± 0.5a | 6.2 ± 0.5b | 6.4 ± 0.5b | 6.6 ± 0.5b | 7.0 ± 0.0b | 7.2 ± 0.5b | 7.4 ± 0.5b | |
| Parameters | Reference value | Control group | Cypermethrin |
|
| ||||||
|---|---|---|---|---|---|---|---|---|---|---|---|
| 100 ppm | 150 ppm | 250 ppm | 100 ppm | 150 ppm | 250 ppm | 100 ppm | 150 ppm | 250 ppm | |||
| Haemoglobin (g/dl) | 14–18 | 14.0 ± 0.5a | 11.20 ± 0.5b | 8.50 ± 0.1c | 9.33 ± 0.5c | 14.20 ± 0.5a | 14.53 ± 0.5a | 14.20 ± 0.3a | 14.70 ± 0.5 a | 14.53 ± 0.5a | 14.20 ± 0.5a |
| T. L. C (X109/L) | 4.0–11.0 | 5.8 ± 0.5 | 10.16 ± 0.5b | 13.5 ± 0.2bc | 15.7 ± 0.1c | 6.0 ± 0.5 a | 5.5 ± 0.5a | 5.3 ± 0.5a | 5.8 ± 0.5a | 5.5 ± 0.5a | 5.3 ± 0.5c |
| R. B. C(x1012/L) | 4.6–6.0 | 7.20 ± 0.5a | 7.72 ± 0.2b | 7.50 ± 0.5b | 8.33 ± 0.5c | 7.94 ± 0.5ab | 7.45 ± 0.1a | 7.33 ± 0.5a | 7.6 ± 0.5ab | 7.4 ± 0.1a | 7.3 ± 0.5b |
| HCT (%) | 40–54 | 37.9 ± 0.5a | 72 ± 0.5b | 78 ± 0.1bc | 80 ± 0.2c | 40.80 ± 0.5a | 39.00 ± 0.5a | 38.50 ± 0.5a | 41.5 ± 0.5ab | 40.0 ± 0.5a | 39.9 ± 0.5a |
| MCV (fi) | 80–93 | 80.1 ± 0.5a | 98 ± 0.1b | 104 ± 0.2c | 105 ± 0.1c | 83.5 ± 0.5a | 86.5 ± 0.5a | 88.0 ± 0.5a | 93 ± 0.5ab | 94 ± 0.5ab | 95 ± 0.5ab |
| MCH(pg) | 26–32 | 25 ± 0.5a | 55 ± 0.5b | 58 ± 0.3b | 60 ± 0.2bc | 24.20 ± 0.5a | 25.00 ± 0.5a | 25.90 ± 0.5a | 29.4 ± 0.5a | 29.9 ± 0.5a | 31 ± 0.5ab |
| MCHC (%) | 32–36 | 36 ± 0.5a | 43 ± 0.1b | 46 ± 0.3b | 48 ± 0.5bc | 32.40 ± 0.5a | 32.50 ± 0.5a | 32.00 ± 0.5a | 34 ± 0.5a | 33 ± 0.5a | 33.2 ± 0.5a |
| Platelets (x109/L) | 150–400 | 850 ± 0.5a | 500 ± 0.5b | 550 ± 0.5b | 600 ± 0.2c | 825 ± 0.5a | 835 ± 0.5a | 850 ± 0.5a | 800 ± 0.5a | 790 ± 0.5ab | 750 ± 0.5ab |
| Neutrophils % | 35–65 | 38 ± 0.5a | 74 ± 0.5b | 77 ± 0.2b | 78 ± 0.1b | 48 ± 0.5a | 52 ± 0.5a | 55 ± 0.5a | 63 ± 0.5a | 67 ± 0.5b | 69 ± 0.5b |
| Lymphocytes % | 23–53 | 32 ± 0.5a | 60 ± 0.5b | 62 ± 0.1c | 64 ± 0.2c | 45.0 ± 0.5a | 47.0 ± 0.5a | 48.0 ± 0.5a | 50 ± 0.5a | 58 ± 0.5b | 62 ± 0.5b |
| Monocytes % | 2–11 | 2 ± 0.5a | 19 ± 0.2b | 20 ± 0.3bc | 28 ± 0.5c | 3.4 ± 0.5a | 3.5 ± 0.5a | 3.7 ± 0.5a | 3.4 ± 0.5a | 3.5 ± 0.5a | 3.7 ± 0.5a |
| Eosinophils % | 1–4 | 2 ± 0.5a | 12 ± 0.2b | 13 ± 0.5bc | 18 ± 0.5c | 3.3 ± 0.5a | 3.6 ± 0.5a | 3.9 ± 0.5a | 3.7 ± 0.5a | 3.9 ± 0.5a | 3.9 ± 0.5a |
| (7th day of treatment) | |||||||||
|---|---|---|---|---|---|---|---|---|---|
| Conc. of Treat-ment | Cypermethrin |
|
| ||||||
| Tail. Length (μm) | Tail DNA (%) | T. M (μm) | Tail. Length (μm) | Tail DNA (%) | T. M (μm) | Tail. length (μm) | Tail DNA (%) | T. M (μm) | |
| ( | ( | ( | ( | ( | ( | ( | ( | ( | |
| Control | 14 ± 3.34a | 16.18 ± 2.41a | 2.26 ± 0.52a | 14 ± 3.34a | 16.18 ± 2.41a | 2.26 ± 0.52a | 14 ± 3.34a | 16.18 ± 2.41a | 2.26 ± 0.52a |
| 100 ppm | 39 ± 2.53b | 60.23 ± 1.52b | 7.23 ± 0.34b | 15 ± 2.46a | 16.43 ± 1.57a | 2.68 ± 0.46a | 14.85 ± 1.82a | 16.84 ± 0.85a | 2.58 ± 0.32a |
| 150 ppm | 42 ± 1.53b | 63.34 ± 4.34ab | 9.16 ± 0.53bc | 16 ± 3.77a | 18.38 ± 1.46a | 2.84 ± 0.57a | 16 ± 1.71a | 18.43 ± 1.21a | 2.46 ± 0.61a |
| 250 ppm | 43 ± 3.53b | 68.87 ± 3.37bc | 9.74 ± 0.34bc | 16 ± 0.89a | 18.82 ± 1.38a | 3.05 ± 0.66a | 16.63 ± 1.53a | 18.69 ± 1.28a | 2.74 ± 0.42a |
| (14th day of treatment) | |||||||||
| ( | ( | ( | ( | ( | ( | ( | (F = 10.57) | ( | |
| Control | 15 ± 2.41a | 16.84 ± 1.68a | 2.58 ± 0.48a | 15 ± 2.41a | 16.84 ± 1.68a | 2.58 ± 0.48a | 15 ± 2.41a | 16.84 ± 1.68a | 2.58 ± 0.48a |
| 100 ppm | 43 ± 4.53b | 68.38 ± 3.78c | 9.74 ± 1.05b | 15.74 ± 1.35a | 16.18 ± 1.04a | 2.61 ± 0.28a | 15.45 ± 1.24a | 16.72 ± 1.26a | 2.83 ± 0.32a |
| 150 ppm | 49 ± 3.17bc | 70.52 ± 1.58c | 12.26 ± 2.34bc | 16.68 ± 1.58a | 17.08 ± 1.21a | 2.85 ± 0.79a | 16.24 ± 1.34a | 16.88 ± 1.63a | 2.79 ± 0.29a |
| 250 ppm | 53 ± 2.45c | 86.51 ± 3.06d | 13.74 ± 1.56bc | 16.96 ± 0.89a | 17.13 ± 1.62a | 3.08 ± s0.84a | 17 ± 0.93a | 17.62 ± 1.08a | 2.91 ± 0.46a |
| (21st day of treatment) | |||||||||
| ( | ( | (F = 10.4) | (F = 10.28) | ( | ( | ( | ( | ( | |
| Control | 13.61 ± 2.84a | 16.32 ± 1.73a | 2.43 ± 0.39a | 13.61 ± 2.84a | 16.32 ± 1.73a | 2.43 ± 0.39a | 13.61 ± 2.84a | 16.32 ± 1.73a | 2.43 ± 0.39a |
| 100 ppm | 49 ± 2.43b | 71.68 ± 1.28b | 12.72 ± 1.45b | 14.63 ± 1.46a | 16.84 ± 0.43a | 2.65 ± 0.56a | 13.78 ± 1.89a | 16.28 ± 0.36a | 2.47 ± 0.54a |
| 150 ppm | 54 ± 1.89c | 88.06 ± 1.89c | 14.04 ± 1.31b | 13.82 ± 1.25a | 16.48 ± 0.66a | 2.85 ± 0.69a | 14.82 ± 1.49a | 16.73 ± 0.57a | 2.67 ± 0.46a |
| 250 ppm | 58 ± 1.43c | 93.46 ± 2.43d | 15.43 ± 1.25c | 15.62 ± 1.96a | 17.38 ± 1.27a | 2.93 ± 0.24a | 15.03 ± 1.69a | 16.83 ± 1.63a | 2.88 ± 0.33a |
| (28th day of treatment) | |||||||||
| ( | ( | ( | ( | ( | ( | ( | ( | ( | |
| Control | 14.88 ± 1.24a | 17.04 ± 1.49a | 2.39 ± 0.39a | 14.88 ± 1.24a | 17.04 ± 1.49a | 2.39 ± 0.39a | 14.88 ± 1.24a | 17.04 ± 1.49a | 2.39 ± 0.39a |
| 100 ppm | 56 ± 3.87b | 90.5 ± 1.35c | 15.78 ± 1.68b | 15.67 ± 1.45a | 17.66 ± 0.83a | 2.58 ± 0.48a | 15.87 ± 1.42a | 18.07 ± 1.68a | 2.74 ± 0.38a |
| 150 ppm | 60 ± 2.97bc | 93.5 ± 3.78c | 16.55 ± 1.83b | 16 ± 1.69a | 17.49 ± 0.38a | 2.73 ± 0.53a | 16.07 ± 0.52a | 18.58 ± 1.72a | 2.46 ± 0.44a |
| 250 ppm | 66 ± 1.78c | 98.5 ± 1.27 cd | 25.56 ± 3.62c | 16.71 ± 2.06a | 18.76 ± 1.43a | 2.89 ± 0.21a | 16.38 ± 1.32a | 18.21 ± 1.27a | 3.05 ± 0.86a |
Peer Reviews
No public reviews on file for this paper yet. If you reviewed it on a platform where reviews are public (OpenReview, ICLR, NeurIPS, ICML), you can paste yours below so the community can read it here.
Videos
No videos yet. Explain this paper in a talk, walkthrough, or lecture? Add one.
Taxonomy
TopicsInsect Pest Control Strategies · Pesticide Exposure and Toxicity · Carcinogens and Genotoxicity Assessment
Introduction
1
Synthetic chemicals are extensively used for quick pest control worldwide. Unlike other conventional control measures, it leads to a rapid eradication of massive insect production (1). However, their excessive use creates a number of environmental concerns, such as biomagnification of pesticides in the food chain and persistence of insecticide resistance in insects. Environmental pollution is considered the most serious issue mankind is currently facing (2, 3). In the larger context, it is a by-product of human activities, i.e., indiscriminate use of pesticides affects living populations either directly or indirectly (4, 5). Being universally and easily available around, pyrethroids are extensively used pesticides with a wide range of applications, i.e., crops, gardens, and homes. Resultantly, there is a considerable risk that these pesticides contaminate the ecosystem. In addition to numerous health concerns, exposure to these pesticides has been linked with a decline in biodiversity, bird species, particularly fish-eating birds, fish, and various other useful insects (2, 3, 6–8). Even very low residual level of synthetic pesticides have been reported to cause disastrous consequences such as brain and nerve damage, liver problems (hepatic fibrosis and jaundice), teratological defects, allergenic sensitization, respiratory diseases (asthma and emphysema), infertility or sterility, blood disorders (blood coagulation defects and anemia) paralysis, impotence, cancer, and various other genetic defects (9–15).
Since excessive use of these synthetic pesticides raises significant environmental and health concerns, this is considered the most pressing issue worldwide. Subsequent exposure to these chemicals is linked to changes in physiological functions, reproductive performance, enzymatic activities, and various other biochemical and hematological parameters. Hence, attention has been focused on the toxicological impact of these insecticides in insects and mammals (13, 16–22).
So far, more than 2,400 plant species have been identified as they have bioactive compounds responsible for their insecticidal properties (19, 23–27). With an increasing trend in the use of plant-based biopesticides, a considerable number of indigenous plants have also been reported for their insecticidal activity (19, 20, 23, 28, 29, 30).
Plant extracts have been demonstrated as alternatives to synthetic pesticides, suggesting that they could be integrated in agriculture sector for insect pest control. Additionally, plant-based bio-pesticides are considered non-toxic to non-target species and, more importantly, they are environmentally safe. We have previously reported that Achyranthes aspera and Chenopodium murale were effective, particularly against Drosophila, house flies, mosquitoes, and stored grain insects, and potentially could be used against a range of insect pests as a controlling agent (19, 20, 23, 28, 30).
Given the efficacy and insecticidal potential of A. aspera and C. murale, it was aimed to determine whether these plants, when used as biopesticides, are safe for humans and other mammals. Therefore, the albino rat, most commonly used model organism for pharmacology, toxicology, physiology, and pathophysiological research work, was selected in this study to evaluate the toxicological response of Achyranthes aspera and Chenopodium murale. Cypermethrin is a broad-spectrum synthetic pyrethroid, ranked top across Pakistan and being extensively used against a wide range of insect pests (31). Therefore, this pyrethroid insecticide was selected as the reference treatment during this study.
Materials and methods
2
The present study was designed to evaluate the toxic effects of Achyranthes aspera and Chenopodium murale in albino rats, using pyrethroids Cypermethrin as a reference. The experimental work was performed at the Animal Lab, Department of Pharmacy, and Department of Zoology, Govt. College University Faisalabad.
Collection of plant material
2.1
Whole plants of C. mural and A. aspera were collected from their natural habitat, Faisalabad. The collected plants were cleaned with distilled water, kept under shade at room temperature to dry, and then crushed into small pieces. They were further dried using an oven and converted into fine powder using an electric grinder. Extraction was performed following the methodology described by Sultana et al. (28) with minor modifications. The obtained fine powder (250 g) was dissolved in absolute ethanol (1,000 mL) at a 1:4 ratio (w/v) and was shaken well on a rotary shaker @ 250 rpm for 24 h.
Preparation of crude extracts
2.2
The ethanolic plant extracts were filtered using Whatman No. 1 filter paper to obtain a clear extract. Crude extract was obtained from this ethanol filtered extract by concentrating it at 50 °C with the help of a rotary evaporator. The obtained crude extract was stored at 4 °C in a refrigerator until used. The doses of 100, 150, and 250 ppm used in the present study were prepared by diluting the extracts in distilled water (19, 22, 23, 28).
Experimental design
2.3
The study was performed for 28 days in 3–4 weeks old albino rats, Rattus norvegicus of 100—190 g in weight (13), purchased from the animal house of the University of Agriculture Faisalabad and their rearing was carefully maintained at lab conditions as described by Khalil et al. (21), Khalil et al. (22), and Akhtar et al. (32). Rats were orally administered with different doses (100, 150, and 250 ppm) of plant extracts and cypermethrin (mixed in food), and data were collected at every 7, 14, 21, and 28 days. All the albino rats were weighed before starting the experiment. Cypermethrin and plant extracts were given to albino rats through oral administration with diet on alternate days. The experiment was designed in four main groups, i.e., Control, Cypermethrin, C. murale, and A. aspera. Three concentrations; 100, 150, 250 ppm were used for three subgroups within each main group of treatment. Each subgroup randomly contained eight (n = 8) albino rats (22, 33). All the experimental procedures adhered to the guidelines of the National Institute of Health (NIH) and OECD standards (TG 407) of 28 days trial study for the care and use of laboratory animals (32, 34). The approval was made prior to the start of work from the Ethical Committee of the Government College University, Faisalabad (416-A, GCUF).
Dissection and samples preservations
2.4
The rats were anesthetized and sacrificed at 7, 14, 21, and 28 days. A combination of ketamine (80–100 mg/kg) and xylazine (5–10 mg/kg) intraperitoneally was administered following the protocol of Aguwa et al. (35). Blood samples were collected in well-labeled serum vials containing EDTA solution for biochemical/enzymatic analysis, while the liver and kidney were removed for histological studies and were fixed immediately in 10% neutral buffered formalin (13, 22, 32).
Enzyme assay
2.4.1
Acetylcholinesterase (AChE) activity was measured by the colorimetric method used by Kašuba et al. (36) with little modifications, using acetylthiocholine iodide (ATChI) as the enzymatic substrate. The tissue homogenates were prepared in 0.1 M phosphate buffer (pH 7.4) and centrifuged at 10,000 × g for 10 min at 4 °C. An aliquot (50–100 μL) of the resulting supernatant was added to the reaction mixture containing 0.1 M phosphate buffer (pH 8.0), 1 mM 5,5′-dithiobis-(2-nitrobenzoic acid) (DTNB), and 1 mM ATChI in a final reaction volume of 3 mL. The formation of 5-thio-2-nitrobenzoate (TNB) was monitored spectrophotometrically at 412 nm for 3–5 min at room temperature. Enzyme activity was calculated from the linear rate of absorbance change using the molar extinction coefficient (ε = 13,600 M^−1^ cm^−1^) and expressed as U/mg protein, where one unit (U) represents the hydrolysis of 1 nmol of substrate per minute under assay conditions. The activity of ALP in the serum samples was determined using the Erba ALP kit, according to the kit instructions. The serum samples were set up in the reaction wells, and substrate solution containing p-nitrophenyl phosphate, pNPP, was added. The substrate, pNPP, is hydrolyzed by the ALP enzyme to produce p-nitrophenol, which produces a yellow color detectable with a wavelength of 405 nm using a spectrophotometer after the reaction mixture is allowed to reach room temperature for the recommended time, and the reaction is then arrested using the stop solution supplied with the kit. Activity of ALP was determined based on absorbance measurements utilizing a standard curve that was obtained from a calibrator solution provided in the kit. It was measured in U/L. One unit of ALP was defined as the amount that carries out 1 μmol p-nitrophenyl phosphate per minute. All samples for ALP activity measurements were measured in duplicates. Absorbance was read using a microplate reader (37). The level of different hepatic enzymes in blood was determined from the serum collected from different treatment groups (33, 36, 38, 39).
Analysis of histopathology
2.4.2
Preserved organs were processed for histopathological studies as described by Bancroft and Gamble (51). Tissues were treated with 10% buffered formalin for fixation and cut into 5 mm thick pieces and placed in water overnight to remove all residue of fixative. Slices of tissues were then dehydrated gradually in 70, 85, 95%, Absolute alcohol-I and Absolute alcohol-2 for 8, 4, 4, 2, and 2 h, respectively. Dehydrating agent was eliminated by cleaning with Xylene + Absolute Alcohol (50 + 50), Xylene-1, and Xylene-2 for 30, 15, and 15 min, respectively. Infiltration was carried out in liquid paraffin at 59–60 °C for 2 h. After embedding and staining by using H and E stain adopting protocols, a drop of DPX was put on the cover slip, and it was placed on the stained section, avoiding bubble formation. Afterward 3–4 μm thick section will be studied under a light microscope at 4, 20, 40, and 100 magnifications. Slides of all the treated groups were studied, and photographs were taken (21, 22, 32).
Analysis of hematological parameters
2.5
All blood samples were collected at every 7, 14, 21, and 28 days in serum vials containing EDTA solution, and serum was separated by placing the samples into a centrifugal machine by centrifugation at 3000 rpm for 10 min. As already described, the rats were sacrificed at every 7, 14, and 28 days, respectively. Detailed postmortem examinations were conducted by opening up the belly of the rats, gross lesions, fatty lesions, organ color, and internal hemorrhages were noted, the liver and kidney were fixed in 10% formalin for histology, and in phosphate buffer saline for enzymatic assay.
The blood serum from collected blood samples was used to determine the level of hepatic enzymes (bilirubin, S. G. O. T, and S. G. P. T), A. phosphatase (ALP) by using Armstrong method, and kidney enzymes, uric acid, urea (Diacetyl Monoxide Method), and creatinine (Modified Jaffer’s Method) (21, 22).
The blood parameters were analyzed by using a hematology auto analyzer CELL-DYN for the analysis of red blood cells (RBC, 10^6^ cells/mm^3^) count, white blood cells (WBC, 10^3^ cells/mm^3^) counts, hemoglobin (Hb, g/dL), platelets (total thrombocytes count, 10^4^ cells/mm^3^), differential leucocytes count (DLC), including numbers of Lymphocytes, neutrophils, monocytes, Eosinophil per 100 cells, total leukocytes count (TLC, 10^3^ cells/mm^3^), HCT (%), MCV, MCH, and MCHC (%).
Genotoxicity assessment through comet assay
2.6
To analyze the DNA damage due to different treatments, the comet assay was performed following the protocol described by Attaullah et al. (30) and Khalid et al. (40).
Statistical analysis
2.7
Results were statistically analyzed through ANOVA. The results are presented as the mean for each group. Differences among groups were analyzed using a one-way analysis of variance (ANOVA) test. Means were separated by using Tukey’s HSD test at a significance level of 0.05. A p-value < 0.05 was considered statistically significant (28, 33, 41, 42).
Results
3
Phytochemical constituents of both weed plants were characterized using biochemical assay and through Fourier Transform Infrared Spectroscopy (FTIR) by our laboratory (19). Both Achyranthes aspera and Chenopodium murale showed the presence of Flavonoids, Saponins, Tannins, Steroids, Cardiac glycosides, and Alkaloids. However, Achyranthes aspera also showed anthraquinones and terpenoids. FTIR spectrum of Achyranthes aspera revealed peaks corresponding to –OH group (phenolic group), alkyl C-H group, C=H group, C-O stretching, and CH bending for aromatic ring. Overall, FTIR results revealed the presence of phenolic compounds in the petroleum ether extract of A. aspera. The FTIR spectrum for Chenopodium murale revealed the presence of stretching peaks corresponding to O-H, -CH_2_, C=O, and C-H groups. The bands were found as an indication of phenolic compounds having carboxylic acids present in the organic extracts of Chenopodium murale (19, 20).
Enzyme activity
3.1
Acetylcholine esterase (AChE)
3.1.1
The activity of AChE was measured in cypermethrin and plant extracts; C. murale and A. aspera, treated groups, and compared with the control group after 7, 14, 21, and 28 days, respectively. AChE activity was decreased with an increase in concentrations and exposure time, as shown in Table 1. Cypermethrin showed significantly low activity of AChE, i.e., 0.217, 0.203, and 0.172 as compared to control at the concentrations 100, 150, and 250 ppm, respectively, after 28 days following the activity of AChE; 0.255, 0.243, and 0.235 after 7 days; 0.248, 0.240 and 0.213 after 14 days; and 0.232, 0.228 and 0.187 after 21 days at 100, 150 and 250 ppm concentrations of cypermethrin, respectively. AChE activity was significantly (p < 0.05) decreased with increasing exposure time and concentrations of cypermethrin, while the treatment with plant extracts showed a non-significant (p > 0.05) difference in the activity of AChE as compared to the control group (Table 1).
Activity of AlkP
3.1.2
Similarly, the activity of AlkP was measured in cypermethrin and both the plants extracts, C. murale and A. aspera, treated groups, and compared with the control group after 7, 14, 21, and 28 days. Results showed that AlkP activity was increased with increasing concentrations and exposure time (Table 1). Cypermethrin showed the significant higher activity of AlkP (291, 307, and 321) as compared to control at the concentrations 100, 150, and 250 ppm, respectively, after 28 days following the activity of AlkP (276, 280, and 287), (278, 291, and 301) and (285, 298, and 317) at (100, 150, and 250 ppm) concentrations of cypermethrin, respectively, after 7, 14, and 21 days, respectively. AlkP activity was significantly (p < 0.05) increased with increasing exposure time and concentrations of cypermethrin, while the treatment with plant extracts showed a non-significant (p > 0.05) difference in activity of AlkP as compared to the control group (Table 1).
Histopathology of liver tissue
3.2
Histological comparison was performed between liver tissues of cypermethrin and plant extracts; C. murale and A. aspera groups with respect to control at different doses (100, 150, and 250 ppm) and different time periods (7, 14, 21, and 28 days) by light microscopy. The control group showed regular and compact structure with well-organized hepatic cells and central veins. No toxic effect of C. murale and A. aspera plant extracts was observed on the liver structure of albino rats at different doses and different time periods. Plant extracts treated group indicated about the same structure of liver as the control group, while cypermethrin caused severe damage to liver tissue and showed different histopathological alterations at different doses and times. The cypermethrin-treated albino rats group showed different histopathological alterations at different doses and times. The treatment group of cypermethrin for 7 days showed moderate enlargement of sinusoids, vacuole formations in hepatocytes, and congestion in the central vein; the exposure of cypermethrin for 14 days caused enlargement in the sinusoidal space and hemorrhages in liver tissue. However, most of the intrahepatic blood vessels, especially the central veins, were dilated and congested at 21 days (data not shown). The treatment of cypermethrin for 28 days showed that some areas of liver tissue appeared with necrosis infiltrated with mononuclear cells. In addition, the hepatocytes lost their normal architecture and vacuolization, and pyknotic nuclei appeared in the cytoplasm. Overall, the liver section of the cypermethrin treatment group showed granulomas (macrophage collection), indicating an immune response to inflammation (granulomatous inflammation) and infection in the portal region or necrosis of liver tissues, dilation or severe congestion of the intrahepatic blood vessels, especially the central veins, and hemorrhage in hepatic tissue (Figure 1 and Table 2). Due to cypermethrin exposure, three rats died between 16 and 28 days. The most serious damage to liver tissues was observed at the highest dose (250 ppm) of cypermethrin at 28 days. However, both the plants, Chenopodium murale and Achyranthes aspera, showed about the same liver structure as the control group (Figure 1 and Table 2).
Histological comparison of liver tissues: Control, cypermethrin, and plant extracts; C. murale and A. aspera groups at different doses (28 days). Control group: Normal hepatic architecture with undamaged hepatocytes (H), central veins (CV), and regular sinusoids (S). Cypermethrin-treated group: Hepatocyte necrosis, congestion, cytoplasmic vacuolation (V), and sinusoidal dilatation (SD) in a dose-dependent liver injury. C. murale and A. aspera: Normal hepatic cords, decreased vascular congestion, and nearly normal architecture. These results show that cypermethrin induced hepatotoxicity, while both plant extracts had no changes in liver tissue.
Hepatic enzymes parameters
3.3
Level of liver enzymes in serum, i.e., S. bilirubin, SGOT, SGPT, and A. phosphatase, were determined after 7, 14, 21, and 28 days of exposure of albino rats to cypermethrin and C. murale and A. aspera plant extracts. It was revealed that serum bilirubin was significantly increased after 7 days with cypermethrin as compared to control; it was 2.3, 2.4, and 2.9 mg/dL at 100, 150, and 250 ppm concentrations of cypermethrin, respectively. S. bilirubin was increased with exposure time and concentrations of cypermethrin. The highest level of S. bilirubin was observed after 28 days in cypermethrin treated group; 3, 3.2, and 3.59 mg/dL at 100, 150 and 250 ppm concentrations of cypermethrin, respectively. Similarly S.G.O.T was found highest after 28 days in cypermethrin treated group; 68, 80, 89 u/L following 65, 66, and 78 u/L after 14 days, and 67, 78, and 84 u/L after 21 days at 100, 150 and 250 ppm concentrations of cypermethrin, respectively (Table 3). Hence, S. bilirubin level was increased significantly (p < 0.05) as compared to control at all concentrations of cypermethrin after 7, 14, 21, and 28 days exposure of albino rats to cypermethrin; however, the S. bilirubin level was found non-significant (p > 0.05) in control group and C. murale and A. aspera plant extracts at all concentrations and exposure time of 7, 14, 21, and 28 days (Table 3). After 7 days, S.G.O.T level was 60, 62, and 70 u/L at 100, 150, and 250 ppm concentrations of cypermethrin, respectively. The highest level of S.G.P.T was 61, 68, and 76 u/L at 100, 150, and 250 ppm concentrations of cypermethrin, respectively, after 28 days following 7, 14, and 21 days with level of S.G.P.T 50, 52, and 55 u/L; 54, 55, and 59 u/L; and 56, 58, and 63u/L, respectively, at 100, 150, and 250 ppm concentrations, respectively (Table 3). The highest level of A. phosphatase was 360, 388, and 397 ul at 100, 150, and 250 ppm concentrations of cypermethrin, respectively, after 28 days, following 7, 14, and 21 days with 350, 354, and 359 u/L; 353, 356, and 364u/L; and 355, 380, and 390 u/L, respectively, at concentrations of 100, 150, and 250 ppm, respectively. The level of all studied enzymes of the liver in the blood was significantly (>0.05) higher as compared to control at all exposure times and concentrations of cypermethrin, while the treatment of plant extracts showed a non-significant difference in the level of enzymes as compared to control (Table 3).
Histopathological findings of the kidney
3.4
Histopathological analysis of kidney tissue at different concentrations of ethanolic extracts of C. murale and A. aspera, and cypermethrin was observed in male albino rats. Cypermethrin showed significant changes in kidney tissues at all concentrations and exposure times as compared to the control group. The plant extracts did not show any significant changes in tissue even at the highest concentration (250 ppm) as compared to the control group. The transverse structure of the kidney cells in the control group showed ordinary arrangements of Bowman’s capsule, urinary pulp, glomerulus, proximal and distal convoluted tubules, and podocytes. However, oral doses of cypermethrin produced significant changes in the histology of kidney tissue, especially at high dosage 250 ppm after 28 days. Cypermethrin-treated group kidney structure showed necrosis of renal tubules, fibrosis, and swelling in Bowman’s capsule in the treatment period of 28 days. C. murale and A. aspera had no adverse effect on the kidney at the time and dose range used in the present study. There was no significant modification in the kidney, nor did the plant extracts cause any alteration in the micro-arrangement of the kidney (Figure 2 and Table 4).
Histological comparison of kidney tissues: Control, cypermethrin, and plant extracts; C. murale and A. aspera groups at different doses (28 days). Control group: Kidney with intact glomeruli, a small Bowman’s capsule (B), and neatly aligned renal tubules (RT). Control shows normal renal histoarchitecture. Cypermethrin-treated group: Glomerular degeneration (DG) and vascular congestion (C), tubular necrosis (TN), and epithelial desquamation are among the progressive nephrotoxic changes. C. murale and A. aspera: Renal tubules (RT), glomerulus (G), Bowman’s capsule (B), vessel (V), and degeneration (D). Plant extracts show almost normal glomeruli with little tubular dilatation (D).
Kidney enzyme parameters
3.5
Histopathological results of the cypermethrin and both the extracts treated rats are shown in Table 3. Non-significant results were found after treatment with plant extracts compared to the control group. Enzyme histology of kidney tissue revealed the value of the control group as 15 mg/dL, which is non-significant and safer against a reference value of S. urea 10–50 mg/dL. A significant increase was observed in the cypermethrin-treated group, whereas non-significant results were found with both plant extracts. Creatinine has values between 0.6 and 1.2 when compared with the control group, which showed a 0.43 mg/dL value. Uric acid was found between 3.4 mg/dL and the comparison with the control group, 3.6 mg/dL, showed a highly non-significant difference. Creatinine, urea, and uric acid of both plant extracts have non-significant results when compared with the control group. No sharp difference in hematological parameters was observed (Table 5).
Hematological parameters
3.6
The blood parameters of treated rats were analyzed which revealed significant changes in blood parameters (Hb, TLC, RBCs, HCT, MCH, MCHC, Platelets, Neutrophils, Lymphocytes, Monocytes, and Eosinophils) against administration of different doses (100, 150, and 250 ppm) of cypermethrin at 28 days while both plant extracts, C. murale and A. aspera, did not show significant changes in these parameters as compared to control group. However, C. murale and A. aspera showed an increase in MCV, percentage of neutrophils, and lymphocytes at 150 and 250 ppm dose concentrations. A. aspera showed a significant decrease in platelets as compared to control at 250 ppm, but this decrease was slightly less than that of cypermethrin at all doses. Cypermethrin showed a significant decrease in platelets and Hb but an increase in TLC and RBCs. HCT, MCV, MCH, MCHC, Neutrophils, Lymphocytes, Monocytes, and Eosinophils; while both plant extracts did not showed significant increase in these parameters except MCV, neutrophils, and lymphocytes (Table 6 and Supplementary Tables 1–3).
Genotoxic effects in albino rats due to exposure to different concentrations of cypermethrin and plant extracts
3.7
Of genotoxic effects of cypermethrin and plant extracts, C. murale and A. aspera, cypermethrin showed a significant (p < 0.05) difference in comet parameters by comparing with the control group. Tail length, tail DNA, and tail movement (TM) were measured in treated and control groups after 7, 14, 21, and 28 days. Tail length was significantly (p < 0.05) increased, i.e., 56, 60, and 66 μm at 100, 150, and 250 ppm concentrations of cypermethrin, respectively, as compared to control group after 28 days following 7, 14, and 21 days with tail length 39, 42, and 43 μm; 43, 49, and 53 μm; and 49, 54, and 58 μm, respectively, at the concentrations of cypermethrin 100, 150, and 250 ppm, respectively. The percentage of tail DNA was significantly (p < 0.05) higher, i.e., 90.5, 93.5, and 98.5% at 100, 150, and 250 ppm of cypermethrin, respectively, as compared to control group after 28 days following 7, 14, and 21 days with percentage of tail DNA (60.23, 63.34, and 68.87%), (68.38, 70.52, and 86.51%), and (61.68, 88.06, and 93.46%), respectively, at different concentrations of cypermethrin (100, 150, and 250 ppm), respectively. Tail movement (TM) was significantly (p < 0.05) increased, i.e., 15.78, 16.55, and 25.56 μm at 100, 150, and 250 ppm concentrations of cypermethrin, respectively, as compared to control group after 28 days following 7, 14, and 21 days with tail movement (7.23, 9.16, and 9.74 μm), (9.74, 12.26, and 13.74 μm), and (12.72, 14.04, and 15.43 μm), respectively, at different concentrations of cypermethrin (100, 150, and 250 ppm), respectively. All the comet parameters were significantly (p < 0.05) increased as compared to the control after 7, 14, 21, and 28 days of exposure to different concentrations of cypermethrin, while the treatment of plant extracts showed a non-significant (p > 0.05) difference in comet parameters as compared to the control group (Table 7). The highest level of DNA damage was observed at the highest dose (250 ppm) of cypermethrin at 28 days (Figure 3).
Comet assay for genotoxic effect: control, cypermethrin, and plant extracts; C. murale and A. aspera groups at different doses (28 days).
Discussion
4
Plant-based extracts have been reported with a variety of properties they exhibit against various insect pests, i.e., entomocidal effect, insect repellants, insect attractants, anti-feedants, oviposition inhibition, enzyme inhibition, growth regulation, and impact on adult emergence (19, 20, 23, 28, 30, 43). Because of their complex chemical composition, it is comparatively difficult for any pest to develop resistance (43). Hence, given their eco-friendly nature and keeping in view the issues of insecticide resistance and human health concerns, it is evident that plant-derived biopesticides have a promising future (43, 44).
Indigenous weed plants, A. aspera and C. murale, have previously been reported to be very effective against many insect pests by our laboratory (19, 20, 23, 28, 30). So, to further evaluate whether these plants have some adverse effects on mammalian models, the present study was performed. Regarding cypermethrin, it has been reported by Pakistan Crop Protection Chemicals Market that it leads at the top among synthetic insecticides across Pakistan. It is estimated that it would grow from 251.3 million USD in 2025 to ~300 million USD by 2030 (31). Therefore, cypermethrin was used as a reference treatment. Different parameters, including enzyme activity, level of hepatic enzymes in blood serum, damage to liver tissues (histopathology), and genotoxic impact (comet parameters), were studied. Cholinesterases are reported with special concern in the toxicology of all pesticides affecting the nervous system; hence, modulation of AChE is useful as a marker for hepatotoxicity (36). Thus, AChE and AlkP enzymes, which are modulated in insects, were also focused on in the present study (19, 20, 28, 30, 33, 36). AChE activity was found to be significantly decreased with cypermethrin in the current study, which is in agreement with the previous findings of Kašuba et al. (36) in liver and kidney tissues for 28 days. Furthermore, consistent with Hadi and Yassin (38) and Veerappan et al. (39), AlkP activity was significantly increased with cypermethrin. However, the treatment with plant extracts showed a non-significant difference in the activity of AChE and AlkP. The significant change in the activity of enzymes against cypermethrin showed hepatotoxicity, while no change in liver tissue was found with both plant extracts. It is worth mentioning that these plants have already been reported to be toxic to targeted insects (19, 20, 23, 28, 30). Similarly, liver enzymes in serum, i.e., S. bilirubin, SGOT, SGPT, and A. phosphatase were found significantly higher with cypermethrin, and both C. murale and A. aspera showed a non-significant difference. This is in contrast with some previous studies wherein plant extracts caused changes in hepatic enzymes and altered the biochemical parameters in rats (45–47). Overall, the current biochemical findings confirm liver damage in albino rats due to cypermethrin, and no effect with both C. murale and A. aspera verify their non-toxicity to albino rats. Furthermore, histological analyses of liver and kidney tissues are in line with those of Seven et al. (33) showed damage in tissues of both organs at all concentrations of cypermethrin. These results confirm that the extracts from C. murale and A. aspera are cytologically and biochemically not toxic to albino rats. In consistent with the results of (21, 22), the level of creatinine, urea, uric acid, and hematological parameters (Hb, TLC, RBCs, HCT, MCH, MCHC, Platelets, Neutrophils, Lymphocytes, Monocytes, and Eosinophils) were also altered significantly with the treatment of cypermethrin.
Resistance against synthetic pesticides has previously been reported in many studies (18, 48, 49); thus, the genotoxicity of synthetic pesticides is an indication of subsequent resistance (33, 36). DNA damage associated with low residual levels of synthetic pesticides can induce mutagenicity, genotoxicity, carcinogenicity, and subsequent genetic disorders, bone marrow disorders, birth defects, impotence, and infertility or sterility in mammals (10, 12, 14, 33, 36). The comet assay performed in the present study showed that all the comet parameters (tail length, tail DNA, and tail movement) were significantly increased, which also confirmed the genotoxic effects of cypermethrin, whereas both C. murale and A. aspera showed non-significant differences in comet parameters as compared to the control. These results are supported by previous studies wherein cypermethrin induced genotoxicity in rats while the plant extracts showed the protective effects on these genetic alterations (10, 14). In a nutshell, both plants had non-significant differences comparable to the control for all toxicological parameters, which indicates that they are not toxic to rats and thereby to the vertebrates as compared to the synthetic insecticide, the cypermethrin. These findings suggest that these weed plants have the potential to be used as biopesticides for future Integrated Pest Management (IPM) programs.
Conclusion
5
Being a rapid insect pest controlling agent worldwide, synthetic pesticides pose a great risk to humans and the environment, which direly underscores the necessity of an alternative measure. Hence, plant-based biopesticides provide a good opportunity to be incorporated into pest management programs. Previously, we showed that leaf extracts of Chenopodium murale and Achyranthes aspera had an insecticidal potential, and to move ahead from a vertebrate safety viewpoint, both plant extracts were employed to evaluate biochemical, histopathological, and genotoxic effects in albino rats. Cypermethrin was used as a reference treatment, which showed congestion in the central vein, hemorrhage in hepatic tissues, and necrosis of liver tissues; while in kidney tissues, hemorrhage was attenuated by degenerated inflammatory cells, edema, and shrinkage and rupturing of glomeruli, necrosis of renal tubules, fibrosis, and swelling in Bowman’s capsule were observed. With plant extracts, no physical signs of toxicity and alteration in the micro-arrangement of the kidney were observed. The enzymes, Acetylcholinesterase (AChE) and Phosphatase, showed significant results with cypermethrin, while non-significant results with plant extracts. Furthermore, genotoxicity through the comet assay revealed no changes with both plant extracts. Moreover, no significant change was observed in blood parameters with plant extracts. Overall, both studied plants showed a non-significant difference to the control for all parameters, which is an indication of their non-toxicity to rats, and, thereby, it was concluded that these weeds are not toxic to vertebrates. Thus, focus should be given to develop a plant-extract-based biopesticide from these plants and incorporate it in IPM programs to avoid environmental and human health issues in future.
The reference list from the paper itself. Each links out to its DOI / PubMed record.
- 1Wojciechowska M Stepnowski P Gołębiowski M. The use of insecticides to control insect pests. Invertebr Surv J. (2016) 13:210–20. doi: 10.25431/1824-307X/isj.v 13i 1.210-220 · doi ↗
- 2Gyawali K Acharya P Poudel D. Environmental pollution and its effects on human health. Interdiscip Res Educ. (2023) 8:84–94. doi: 10.3126/ire.v 8i 1.56729 · doi ↗
- 3Shetty SS Deepthi D Harshitha S Sonkusare S Naik PB Madhyastha H. Environmental pollutants and their effects on human health. Heliyon. (2023) 9:e 19496. doi: 10.1016/j.heliyon.2023.e 1949637662771 PMC 10472068 · doi ↗ · pubmed ↗
- 4Ansari MS Moraiet MA Ahmad S. Insecticides: impact on the environment and human health. In: Malik A Grohmann E Akhtar R editors. Environmental Deterioration and Human Health: Natural and Anthropogenic Determinants. Dordrecht: Springer Netherlands (2014). 99–123.
- 5Cope WG Leidy RB Hodgson E. Classes of toxicants: use classes. In: Hodgson E editor. A Textbook of Modern Toxicology. John Wiley & Sons, Inc., Hoboken, New Jersey: Wiley Online Library (2004). 49–74. doi: 10.1002/0471646776.ch 5 · doi ↗
- 6Arya A. K. Singh A. Bhatt D. (2019). Pesticide applications in agriculture and their effects on birds: an overview. In: Kumar V Kumar R Singh J Kumar P editors. Contaminants in Agriculture and Environment: Health Risks and Remediation. Agro Haridwar, India: Environ Media, Agriculture and Environmental Science Academy. 5, 130–137.
- 7Isenring R. Pesticides and the Loss of Biodiversity. London: Pesticide Action Network Europe (2010).
- 8Saleemi MK Raza A Khatoon A Zubair M Murtaza B Jamil M . Toxic effects of aflatoxin B 1 on hematobiochemical and histopathological parameters of juvenile white leghorn male birds and their amelioration with vitamin E and Moringa oleifera. Pak Vet J. (2023) 43:405–11. doi: 10.29261/pakvetj/2023.053 · doi ↗