Leveraging transdiagnostic genetic liability to psychiatric disorders to dissect clinical outcomes of anorexia nervosa
Zheng-An Lu, Alexander Ploner, Andreas Birgegård, Andreas Birgegård, Andreas Birgegård, Nancy L. Pedersen, Shuyang Yao, Julien Bryois, Virpi M. Leppä, Paul Lichtenstein, Jessica H. Baker, Stephanie Zerwas, Laura M. Thornton, Maria C. La Via, Melissa A. Munn-Chernoff

TL;DR
This study explores how shared genetic risks across psychiatric disorders affect the clinical outcomes of anorexia nervosa, finding that shared genetic liability is linked to worse outcomes.
Contribution
The study introduces a novel approach using transdiagnostic genetic liability to explain clinical heterogeneity in anorexia nervosa.
Findings
Shared psychiatric genetic liability is associated with increased risk of disease burden and comorbidities in anorexia nervosa.
Anorexia-specific genetic liability does not significantly predict clinical outcomes.
MDD-specific genetic liability is linked to increased anorexia disease burden.
Abstract
Anorexia nervosa (AN) has extensive genetic correlations with other psychiatric disorders, and genetic risk for different psychiatric disorders was associated with distinct clinical courses in AN. Uncovering associations between transdiagnostic psychiatric genetic liability and AN outcomes can facilitate its personalized treatment. In this study, we investigated the associations between transdiagnostic psychiatric genetic liability and outcomes of AN. Genomic structural equation models were fitted to genome-wide association data for AN and psychiatric disorders with high genetic correlations with AN (obsessive-compulsive symptoms [OCS], major depressive disorder [MDD], schizophrenia, and anxiety disorders) to extract one shared and five trait-specific genetic components. Next, we calculated the polygenic risk scores (PRS) for these components, including PRSshared, PRSAN-specific,…
Genes, proteins, chemicals, diseases, species, mutations and cell lines named across the full text — each resolved to its canonical identifier and authoritative record.
Click any figure to enlarge with its caption.
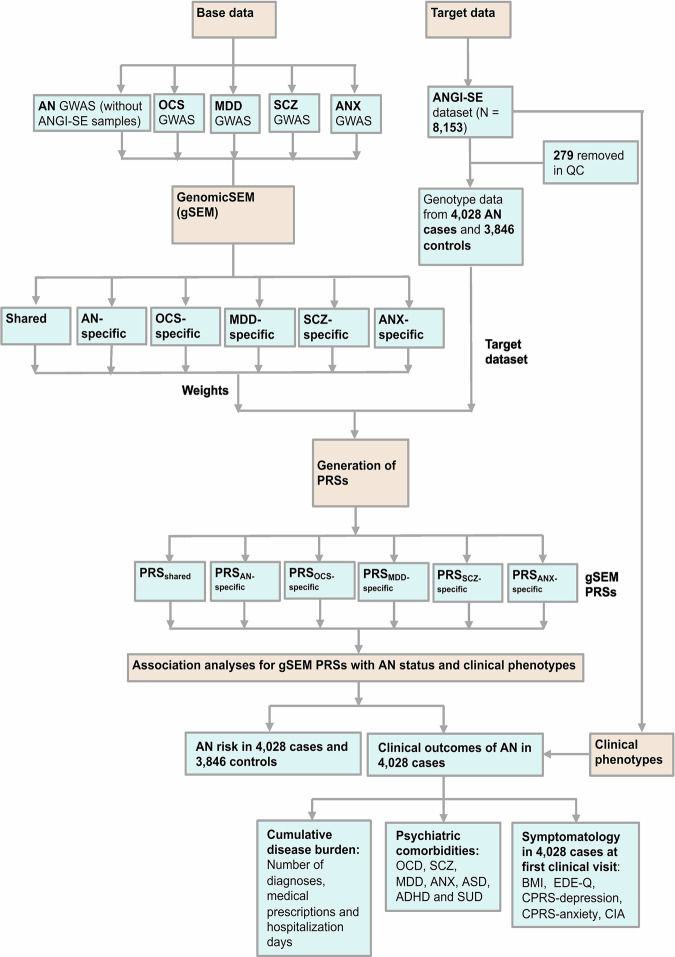 Figure 1
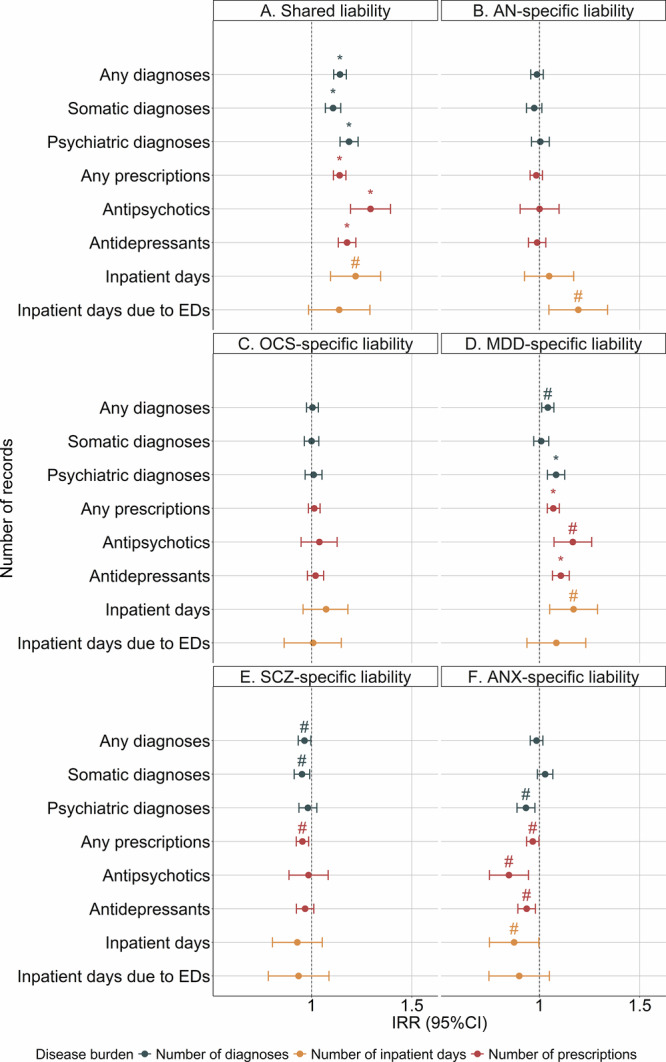 Figure 2
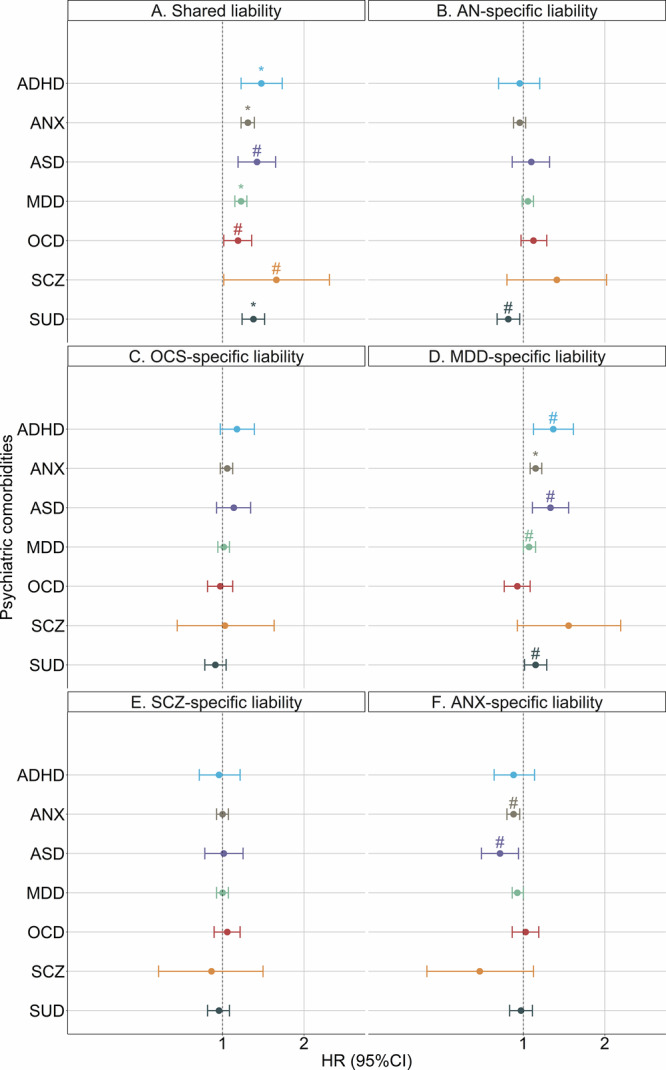 Figure 3
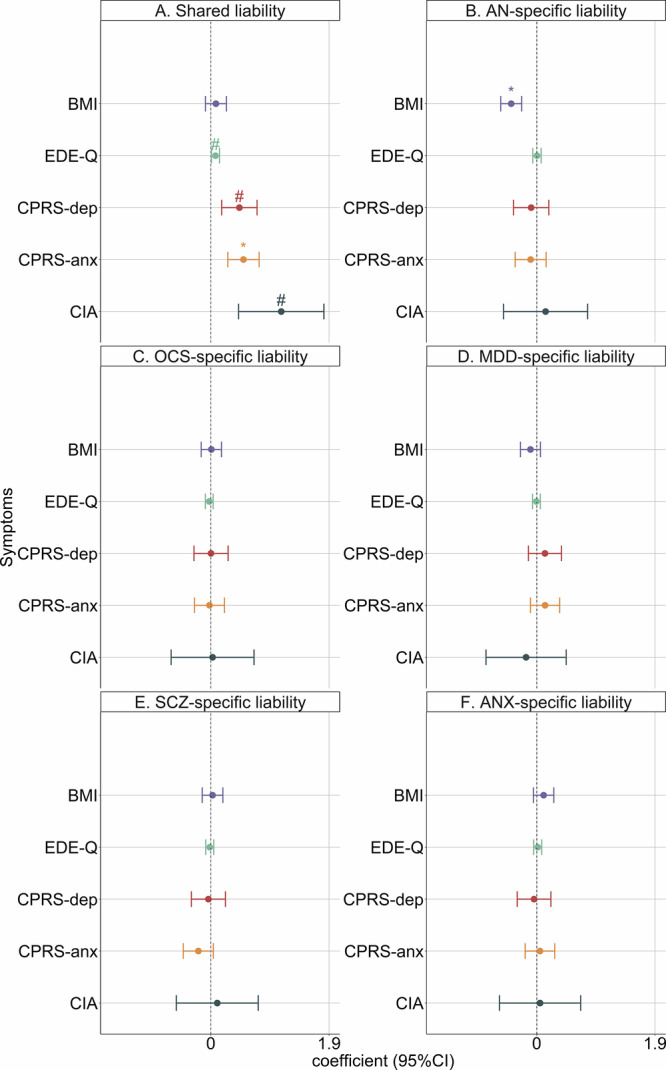 Figure 4
- —https://doi.org/10.13039/501100004359Vetenskapsrådet (Swedish Research Council)
- —Chinese Scholarship Council CSC202206010089
- —https://doi.org/10.13039/100000025U.S. Department of Health & Human Services | NIH | National Institute of Mental Health (NIMH)
- —https://doi.org/10.13039/501100003554Lundbeckfonden (Lundbeck Foundation)
Peer Reviews
No public reviews on file for this paper yet. If you reviewed it on a platform where reviews are public (OpenReview, ICLR, NeurIPS, ICML), you can paste yours below so the community can read it here.
Videos
No videos yet. Explain this paper in a talk, walkthrough, or lecture? Add one.
Taxonomy
TopicsEating Disorders and Behaviors · Autism Spectrum Disorder Research · Obesity, Physical Activity, Diet
Introduction
Anorexia nervosa (AN) is a serious and often chronic psychiatric disorder with significant morbidity and mortality [1]. AN is characterized by very low body weight and an intense fear of gaining weight, with a lifetime prevalence of approximately 1% and a full recovery rate of less than 50% [2, 3]. It is a moderately heritable disorder with a twin-based heritability of 50–70% [4]. The latest genome-wide association study (GWAS) identified 8 genomic loci for AN and showed that 17% of variance in liability to AN is attributable to common genetic variants [5].
AN is highly comorbid with other psychiatric disorders [1]. It commonly co-occurs with obsessive-compulsive disorder (OCD) (14%), major depressive disorder (MDD) (73%) and anxiety disorders (ANX) (75%) and is associated with 6-fold greater risk of having schizophrenia (SCZ) [6–9]. Moreover, some clinical features of AN, such as perfectionism and obsessive exercise, have obsessive and compulsive characteristics [8]. Similarly, distorted perceptions of body shape in AN resemble delusional thinking in SCZ [10].
Phenotypic co-aggregation between AN and other psychiatric disorders can be partially explained by genetic factors, as indicated by their extensive genetic overlap. Notable genetic correlations (rg) based on common variants have been estimated at AN vs. OCD = 0.45, AN vs. MDD = 0.28, AN vs. SCZ = 0.25, and AN vs. ANX = 0.25 [5]. This strong but incomplete overlap indicates the existence of pleiotropic variants influencing multiple disorders as well as variants specific to each disorder.
The clinical course of AN is heterogeneous, with some cases being relatively brief but nearly a third giving way to a severe and enduring profile [1]. Interestingly, we have previously shown that the variance in AN course can be partially explained by genetic liability to other psychiatric disorders: genetic liability to SCZ was associated with distinct phenotypes in AN [11]. Furthermore, the transdiagnostic polygenic risk score (PRS) for AN and OCD demonstrated good performance in predicting the risk of AN [12].
Genomic structural equation modelling (gSEM) is a method to capture the multivariate genetic architecture of genetically correlated traits based on GWAS summary statistics. gSEM is capable of isolating a pleiotropic component representing broad genetic liability in addition to components representing liability specific to each trait. gSEM has been employed to distinguish shared and disorder-specific liability between BIP, MDD, and SCZ; autism spectrum disorder (ASD) and attention-deficit hyperactivity disorder (ADHD); as well as MDD and ANX [13–16]. Individual single nucleotide polymorphisms (SNPs) can be integrated into the gSEM model so that effects of a specific SNP on the shared liability component and trait-specific components can be estimated, allowing the construction of more predictive and valid PRSs [16]. These gSEM-derived PRSs indexing shared and non-shared genetic liabilities to psychiatric disorders can be further utilized to characterize the clinical heterogeneity of a specific disorder [13].
Given the consistently demonstrated symptomatic and genetic overlap between AN and other psychiatric disorders, we used gSEM to extract the shared and specific genetic components of AN and four psychiatric traits with high genetic correlations with AN (obsessive compulsive symptoms [OCS], MDD, SCZ and ANX). We calculated PRSs for these components and tested the associations between these PRSs and AN risk as well as a wide range of clinical outcomes to dissect the heterogeneous outcomes of AN.
Methods
The work flow of the current study is presented in Fig. 1.Fig. 1. Flow chart of the current study.AN anorexia nervosa, SCZ schizophrenia, OCS obsessive-compulsive symptoms, OCD obsessive-compulsive disorder, MDD major depressive disorder, ANX anxiety disorders, gSEM genomic structural equation model, PRS polygenic risk scores, ASD autism spectrum disorder, ADHD attention-deficit hyperactivity disorder, SUD substance use disorder, BMI body mass index, CIA Clinical Impairment Assessment, CPRS Comprehensive Psychopathological Rating Scale, EDE-Q Eating Disorder Examination Questionnaire.
Source GWAS
The source GWAS summary statistics for AN (without ANGI-SE samples, N_cases_ = 4105, N_controls_ = 3793), OCS and SCZ were acquired from the Psychiatric Genomics Consortium (PGC), whereas the GWAS for MDD was derived from a meta-analysis of six European datasets, and the GWAS for ANX was based on the European subset of a multi-ancestry meta-analysis [5, 17–20]. All individuals in the component data sets were of European ancestry. Detailed information on source GWAS studies is available in Table S1.
Target genotype data
The target genotype data were acquired from the Swedish arm of the Anorexia Nervosa Genetics Initiative (ANGI-SE). ANGI is an international collaboration committed to collecting genotype and phenotype data from individuals with AN and controls to identify genetic and environmental risk factors of AN [21]. AN status was determined by a DSM-IV-based AN diagnosis or responses to the ED100K-V1 questionnaire [21]. Details regarding recruitment of participants in ANGI-SE are described in the Supplementary Methods.
In the current study, we included all ANGI-SE individuals with available linkage to Swedish National Registers [21]. The quality control (QC) and imputation of the genotype data were performed according to the RICOPILI pipeline, leaving a total of 4028 cases and 3846 controls [22]. Details regarding genotyping and QC are provided in the Supplementary Methods.
Clinical phenotypes
The data on clinical phenotypes in AN cases were derived from records in Swedish National registers from January 1, 1997 to December 31, 2018, using unique personal identification numbers to link data across registers [23]. We focused on five categories of phenotypes in the current study: (1) clinical diagnoses: general [somatic + psychiatric], somatic and psychiatric; (2) medication prescriptions: general, antipsychotics and antidepressants; (3) inpatient days: any and due to EDs ; (4) psychiatric comorbidities: OCD, SCZ, MDD, ANX, ASD, ADHD, and substance use disorder (SUD); (5) symptomatology of AN at first visit: BMI, Eating Disorder Examination Questionnaire (EDE-Q) score [24], depression subscale score from the Comprehensive Psychopathological Rating Scale (CPRS) [25], anxiety subscale score from the CPRS [25], and Clinical Impairment Assessment (CIA) questionnaire score [26, 27]. Number of clinical diagnoses, medication prescriptions, and inpatient days were defined as cumulative disease burden in the current study.
Data on diagnoses, inpatient days, medication prescriptions, and psychiatric comorbidities were available for all included AN cases, whereas information on AN symptomatology at first visit was only available for 1934 AN cases. Details about the Swedish National Registers that these phenotypes were derived from are described in the Supplementary Methods and Tables S2–S4.
Statistical analyses
GenomicSEM (gSEM)
We used gSEM to construct a common-factor model based on source GWAS datasets and extracted the loading of each SNP on the common factor. We refer to this as the “shared” component, indicating contribution of the SNP to general liability to the five disorders (Fig. S1A and Supplementary Methods). Next, we constructed five models to extract the loading of each SNP on the residual variance from each source GWAS after accounting for the common factor to represent contribution of the SNP to the liability specific to each disorder (Fig. S1B–F and Supplementary Methods). We refer to these as AN-specific, OCS-specific, SCZ-specific, MDD-specific, and ANX-specific effects. gSEM was performed with the R package “GenomicSEM” (“0.0.5”). Code and technical details are available online (https://github.com/GenomicSEM/GenomicSEM/) and in the Supplementary Methods.
Generation of PRSs
We generated PRSs using PRSice software (version 2.3.5) [28]. The target dataset was the genotype data from individuals in ANGI-SE. The base summary statistic datasets were the shared and trait-specific effects from gSEM. We clumped the SNPs at r^2^ < 0.1 within 250 kb and aggregated their effects at different p-value thresholds (5e-8, 1e-6, 1e-4, 0.001,0.01, 0.05, 0.1, 0.2, 0.5, 1) using the PRS-PCA method [29]. The final gSEM-derived PRSs utilized in association analyses were the standardized first components derived from principal component analyses (PCA) of PRSs at all thresholds. We performed PCA and standardization with R functions “princomp()” and “scale()”, respectively. Details for PRSs calculation are presented in Supplementary Methods.
Association analyses for gSEM PRSs with AN status and clinical phenotypes
To investigate the association between gSEM-derived PRSs and AN status, we conducted logistic regression analyses with binary AN status as the outcome in the 4028 AN cases and 3846 controls. Each gSEM-derived PRS was tested as an exposure variable separately. Odds ratios (ORs) represented the risk estimates +1 standard deviation (SD) increase of PRS.
To investigate the impact of gSEM-derived PRSs on the cumulative disease burden of AN cases, we conducted quasi-Poisson regression analyses with number of unique diagnoses (general, somatic, and psychiatric), number of unique medication prescriptions (any, antipsychotics, and antidepressants), and number of inpatient days (any and due to eating disorders) recorded from January 1, 1997 to December 31, 2018 as outcomes among 4028 AN cases. Each gSEM-derived PRS was tested as an exposure variable for association with these eight outcomes separately. We included a log-time offset term in each model to adjust for differences in follow-up time between individuals. Incidence rate ratios (IRRs) represented the risk estimates +1 SD increase of gSEM-derived PRS.
To investigate the impact of gSEM-derived PRSs on risks of psychiatric comorbidities in AN cases, we conducted Cox regression (survival) analyses with age as the underlying timescale and onset of OCD, SCZ, MDD, ANX, ASD, ADHD, and SUD as outcomes among 4028 AN cases. Each gSEM-derived PRS was tested as an exposure variable for association with these seven outcomes separately. Individuals were followed from January 1, 1997 until onset of disorder, death or December 31, 2018, whichever came first. Hazard ratios (HRs) represented the risk estimates +1 SD increase of gSEM-derived PRS.
To investigate the impact of gSEM-derived PRSs on the symptomatology of AN at first visit in AN cases, we performed linear regression analyses with BMI, EDE-Q scores, CIA scores, CPRS-depression and CPRS-anxiety scores as outcomes among 4028 AN cases. Each gSEM-derived PRS was tested as an exposure variable for association with these five outcomes separately. Regression coefficients represented change in symptoms +1 SD increase of gSEM-derived PRS.
All association analyses were performed in R version 4.2.3. In all regression models, we adjusted for birth year, sex, and the first 10 ancestry-informative principal components. The significance level in all association analyses above was set at two-sided P < 0.05. To correct for multiple tests, we also employed a Bonferroni-corrected significance level of two-sided P < 0.05/6 = 8.33 × 10^−3^ for association tests with AN status and two-sided P < 0.05/120 = 4.17 × 10^−4^ for association tests with clinical outcomes of AN. Details regarding the regression models are presented in the Supplementary Methods and Table S5.
Results
Descriptive characteristics of the study population
Of the 4028 AN cases in ANGI-SE, the mean (SD) birth year was 1985 (9), and 3947 (98.0%) were female, whereas among the 3846 controls, the mean (SD) birth year was 1978 (10), and 3776 (98.2%) were female. The descriptive characteristics of the 4028 individuals with AN are presented in Table S6.
Association between gSEM-derived PRSs and AN status
Only PRS_AN-specific_ and PRS_shared_ were associated with statistically significant increased risk of AN, whereas other gSEM-derived PRSs showed either statistically non-significant or decreased risk of AN after Bonferroni correction (Table 1). In contrast, all unmodified source GWAS PRSs were associated with an elevated risk of AN (Table S7).Table 1. Association between gSEM-derived polygenic risk scores (PRS) and odds of anorexia nervosa (AN) from logistic regression analyses.PRSOdds ratio (95% confidence interval)P valuePRS_shared_1.33 (1.27–1.40)6.21 × 10^−28^ *****PRS_AN-specific_1.33 (1.26–1.40)3.32 × 10^−28^ *****PRS_OCS-specific_1.03 (0.98–1.08)1.97 × 10^−1^PRS_SCZ-specific_1.06 (1.01–1.11)2.41 × 10^−2 #^PRS_MDD-specific_0.99 (0.95–1.04)8.04 × 10^−1^PRS_ANX-specific_0.88 (0.84–0.92)3.85 × 10^−7^*****Results were derived from logistic regression models with AN status as the outcome variable. We constructed six models with PRS_shared_, PRS_AN-specific_, PRS_OCS-specific_, PRS_MDD-specific_, PRS_SCZ-specific_ and PRS_ANX-specific_ as the exposure variable, respectively. The analyses were based on 7874 individuals from ANGI-SE (4028 cases and 3846 controls) adjusting for birth year, sex and first 10 ancestry-informative principal components. Odds ratios represent the risk estimates per one standard deviation increase of gSEM-derived PRS. The Bonferroni-corrected significance level was set at P < 0.05/6 = 8.33 × 10^−3^.“*” represents association that remained significant after Bonferroni correction.“#” represents trending association at P < 0.05 but was not significant after Bonferroni correction.gSEM genomic structural equation model, AN anorexia nervosa, SCZ schizophrenia, OCS obsessive-compulsive symptoms, MDD major depressive disorder, ANX anxiety disorders.
Association between gSEM-derived PRSs and cumulative disease burden
PRS_shared_ was associated with a higher risk for cumulative disease burden (Fig. 2A; Table S8): +1 SD increase in PRS_shared_ was associated with receiving 12% (IRR, 1.12 95%CI, 1.09–1.15; P = 1.82 × 10^−18^) more general diagnoses, 16% (IRR, 1.16; 95%CI, 1.12–1.21; P = 5.46 × 10^−16^) more psychiatric diagnoses and 9% more somatic diagnoses (IRR, 1.09; 95%CI, 1.06–1.13; P = 7.01 × 10^−8^) at P < 0.05. For medication prescriptions, +1 SD increase in PRS_shared_ was associated with 12% (IRR, 1.12; 95%CI, 1.09–1.15; P = 1.80 × 10^−18^) more general prescriptions, 27% (IRR, 1.27; 95%CI. 1.17–1.38; P = 8.06 × 10^−9^) more antipsychotic prescriptions, and 15% (IRR, 1.15; 95%CI, 1.11–1.20; P = 3.78 × 10^−15^) more antidepressant prescriptions at P < 0.05. PRS_shared_ was also associated with having more inpatient days due to any illness (IRR, 1.19; 95%CI, 1.08–1.32; P = 5.79 × 10^−4^) at P < 0.05. After Bonferroni correction, all these associations remained significant except for the association with inpatient days.Fig. 2. Association between transdiagnostic genetic liabilities and cumulative disease burden from the quasi-Possion models.Results are derived from quasi-Possion regression models based on 4028 AN cases with number of unique clinical diagnoses (any, psychiatric, somatic), prescriptions (any, antipsychotics, antidepressants) and inpatient days (any, due to EDs) as outcomes. For each of the eight outcomes, we constructed six models with PRS_shared_ (A), PRS_AN-specific_ (B), PRS_OCS-specific_ (C), PRS_MDD-specific_ (D), PRS_SCZ-specific_ (E) and PRS_ANX-specific_ (F) as exposure variable, respectively. Incidence rate ratios indicate the risk estimates for +1 SD increase of PRS. Sex, birth year and first 10 ancestry-informative principal components were adjusted for in all models. The points represent incidence rate ratio estimates, and the error bars indicate 95% confidence intervals. Blue points represent effect estimates for clinical diagnoses, red points represent effects for medication prescriptions and yellow points represent effects for inpatient days. “*” represents association that remained significant after Bonferroni correction. “#” represents trending association at P < 0.05 but was not significant after Bonferroni correction. PRS polygenic risk scores, EDs eating disorders, IRR incidence rate ratio, 95%CI 95% confidence interval, AN anorexia nervosa, SCZ schizophrenia, OCS obsessive-compulsive symptoms, MDD major depressive disorder, ANX anxiety disorders.
PRS_AN-specific_ was not statistically significantly associated with most cumulative disease burden outcomes at P < 0.05 (Fig. 2B; Table S8), except for a 17% increased risk of inpatient days due to EDs (IRR, 1.17; 95%CI, 1.04–1.32; P = 9.75 × 10^−3^). However, it became non-significant after Bonferroni correction. No statistically significant association was detected between PRS_OCS-specific_ and cumulative disease burden at P < 0.05 (Fig. 2C; Table S8).
PRS_MDD-specific_ was associated with generally elevated risk for cumulative disease burden (Fig. 2D; Table S8): +1 SD increase in PRS_MDD-specific_ was associated with receiving 3% more general diagnoses (IRR, 1.03; 95%CI, 1.01–1.06; P = 7.58 × 10^−3^) and 7% more psychiatric diagnoses (IRR, 1.07; 95%CI, 1.03–1.11; P = 1.87 × 10^−4^), 6% more general prescriptions (IRR, 1.06; 95%CI, 1.03–1.08; P = 6.85 × 10^−6^), 14% more antipsychotic prescriptions (IRR, 1.14; 95%CI, 1.06–1.24; P = 5.43 × 10^−4^) and 9% more antidepressant prescriptions (IRR, 1.09; 95%CI, 1.05–1.13; P = 6.63 × 10^−7^) as well as 15% more inpatient days (IRR, 1.15; 95%CI, 1.04–1.26; P = 5.31 × 10^−3^) at P < 0.05. Only the associations with psychiatric diagnoses, any prescriptions and antidepressant prescriptions survived the Bonferroni correction.
PRS_SCZ-specific_ and PRS_ANX-specific_ were generally associated with a lower risk for cumulative disease burden, but neither was statistically significant after Bonferroni correction (Fig. 2E, F; Table S8).
Association between gSEM-derived PRSs and risk of psychiatric comorbidities
Increased PRS_shared_ was associated with increased risk of all psychiatric comorbidities at P < 0.05, with effect sizes ranging from +14–+58% excess risk (Fig. 3A; Table S9). Increased PRS_MDD-specific_ was associated with elevated risks for ADHD, ANX, ASD, MDD and SUD at P < 0.05 (Fig. 3D; Table S9). Most associations did not withstand Bonferroni correction, except for the associations for PRS_shared_ with ADHD, ANX, MDD and SUD as well as the one between PRS_MDD-specific_ and ANX (Fig. 3; Table S9).Fig. 3. Association between transdiagnostic genetic liabilities and psychiatric comorbidities from the Cox regression models.Results are derived from quasi-Possion regression models based on 4028 AN cases with ADHD, ANX, ASD, MDD, OCD, SCZ and SUD as the outcome variables. For each of the seven outcomes, we constructed six models with PRS_shared_ (A), PRS_AN-specific_ (B), PRS_OCS-specific_ (C), PRS_MDD-specific_ (D), PRS_SCZ-specific_ (E) and PRS_ANX-specific_ (F) as exposure variable, respectively. Incidence rate ratios indicate the risk estimates for +1 SD increase of PRS. Sex, birth year and first 10 ancestry-informative principal components were adjusted for in all models. The points represent hazard ratio estimates, and the error bars indicate 95% confidence intervals. “*” represents association that remained significant after Bonferroni correction. “#” represents trending association at P < 0.05 but was not significant after Bonferroni correction. PRS polygenic risk scores, AN anorexia nervosa, OCS obsessive-compulsive symptoms, OCD obsessive-compulsive disorder, SCZ schizophrenia, MDD major depressive disorder, ANX anxiety disorders, ASD autism spectrum disorder, ADHD attention-deficit hyperactivity disorder, SUD substance use disorder.
Association between gSEM-derived PRSs and AN symptomatology at first clinical visit
PRS_shared_ was associated with more severe ED symptoms (regression coefficient, 0.07; 95%CI, 0.01–0.14; P = 0.03), greater clinical impairment (regression coefficient, 1.13; 95%CI, 0.45–1.82; P = 1.25 × 10^−3^), greater self-reported anxiety (regression coefficient, 0.52; 95%CI, 0.27–0.77; P = 4.43 × 10^−5^) and depression (regression coefficient, 0.46; 95%CI, 0.17–0.74; P = 1.71 × 10^−3^) at P < 0.05 (Fig. 4A; Table S10). Statistically significant associations were also observed between PRS_AN-specific_ and lower BMI (regression coefficient, −0.41; 95%CI, −0.58–−0.24; P = 1.78 × 10^−6^) at P < 0.05 (Fig. 4B; Table S10). After correction, only the associations for PRS_shared_ with self-reported anxiety symptoms and PRS_AN-specific_ with lower BMI remained significant.Fig. 4. Association between transdiagnostic genetic liabilities and AN symptomatology from the linear regression models.Results are derived from linear regression models with BMI, EDE-Q score, CPRS-depression score, CPRS-anxiety score and CIA score as the outcome variables. The analyses were based on 1934 ANGI-SE AN cases with available data on symptomatology in Stepwise Quality Register. For each of the five outcomes, we constructed six models with PRS_shared_ (A), PRS_AN-specific_ (B), PRS_OCS-specific_ (C), PRS_MDD-specific_ (D), PRS_SCZ-specific_ (E) and PRS_ANX-specific_ (F) as the exposure variable, respectively. Regression coefficients indicate the risk estimates for +1 SD increase of PRS. Sex, birth year and first 10 ancestry-informative principal components were adjusted for in all models. The points represent regression coefficients, and the error bars indicate 95% confidence intervals. “*” represents association that remained significant after Bonferroni correction. “#” represents trending association at P < 0.05 but was not significant after Bonferroni correction. PRS polygenic risk scores, AN anorexia nervosa, OCS obsessive-compulsive symptoms, SCZ schizophrenia, MDD major depressive disorder, ANX anxiety disorders, BMI body mass index, CIA Clinical Impairment Assessment, CPRS Comprehensive Psychopathological Rating Scale, CPRS-dep CPRS-depression score, CPRS-anx CPRS-anxiety score, EDE-Q Eating Disorder Examination Questionnaire.
Discussion
This study is the first to leverage transdiagnostic psychiatric genetic liability to dissect the clinical heterogeneity of AN so far. We found that shared psychiatric genetic liability was a consistent predictor of disease burden, risk of psychiatric comorbidity and clinical impairment within AN, whereas AN-specific liability was not a good indicator of its clinical course. These findings provide a novel perspective on the heterogeneous etiology and clinical course of AN.
We observed that only AN-specific liability and shared liability were associated with an elevated AN risk. However, all other gSEM-derived trait-specific PRSs were associated with either a statistically non-significant or reduced risk of AN. This offers a completely different perspective on AN etiology compared to the consistently positive relationships between unmodified single-disorder PRSs and AN risk. Since the single-disorder PRSs can capture both shared and trait-specific genetic factors, their associations with increased AN risk might be attributed to the shared psychiatric genetic component. These findings suggest that both general psychiatric and AN-specific genetic factors are underlying the onset of AN.
Shared psychiatric liability was associated with greater cumulative disease burden, elevated risks of psychiatric comorbidities and more severe symptoms and clinical impairment in AN. The findings are consistent with previous studies revealing a positive association between family history of SCZ and AN disease burden, as well as between OCD-AN shared liability and AN symptoms [11, 12]. According to the “p factor” theory, there are shared psychopathological mechanisms underlying multiple psychiatric disorders which could be captured by a common latent factor [30]. The positive association between shared liability and psychiatric disease burden in AN offers biological evidence for the “p-factor” in this population. Furthermore, we shed new light on the genetic underpinnings of this “p-factor” by revealing the relationship between shared liability and other clinical outcomes (i.e. more somatic diagnoses, more medication prescriptions, more inpatient days, more severe symptoms and clinical impairment) in AN.
AN-specific liability did not show statistically significant associations with most of the clinical features in AN. It is interesting that AN-specific liability was a predictor for AN status as expected, but not for its clinical outcomes, suggesting that distinct genetic mechanisms may underlie the onset and prognosis of AN. However, its associations with lower BMI and more inpatient days due to EDs suggest a potential role of AN-specific liability as a predictor for AN-specific symptoms and severity, which is consistent with a previous study revealing that AN PRS showed better performance in predicting ED severity compared to a cross-disorder PRS [12]. Given the low heritability of AN-specific genetic effects (Table S11), the analyses should be replicated when larger GWASs emerge.
MDD-specific liability was associated with greater disease burden within AN. Early-life depression has previously been found to be associated with an increased risk of somatic conditions, possibly due to shared inflammatory or metabolic mechanisms [31–34]. Moreover, genetic overlap has been observed between MDD and endocrine disorders, obesity, and inflammatory cytokines [33, 35–38]. The association between MDD-specific genetic risk and poor health status in AN might be mediated by these biological mechanisms. Our findings should be interpreted with caution given the low heritability of disorder-specific genetic effects and still growing sample sizes of source GWASs.
Limitations
Our study has several limitations. Firstly, the source GWAS for AN has relatively small sample size, and the GWAS for OCS is based on self-reported obsessive compulsive symptoms, so our analyses should be replicated when larger and diagnosis-based GWASs for AN and OCD respectively are available. Secondly, although our gSEM model fit was good and we showed that the gSEM-derived components had acceptable validity in our study population (Supplementary Results, Table S12), the results for ANX-specific liability should be interpreted with caution since the correlation between PRS_ANX-specific_ and PRS_ANX_ was not strong (Supplementary Results, Table S13 and Fig. S2). Moreover, data on AN symptoms were missing for a considerable proportion of participants and were measured by self-report questionnaires which might lead to underestimates due to subjective denial of symptoms [39]. Given the limited follow-up time, our data might not cover first diagnoses of some psychiatric comorbidities with an early onset age, such as ADHD and ASD. Finally, effects from rare variants and structural variations were not considered in the current study.
Conclusions
Our findings show that shared instead of AN-specific liability was a strong predictor for adverse outcomes of AN, suggesting that genetic risk profiles for AN diagnosis may be distinct from those for AN outcomes. We provide a novel perspective on the heterogenous clinical outcomes within AN by identifying clinically relevant genetic components.
Supplementary information
Supplementary materials