Microvesicles derived from bone marrow and peripheral blood can reflect tumor load in multiple myeloma
Nanhao Meng, Zhaoyun Liu, Yan Shi, Chun Yang, Hao Wang, Yanran Luo, Hui Liu, Kai Ding, Fengjuan Jiang, Fengping Peng, Rong Fu

Abstract
Genes, proteins, chemicals, diseases, species, mutations and cell lines named across the full text — each resolved to its canonical identifier and authoritative record.
Click any figure to enlarge with its caption.
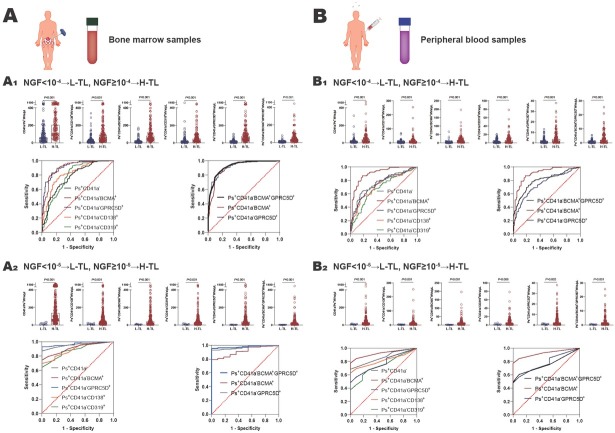 Figure 1
| Optimal | ||||||
|---|---|---|---|---|---|---|
| Group | AUC (95%CI) | Cut off points, μL | Sensitivity, % (95%CI) | Specificity, % (95%CI) | ||
| < 10-4
| CD41a-Ps+ | 0.7733 (0.7210-0.8255) | < 0.001 | 134.3 | 66.67 (59.37–73.24) | 75.18 (67.33–81.66) |
| Ps+CD41a-CD138+ | 0.8222 (0.7757-0.8688) | < 0.001 | 35.55 | 78.74 (72.07–84.16) | 75.18 (67.33–81.66) | |
| Ps+CD41a-BCMA+ | 0.9054 (0.8712-0.9396) | < 0.001 | 30.09 | 83.24 (76.96–88.07) | 86.13 (79.35–90.94) | |
| Ps+CD41a-CD319+ | 0.7812 (0.7277-0.8346) | < 0.001 | 13.90 | 93.10 (88.33–96.01) | 56.93 (48.57–64.93) | |
| Ps+CD41a-GPRC5D+ | 0.9159 (0.8852-0.9467) | < 0.001 | 21.18 | 89.66 (84.24–93.36) | 78.83 (71.25–84.84) | |
| Ps+CD41a-BCMA+GPRC5D+ | 0.9248 (0.8960-0.9536) | < 0.001 | 17.16 | 80.46 (73.79–85.67) | 90.51 (84.44–94.37) | |
| < 10-5
| CD41a-Ps+ | 0.9691 (0.9448-0.9933) | < 0.001 | 30.83 | 89.67 (85.71–92.62) | 63.64 (35.38–84.83) |
| Ps+CD41a-CD138+ | 0.8855 (0.8249-0.9460) | < 0.001 | 20.85 | 73.33 (68.06–78.02) | 81.82 (52.30–96.77) | |
| Ps+CD41a-BCMA+ | 0.9133 (0.8643-0.9624) | < 0.001 | 10.50 | 79.00 (74.04–82.23) | 90.90 (60.20–98.30) | |
| Ps+CD41a-CD319+ | 0.8818 (0.8179-0.9457) | < 0.001 | 16.81 | 68.00 (62.52–73.02) | 72.73 (43.44–90.25) | |
| Ps+CD41a-GPRC5D+ | 0.9715 (0.9507-0.9923) | < 0.001 | 1.840 | 93.00 (89.54–95.38) | 90.91 (62.26–99.53) | |
| Ps+CD41a-BCMA+GPRC5D+ | 0.9800 (0.9646-0.9954) | < 0.001 | 1.005 | 95.67 (92.73–97.45) | 90.91 (62.26–99.53) | |
| < 10-4
| CD41a-Ps+ | 0.7564 (0.6954-0.8175) | < 0.001 | 25.78 | 64.89 (56.39–72.53) | 81.08 (72.80–87.28) |
| Ps+CD41a-CD138+ | 0.7242 (0.6605-0.7880) | <0.001 | 10.23 | 52.67 (44.17–61.02) | 84.68 (76.84–90.21) | |
| Ps+CD41a-BCMA+ | 0.9015 (0.8620-0.9409) | < 0.001 | 4.570 | 87.20 (80.20–91.74) | 81.98 (73.80–88.02) | |
| Ps+CD41a-CD319+ | 0.6855 (0.6185-0.7525) | < 0.001 | 3.640 | 64.12 (55.61–71.83) | 69.37 (60.27–77.18) | |
| Ps+CD41a-GPRC5D+ | 0.7470 (0.6857-0.8082) | < 0.001 | 2.150 | 64.89 (56.39–72.53) | 74.77 (65.96–81.93) | |
| Ps+CD41a-BCMA+GPRC5D+ | 0.7961 (0.7400-0.8521) | < 0.001 | 0.985 | 72.52 (64.32–79.77) | 77.48 (68.86–84.25) | |
| < 10-5
| CD41a-Ps+ | 0.8617 (0.7889-0.9344) | < 0.001 | 12.66 | 70.13 (63.94–75.66) | 72.73 (43.44–90.25) |
| Ps+CD41a-CD138+ | 0.8245 (0.7583-0.8907) | < 0.001 | 3.430 | 65.37 (59.03–71.21) | 81.82 (62.26–99.53) | |
| Ps+CD41a-BCMA+ | 0.9282 (0.8876-0.9687) | < 0.001 | 3.415 | 65.37 (59.03–71.21) | 84.85 (74.12–99.00) | |
| Ps+CD41a-CD319+ | 0.7320 (0.6295-0.8345) | 0.009 | 5.005 | 43.72 (37.48–50.17) | 63.64 (43.44–84.83) | |
| Ps+CD41a-GPRC5D+ | 0.7719 (0.6772-0.8667) | 0.002 | 1.560 | 55.41 (48.96–61.68) | 81.82 (52.30–96.77) | |
| Ps+CD41a-BCMA+GPRC5D+ | 0.7757 (0.6901-0.8613) | 0.002 | 0.725 | 58.87 (52.43–65.02) | 99.91 (74.12–99.53) | |
Peer Reviews
No public reviews on file for this paper yet. If you reviewed it on a platform where reviews are public (OpenReview, ICLR, NeurIPS, ICML), you can paste yours below so the community can read it here.
Videos
No videos yet. Explain this paper in a talk, walkthrough, or lecture? Add one.
Taxonomy
TopicsExtracellular vesicles in disease · Multiple Myeloma Research and Treatments · Caveolin-1 and cellular processes
To the editor
Multiple myeloma (MM) is a malignant tumor of plasma cells that cannot be completely cured. Although the development of revolutionary immunotherapies has dramatically improved outcomes of MM patients,^[1]^ the residual tumor load often leads to relapse in patients who have achieved complete response (CR).^[2]^ Currently, the multicolor flow cytometry and next-generation sequencing are mainly used to monitor MM tumor load in clinical practice, in particular, the EuroFlow consortium has developed a highly sensitive and fully standardized approach using the next-generation flow (NGF).^[3]^ However, due to the focal distribution of myeloma cells in the bone marrow cavity, these existing methods may show false-negative test results.^[3]^ To address this possible false negative situation, we tried to use circulating microvesicles to reflect MM tumor load. In previous studies, we have found that the microvesicles derived from MM cells in the bone marrow can reflect MM tumor load.^[4]^ Furthermore, this was the first study to explore paired bone marrow and peripheral blood samples and the first one to investigate the value of GPRC5D and BCMA double-positive microvesicles in monitoring MM tumor load.
This study included 311 MM patients (Supplementary Table S1) with tumor load assessed by NGF, and whose clinical efficacies were evaluated as CR. Patients were grouped into a high tumor load (H-TL) and a low tumor load (L-TL) group based on NGF test results at a threshold of 10^-4^ or 10^-5^.^[5,6]^ Bone marrow and remaining peripheral blood samples were collected after clinical examination. The microvesicles were obtained through ultracentrifugation and labeled myeloma cell-derived microvesicles with the characteristic myeloma markers GPRC5D, BCMA, CD138, and CD319. The number of microvesicles was detected by flow-cytometry, as described in detail in our previous study^[4]^ (Supplementary Material S1, Supplementary Material S2). The differences in the numbers of microvesicles were compared between the L-TL and H-TL groups and the ROC curve analysis was performed on microvesicles to distinguish H-TL patients from L-TL patients.
For bone marrow samples: when 10^-4^ was used as the threshold, the numbers of CD41a^-^Phosphatidylserine^+^(Ps^+^), Ps^+^CD41a^−^CD138^+^, Ps^+^CD41a^−^BCMA^+^, Ps^+^CD41a^−^CD319^+^, and Ps^+^CD41a^−^ GPRC5D^+^microvesicles were all higher in the H-TL group (n = 174) than the L-TL group (n = 137) (P < 0.001) (Figure 1A-A1 and Supplementary Table S2). Then, ROC curves were performed on bone marrow microvesicles labeled with Ps^+^CD41a^−^CD138^+^, Ps^+^CD41a^−^BCMA^+^, Ps^+^CD41a^−^CD319^+^, Ps^+^CD41a^−^GPRC5D^+^ to distinguish H-TL patients from L-TL patients. The AUC of these microvesicles were 0.8222, 0.9054, 0.7812, 0.9159 (P < 0.001), with sensitivities of 78.74%, 83.24%, 93.10%, 89.66%, and specificities of 75.18%, 86.13%, 56.93%, 78.83%, respectively (Figure 1A-A1 and Table 1). It suggested that BCMA and GPRC5D-positive microvesicles can reflect MM tumor load well in bone marrow (AUC > 0.9).
The value of microvesicles in bone marrow and peripheral blood in monitoring MM tumor load. A Bone marrow samples: A1 NGF = 10-4 as the threshold, the number of MM cell-derived microvesicles from bone marrow was significantly higher in H-TL group compared with in L-TL group, and the ROC curves were analyzed Ps+CD41a−, Ps+CD41a−CD138+, Ps+CD41a−BCMA+, Ps+CD41a−CD319+, Ps+CD41a−GPRC5D+, and Ps+CD41a−BCMA+GPRC5D+microvesicles from bone marrow to distinguish the H-TL patients from L-TL patients; A2 NGF = 10-5 as the threshold, the number of MM cell-derived microvesicles from bone marrow was significantly higher in H-TL group compared with in L-TL group, and the ROC curves were analyzed Ps+CD41a−, Ps+CD41a−CD138+, Ps+CD41a−BCMA+, Ps+CD41a−CD319+, Ps+CD41a−GPRC5D+, and Ps+CD41a−BCMA+GPRC5D+microvesicles from bone marrow to distinguish the H-TL patients from L-TL patients. B Peripheral blood samples: B1 NGF=10-4 as the threshold, the number of MM cell-derived microvesicles from peripheral blood was significantly higher in H-TL group compared with in L-TL group, and the ROC curves were analyzed Ps+CD41a−, Ps+CD41a−CD138+, Ps+CD41a−BCMA+, Ps+CD41a−CD319+, Ps+CD41a− GPRC5D+, and Ps+CD41a−BCMA+GPRC5D+microvesicles from peripheral blood to distinguish the H-TL patients from L-TL patients; B2 NGF=10-5 as the threshold, the number of MM cell-derived microvesicles from peripheral blood was significantly higher in H-TL group compared with in L-TL group, and the ROC curves were analyzed Ps+CD41a−, Ps+CD41a−CD138+, Ps+CD41a−BCMA+, Ps+CD41a−CD319+, Ps+CD41a−GPRC5D+, and Ps+CD41a−BCMA+GPRC5D+microvesicles from peripheral blood to distinguish the H-TL patients from L-TL patients. NGF: next-generation flow; L-TL: low tumor load; H-TL: high tumor load; MVs: microvesicles; Ps: phosphatidylserine; AUC: area under the curve.
In our previous study, we found the double-positive microvesicles (such as Ps^+^CD41a^−^ CD138^+^BCMA^+^microvesicles) were less valuable in monitoring MM tumor load than single-positive microvesicles (such as Ps^+^CD41a^−^CD138^+^ and Ps^+^CD41a^−^ BCMA^+^). This is mainly because the number of double-positive microvesicles extremely reduced.^[4]^ However, the expression of GPRC5D and BCMA in myeloma are mutually exclusive.^[5,7]^ Thus, we explored whether Ps^+^CD41a^−^ BCMA^+^GPRC5D^+^microvesicles could be a better marker. The AUC of Ps^+^CD41a^−^BCMA^+^GPRC5D^+^microvesicles was 0.9248, with sensitivity of 80.46% and specificity of 90.51% (Figure 1A-A1, Table 1). It suggested that the number of Ps^+^CD41a^−^BCMA^+^GPRC5D^+^microvesicles in bone marrow is a better marker of MM tumor load (AUC value maximum). Mechanistically, we inferred that during vesicle formation, BCMA-positive microvesicles and GPRC5D-positive microvesicles may be more likely to fuse with each other, although the expression of BCMA and GPRC5D in myeloma cells are mutually exclusive. Therefore, the mutually exclusive expression on cells may lead to dual-positive microvesicles representing a broader tumor subpopulation. Of course, this hypothesis requires further research to confirm in the future.
When 10^-5^ was used as the threshold, the numbers of Ps^+^CD41a^-^, Ps^+^CD41a^−^CD138^+^, Ps^+^CD41a^−^BCMA^+^, Ps^+^CD41a^−^CD319^+^, Ps^+^CD41a^−^GPRC5D^+^ and Ps^+^CD41a^−^ BCMA^+^GPRC5D^+^microvesicles were all higher in H-TL group (n = 300) than L-TL group (n = 11)(P < 0.001) (Figure 1A-A2, Supplementary Table S2). And the AUC of these microvesicles were 0.8855, 0.9133, 0.8818, 0.9715, 0.9800 (P < 0.001), with sensitivities of 73.33%, 79.00%, 68.00%, 93.00%, 95.67%, and specificities of 81.82%, 90.90%, 72.73%, 90.91%, 90.91%, respectively (Figure 1A-A2, Table 1).
For peripheral blood samples: when NGF = 10^-4^ was used as the threshold, the numbers of CD41a^−^Ps^+^, Ps^+^CD41a^−^CD138^+^, Ps^+^CD41a^−^BCMA^+^, Ps^+^CD41a^−^ CD319^+^, Ps^+^CD41a^−^GPRC5D^+^ and Ps^+^CD41a^−^ BCMA^+^GPRC5D^+^microvesicles were all higher in H-TL group (n = 111) than L-TL group (n = 131) (P < 0.001) (Figure 1B-B1, Supplementary Table S2). The AUC of these microvesicles were 0.7242, 0.9015, 0.6855, 0.7470, 0.7961 (P < 0.001), with sensitivities of 52.67%, 87.20%, 64.12%, 64.89%, 75.52%, and specificities of 84.68%, 81.98%, 69.37%, 74.77%, 77.48%, respectively (Figure 1B-B1, Table 1). When NGF = 10^-5^ was used as the threshold. The numbers of these microvesicles were also significantly higher in H-TL group (n = 111) than in L-TL group (n = 131) (P < 0.01) (Figure 1B-B1, Supplementary Table S2). And the AUC of these microvesicles were 0.8245, 0.9282, 0.7320, 0.7719, 0.7757 (P < 0.01), with sensitivities of 65.37%, 65.37%, 43.72%, 55.41%, 58.87%, and specificities of 81.82%, 84.85%, 63.64%, 81.82%, 99.91%, respectively (Figure 1B-B2, Table 1). We noticed that the lower AUC score for peripheral blood MVs compared to that for bone marrow, which suggested that peripheral blood may be less reliable. We believed it may be related to the dilution effect of peripheral blood relative to bone marrow, the half-life of microvesicles, and the depletion of microvesicles in peripheral blood samples during storage.
In conclusion, the number of microvesicles in both bone marrow samples and peripheral blood samples can reflect MM tumor load and serve as a useful complement to existing tumor load monitoring methods to compensate for false negatives. Specifically, when using bone marrow samples, the selection of Ps^+^CD41a^−^BCMA^+^, Ps^+^CD41a^−^GPRC5D^+^, and Ps^+^CD41a^−^BCMA^+^GPRC5D^+^ microvesicles were all effective in reflecting tumor load, with AUC above 0.9, and Ps^+^CD41a^−^BCMA^+^GPRC5D^+^microvesicles were the most effective, with AUC maximum; when using peripheral blood samples, the selection of Ps^+^CD41a^−^BCMA^+^microvesicles can reflect the tumor load better, with AUC above 0.9. It appears that BCMA can be used as an effective member in bone marrow and peripheral blood samples, but GPRC5D combined BCMA can be more effective than BCMA alone in bone marrow. The underlying mechanisms still need further study. However, the current results are only based on the single center data. It is crucial to establish a standard system. We hope to conduct further research using data from multiple centers, and to follow up over a longer period. Furthermore, clear standards need to be established for sample collection, storage, preparation, and flow cytometry monitoring strategies, all these standards should be validated across multiple laboratories. These will facilitate the clinical application of this technology. To create a standard system for microvesicle detection can more usefully promote the monitoring of MM tumor load in the future.
Supplementary Material
Supplementary Material Details
The reference list from the paper itself. Each links out to its DOI / PubMed record.
- 1Malard F Neri P Bahlis NJ Terpos E Moukalled N Hungria VTM et al Nat Rev Dis Primers 202410453893749210.1038/s 41572-024-00529-7 · doi ↗ · pubmed ↗
- 2Barlogie B Crowley J Could CR mean cure?Blood 20111184832177834510.1182/blood-2011-05-350322 · doi ↗ · pubmed ↗
- 3Medina A Puig N Flores-Montero J Jimenez C Sarasquete ME Garcia-Alvarez M et al Comparison of next-generation sequencing (NGS) and next-generation flow (NGF) for minimal residual disease (MRD) assessment in multiple myeloma Blood Cancer J 2020101083312789110.1038/s 41408-020-00377-0PMC 7603393 · doi ↗ · pubmed ↗
- 4Liu ZY Meng NH Cao PP Peng FP Luo JY Wang H et al Detection of myeloma cell-derived microvesicles: a tool to monitor multiple myeloma load Exp Hematol Oncol 202312263687930210.1186/s 40164-023-00392-4PMC 9987071 · doi ↗ · pubmed ↗
- 5Takamatsu H Clinical value of measurable residual disease testing for multiple myeloma and implementation in Japan Int J Hematol 2020111519-5293203467110.1007/s 12185-020-02828-7 · doi ↗ · pubmed ↗
- 6Hedley BD Keeney M Technical issues: flow cytometry and rare event analysis Int J Lab Hematol 201335344-3502359066110.1111/ijlh.12068 · doi ↗ · pubmed ↗
- 7Lee H Ahn S Maity R Leblay N Ziccheddu B Truger M et al Mechanisms of antigen escape from BCMA- or GPRC 5D-targeted immunotherapies in multiple myeloma Nat Med 2023292295-23063765334410.1038/s 41591-023-02491-5PMC 10504087 · doi ↗ · pubmed ↗