Mixed Support for the Temperature‐Size Rule in Wild Freshwater Fishes
George C. Brooks, Paul N. Frater, Olaf P. Jensen, Gretchen J. A. Hansen, Craig Paukert, Michael Verhoeven, Lyndsie Wszola, Luoliang Xu, Zachary S. Feiner

TL;DR
This study examines how temperature affects the growth and size of wild freshwater fish, finding mixed support for the temperature-size rule.
Contribution
The study provides a comprehensive analysis of the temperature-size rule using a large dataset of fish from thousands of lakes.
Findings
No species fully conforms to the temperature-size rule.
Warmer environments are linked to faster life histories and shorter lifespans.
Faster growth in warm environments rarely results in smaller maximum body sizes.
Abstract
The temperature‐size rule states that species living in warmer temperatures will grow faster and mature earlier at smaller sizes. While several studies have documented patterns in average body size consistent with the temperature‐size rule in wild populations, a comprehensive test is lacking. Here, we use age and length data of 1.4 million fish across 7 species from 2704 lakes to quantify temperature‐related variation in growth across ontogeny. Our results show that no species fully conforms to the temperature‐size rule; despite patterns of juvenile growth rate and age at maturity typically aligning with the temperature‐size rule, these changes seldom translate to reduced size at maturity or maximum size. We also found evidence that faster life histories in warmer environments are associated with reduced lifespans. A deeper understanding of how temperature shapes growth in natural…
Genes, proteins, chemicals, diseases, species, mutations and cell lines named across the full text — each resolved to its canonical identifier and authoritative record.
Click any figure to enlarge with its caption.
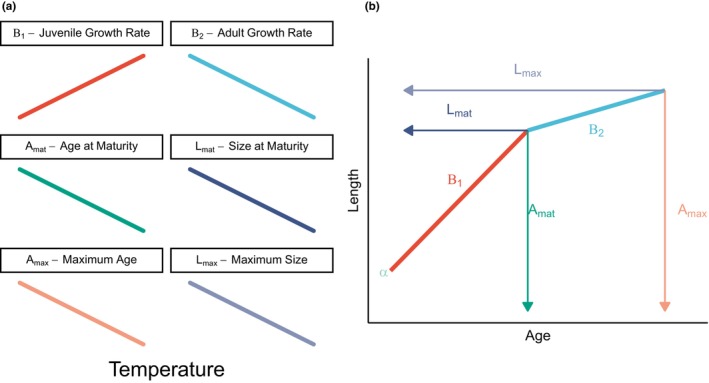 FIGURE 1
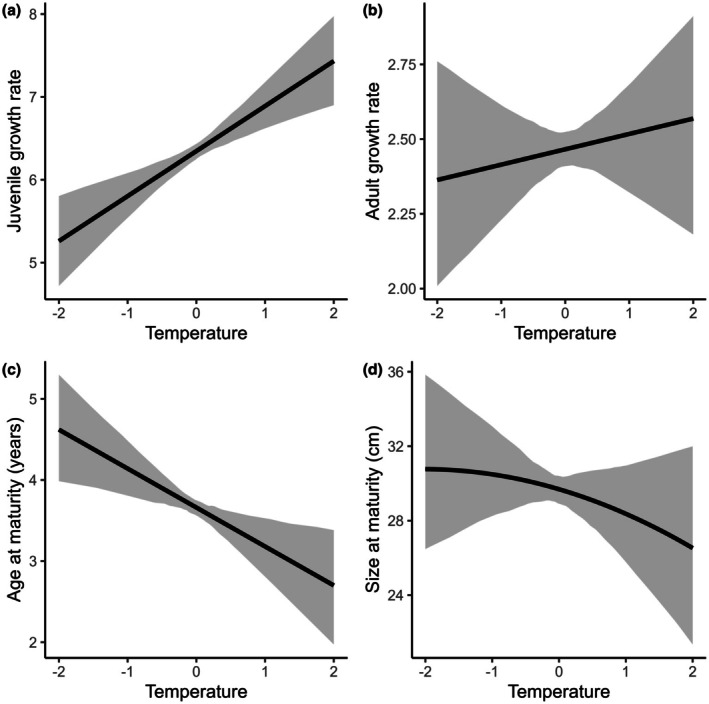 FIGURE 2
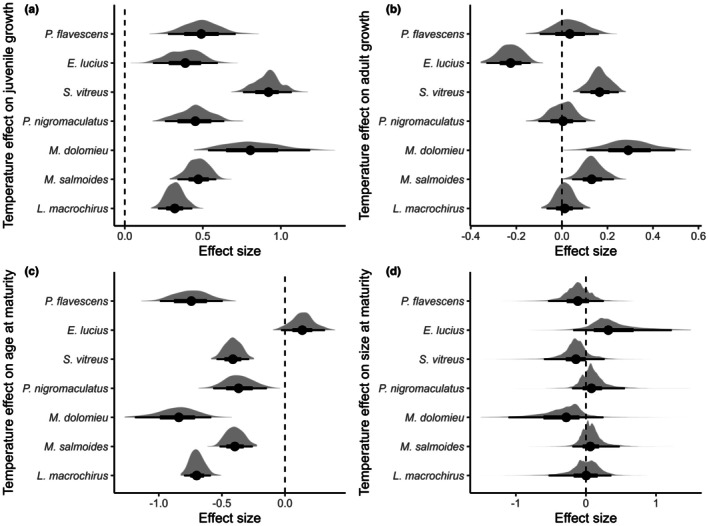 FIGURE 3
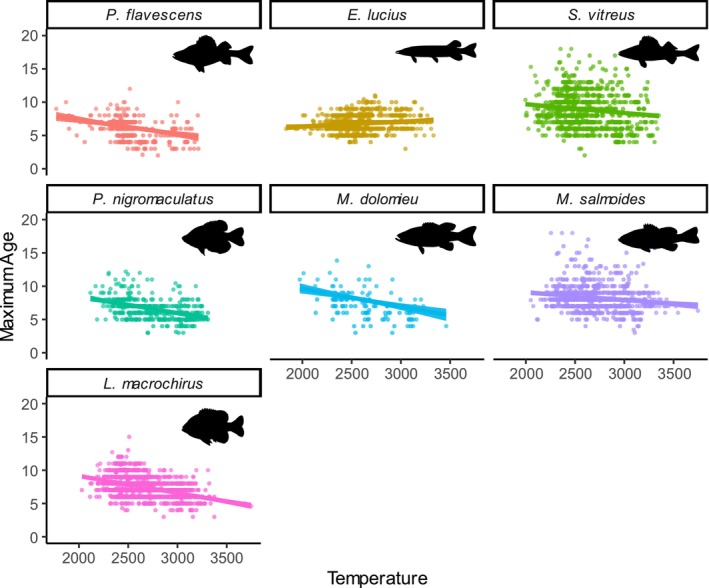 FIGURE 4
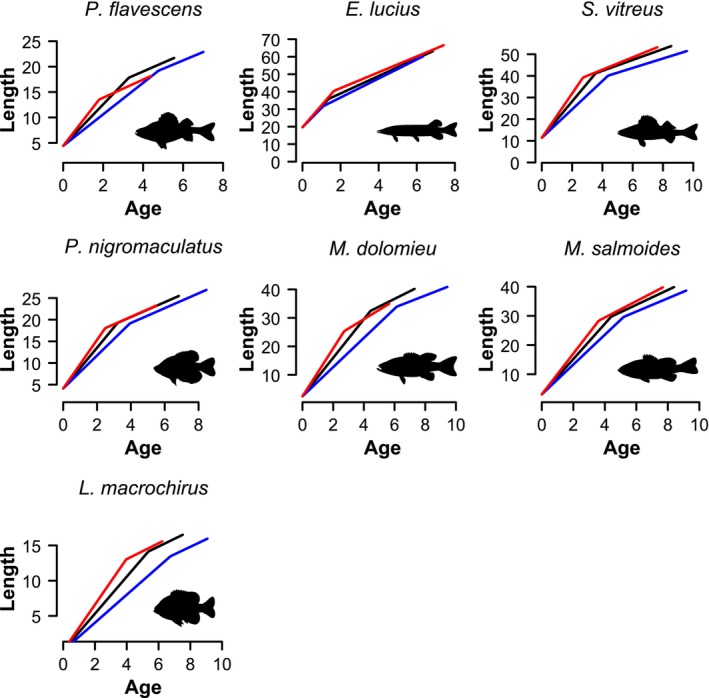 FIGURE 5
- —USGS Midwest Climate Adaptation Science Center
- —USGS National Climate Adaptation Science Center
- —University of Wisconsin‐Madison Center for Limnology
- —US Fish and Wildlife Federal Aid in Sport Fish Restoration
- —Wisconsin Department of Natural Resources10.13039/100009823
Peer Reviews
No public reviews on file for this paper yet. If you reviewed it on a platform where reviews are public (OpenReview, ICLR, NeurIPS, ICML), you can paste yours below so the community can read it here.
Videos
No videos yet. Explain this paper in a talk, walkthrough, or lecture? Add one.
Taxonomy
TopicsFish Ecology and Management Studies · Physiological and biochemical adaptations · Aquatic Ecosystems and Biodiversity
Introduction
1
Ecologists have long been fascinated by links between body size and temperature in nature, and early interest on the topic led to the formulation of general patterns, which have since been adopted as ‘rules’ (Allen 1877; Ray 1960). Much of this interest can be attributed to the direct and substantial contributions of body size to individual fitness and ecology, including effects on metabolism (Brown et al. 2004), intra‐ and interspecific competition, predator avoidance (Lawson and Carpenter 2014), abundance (White et al. 2007), and reproduction (Barneche et al. 2018).
The temperature‐size rule is one general pattern that has emerged specifically for ectotherms (Atkinson 1994). The temperature‐size rule states that organisms living in warmer temperatures will (1) grow faster when they are young, (2) mature at an earlier age, and (3) mature at a smaller size. These effects have been observed in 80% of laboratory studies across multiple, diverse taxa including plants, animals, protozoa, and bacteria (Atkinson 1994; Forster et al. 2012). For species with determinate growth, these effects will culminate in smaller maximum body sizes at higher temperatures. Many authors have extrapolated the original temperature‐size rule to make predictions about how maximum body size in species with indeterminate growth will be influenced by temperature (Audzijonyte et al. 2025), and the notion that species might ‘shrink’ with rising temperatures has generated considerable interest considering global warming trends.
The temperature‐size rule has garnered much attention in the study of fisheries affected by climate change owing to its potential to predict and explain effects of increasing temperatures on fish populations (Rountrey et al. 2014; Huss et al. 2019; Lindmark et al. 2022; Wootton et al. 2022). Concerns have arisen that fish body sizes will become smaller over time, thereby jeopardising yield and harvest (Daufresne et al. 2009; Baudron et al. 2014; Oke et al. 2020; Ikpewe et al. 2021). For inland recreational fisheries often managed by length‐based harvest regulations, changes in body sizes will influence the effectiveness of such regulations. However, smaller body size with warming oversimplifies the temperature size rule for species like fish that exhibit indeterminate growth (Audzijonyte et al. 2025). Documenting smaller individuals in warmer climates without evaluating patterns of growth and maturation does not provide sufficient evidence for the mechanisms driving temperature‐size rule relationships (Lindmark et al. 2023). Moreover, studies that have solely looked at changes in average body size (e.g., mean length) across temperature gradients have reached different conclusions about the direction of trends (Audzijonyte et al. 2020; Oke et al. 2020; Solokas et al. 2023). A comprehensive evaluation of the temperature‐size rule in wild fish populations is therefore needed. Understanding temperature effects on growth at multiple life stages and maturation can also inform more effective length‐based regulations, such as those designed to protect spawning fish.
Here we conduct a test of the temperature‐size rule in wild inland fish populations, using 1.4 million records of freshwater fish from 7 species in 2704 lakes, spanning 2 decades and 10 degrees of latitude in the upper Midwest United States (Frater et al. 2024). We use a Bayesian multi‐level modelling framework to fit biphasic growth models to age‐length data and water temperatures within each lake‐year‐species combination. This type of regression performed on age‐length data provides considerable information about juvenile and adult growth rates, maximum body size, and the age and length at which fish mature and begin allocating energy from somatic growth to reproduction (Honsey et al. 2017). We compared the results of this multi‐level model to a priori theoretical predictions stemming from the temperature‐size rule and its extensions. Specifically, we evaluated if warmer temperatures were associated with (a) faster juvenile growth rate, (b) earlier time to maturation, and (c) smaller size at maturation. We further quantified the effect of temperature on adult growth rates and lifespan to quantify temperature's cumulative effect on maximum body size.
Materials and Methods
2
Age‐Length Data
2.1
To test for the differences in growth patterns across temperature in freshwater fish we assembled standardised fisheries monitoring data collected by state agencies in the upper Midwest United States. The surveys were conducted between 1990 and 2021. All data in this study came specifically from lakes, so we use that specific term in place of the more general ‘waterbody’ or ‘population’ when describing methods and results. This data set contained more than 23 million fish records from standardised fishery survey data across seven states (Illinois, Indiana, Iowa, Michigan, Minnesota, South Dakota, and Wisconsin). We used paired age‐length data for seven species: Black Crappie ( Pomoxis nigromaculatus ), Bluegill ( Lepomis macrochirus ), Largemouth Bass ( Micropterus salmoides ), Northern Pike ( Esox lucius ), Smallmouth Bass ( Micropterus dolomieu ), Walleye ( Sander vitreus ), and Yellow Perch ( Perca flavescens ). In many cases, only a subsample of measured fish was subsequently aged, as is common in fisheries surveys. Unbiased growth estimation requires a random sample of the population; aged fish from fisheries surveys, however, do not represent a random sample because length groups are sub‐sampled without accounting for the selectivity of the survey method (Isermann and Knight 2005; Goodyear 2019). Because of this, boosting samples with age‐length keys has been shown to alleviate bias in growth data (Isermann and Knight 2005; Goodyear 2019). We used age‐length sub‐sampled data for each population to produce an age‐length key and assigned ages to the entire sample for each species, lake, and year (Frater et al. 2024; Table S1). To reduce spurious relationships stemming from small sample sizes, we only produced keys for lake‐years that had at least 5 distinct age groups with at least 5 individuals sampled in each age group. Lake‐years that did not meet these criteria were discarded, resulting in a final dataset comprising 1.4 million age‐length records from 4496 surveys across 2704 lakes.
Fish are typically aged by counting annuli on a variety of hard morphological structures (Maceina and Sammons 2006; Maceina et al. 2007). Our dataset includes fish aged using scales, otoliths, cleithra, fin rays, and spines. Although otoliths have been shown to provide the most accurate estimates of age for most fish and cleithra are the gold standard for Esox spp. (Beamish and McFarlane 1983; Maceina and Sammons 2006; Maceina et al. 2007), we chose to analyse all aging methods combined to increase our sample size (Table S1). We were unable to include aging method as a covariate owing to the model already being highly parameterized. However, given that there was no systematic bias in what aging methods were used during data collection, we do not believe that combining aging methods would generate spurious relationships between temperature and growth rates (Erickson 1983; Maceina and Sammons 2006; Isermann et al. 2010). Given that aging method is most likely to bias older individuals, it could be argued that the estimates of adult growth would be most sensitive to aging method; to test this, we analysed a subset of the data that only included the most reliable aging estimates (otoliths and cleithra) and found no substantial differences in the estimates of adult growth from the full model (Figures S1–S4, Table S4).
Temperature Data
2.2
We used modelled daily temperature profile data for lakes in the upper Midwest United States (Corson‐Dosch et al. 2023) to quantify experienced growing temperatures for each lake included in our dataset. Specifically, we used surface temperature growing‐degree days at 5°C (GDD5), which is the cumulative sum of degree‐days greater than 5°C. This serves as a metric for the total amount of thermal energy that a lake receives on an annual basis and has been widely used for studies of fish growth (Venturelli et al. 2010; Chezik et al. 2014; Hansen et al. 2017; Honsey et al. 2023). Although the choice of 5°C is somewhat arbitrary, previous work has shown that the characterisation of thermal conditions within a given year is largely insensitive to the temperature cutoff (Honsey et al. 2023) and correlates with relevant ecological metric (Flood et al. 2025; Xu et al. 2025). To capture the thermal regime experienced by each population we computed the mean GDD5 over the 10‐year period prior to and including the year in which a particular lake was sampled and refer to this quantity as T10¯. While our choice of a 10‐year timespan to characterise thermal conditions does not cover the maximum lifespan of the species in our study, it is representative of temperature regimes experienced by younger age classes (< 10 years) that make up most individuals in our dataset. Importantly, metrics calculated over different time periods are highly correlated (e.g., T10¯~T5¯;Radj2=0.99) such that choice of time periods does not alter the estimated effect of temperature.
Statistical Analysis
2.3
We fit a Bayesian generalised linear mixed model to age‐length data from seven freshwater fish species to evaluate the effect of temperature on growth and maturity. The model consists of a change‐point (i.e., hockey‐stick, or biphasic growth model) regression to model age‐length data of species j obtained during lake‐year k as:
for i=1…n individuals, where μi is expected length, yi is observed length, and ai is age of fish i. The process error that links observed lengths to expected lengths is assumed to follow a log‐normal distribution with standard deviation σj2 for j=1…J species. α, β1, β2, and Amat are species‐specific parameters that describe the shape of the hockey‐stick model (Figure 1). The initial slope of the change‐point regression (β1) is the first slope and represents juvenile growth rate. We expect this parameter to increase with temperature since juvenile fish are predicted to grow faster in warmer waters under the temperature‐size rule. The change‐point (Amat) is the age at which the slope transitions from β1 to β2 and is representative of fish transitioning from juvenile to adult growth (i.e., the age at maturity). While Amat is not a direct measurement of sexual or reproductive maturity, this parameter of the biphasic growth model has been shown to serve as a reasonable proxy for age at maturity (Honsey et al. 2017). The temperature‐size rule predicts a lower (younger) age at maturity with increasing temperature; therefore, we predict Amat will decrease with temperature. The temperature‐size rule also predicts a smaller size at maturity, a parameter which we can derive by combining estimates of α, β1, and Amat. Lastly, β2 represents the adult growth rate, which we expect to be negatively correlated with temperature as the temperature‐size rule predicts slower adult growth rates in warmer temperatures.
(a) Theoretical predictions from the temperature‐size rule for various growth metrics. (b) Example growth curve to show how the present analysis estimates parameters of interest to regress against temperature. Given the difficulty in interpreting α, we do not try to model it as a function of temperature and instead include it only as a random lake effect. Derived parameters have been placed in parentheses for clarity.
We model β1, Amat, and β2 as linear functions of historical temperature (T10k¯) experienced by lake‐year k with random species (j) and lake (l) effects. Although α could potentially be interpreted as egg size or size of hatching (size at age zero), given that we model growth linearly, we do not believe that estimates of α, and particularly variation in α with temperature, are readily interpretable. Therefore, we model α simply as a species‐specific constant with a random lake (l) effect, such that:
where φp is the predicted value of parameter p, γ0 and γ1 are second‐level intercept and slope parameters that model the respective change‐point regression parameters against temperature and p indicates parameter specific coefficients. Values of each parameter (φ) are assumed to be drawn from normal distributions with standard deviation σφ2. We included random lake intercepts (ωl) on all four parameters to account for random variability across space. We also included random species slopes τj on β1,Amat and β2 to account for taxonomic differences in sensitivity to temperature. We assumed that random effects for lakes and species are drawn from normal distributions with means 0 and standard deviations σω2 and στ2 respectively. While several species in our analysis exhibit sexual size dimorphism (Froese and Pauly 2025), we were unable to account for sex differences because the fish in our dataset were unsexed. Combining data across sexes may reduce precision on our estimates of average growth rates and maturation ages but should not influence our main conclusions regarding the effects of temperature.
We assigned the intercepts (γ0) for each change point parameter Uniform(0, 30) priors, and the temperature‐dependent slopes of β1,Amat and β2 vague Normal(0,1) priors. Lastly, we assigned all process errors and random effect σ2 parameters Gamma(1,1) priors. We derived posterior distributions of all parameters by performing Gibbs sampling using JAGS (Plummer 2003) implemented with the R2jags R package (Su and Yajima 2021) in R (R Core Team 2025). MCMC sampling was performed using 3 chains of 125,000 iterations each, a burn‐in period of 30,000, and a thinning rate of 10. We used r^ values to assess convergence across chains and effective sample sizes (ne) to assess convergence within chains. We determined the statistical significance of model parameters by whether 95% highest posterior densities overlapped with zero.
To evaluate the combined impact of the various effects of temperature on maximum body size (i.e., via effects on juvenile growth rate, maturity, and adult growth rate), it is necessary to know the expected longevity of species. Temperature, however, is known to effect survival (Pauly 1980; Pepin 1991). Indeed, differential mortality has been postulated as a potential mechanism driving the temperature‐size rule in certain instances (Audzijonyte et al. 2022). To evaluate potential effects of temperature on survival, and hence lifespan, we extracted the 95th percentile age of fish in each population and fit a Bayesian generalised linear regression of 95th percentile age as a function of temperature. We assumed a Gaussian error distribution and a random effect of lake. We included the interaction between species and temperature to account for taxonomic differences in thermal sensitivity. We assigned all associated parameters vague Normal(0,10) priors. We derived posterior distributions of all parameters in R using the brms package (Bürkner 2017). We ran three MCMC chains for 50,000 iterations each, with a burn‐in period of 40,000, and a thinning rate of 100. We used r^ values to assess convergence across chains and effective sample sizes (ne) to assess convergence within chains. All r^ values were less than 1.1, and all effective sample sizes were greater than 300.
To generate derived estimates of size at maturity and maximum size, we combined the parameter estimates from both analysis and modelled length at age as a function of temperature. For size at maturity, we used the posterior distributions of α, β1, and Amat, and their associated temperature effects, to produce size estimates that inherit all sources of uncertainty from their constituent parts. For maximum size, we included all parameters (including temperature‐dependent maximum ages from the subsidiary analysis) to create growth curves across the entire lifespan of each species under different temperature regimes. Again, all uncertainty is carried over into these size estimates.
Results
3
Across the seven focal taxa, model intercepts (α) ranged from 0.07 cm (95% CI: 0.00, 0.23) to 19.66 cm (95% CI: 18.95, 20.27; Table S2). Juvenile growth rates (β1) ranged from 2.63 (95% CI: 2.52, 2.66) to 11.80 (95% CI: 11.49, 12.11), and adult growth rates (β2) ranged from 1.10 (95% CI: 1.02, 1.17) to 4.99 (95% CI: 4.91, 5.08). In each case the extremes were occupied by L. macrochirus and E. lucius respectively; E. lucius exhibiting the largest intercept, fastest juvenile growth rate, and fastest adult growth rate, whereas L. macrochirus exhibited the smallest intercept, slowest juvenile growth rate, and slowest adult growth rate (Table S2). The change point parameter (Amat), our proxy for age at maturity, ranged from 1.38 years (95% CI: 1.10, 1.59) to 5.36 years (95% CI: 5.26, 5.46). Although the change point parameter can be an unreliable metric in natural populations (Wootton et al. 2020), all estimates fell within the range of published values for maturation ages for each of the seven focal species (Froese and Pauly 2025).
Across species, we found an overall positive relationship between temperature and juvenile growth rate (γ1β1 = 0.54, 95% CI: 0.29, 0.80; Figure 2), and all species exhibited statistically significant positive relationships between temperature and juvenile growth rate (Figure 3, Table S3). We found an overall negative relationship between temperature and age at maturity (γ1Amat = −0.48, 95% CI: −0.84, −0.14; Figure 2), such that fish matured on average 2 years earlier at the warmest lake‐year combinations in our study compared to the coldest ones. Within species, E. lucius was the only taxon that did not exhibit statistically significant negative relationships between temperature and age at maturity ( E. lucius , γ1Amat = 0.14, 95% CI: −0.03, 0.32; Figure 3, Table S3). When combining estimates of juvenile growth rate and age at maturity, we found some evidence for a negative relationship between temperature and size at maturity (γ1Lmat = −0.25, 95% CI: −0.52, −0.09; Figure 2); however, when looking at the species level, we found no evidence for relationships between size at maturity and temperature (Figure 3, Table S3). Effect sizes and directions were unrelated to species thermal preferenda (Hasnain et al. 2013).
Predicted marginal effects across all species of temperature on (a) juvenile growth rate, (b) adult growth rate, (c) age at maturity, and (d) size at maturity. Solid lines reflect the mean posterior predictions and shaded areas reflect the 95% credible intervals.
Predicted conditional (species‐specific) effects of temperature on (a) juvenile growth rate, (b) adult growth rate, and (c) age at maturity, and (d) size at maturity. Note that size at maturity is a derived parameter; as such, the posterior densities reflect first‐order derivations of the curve produced from the conditional predicted values of juvenile growth and age at maturity across temperature gradients. Points reflect median posterior estimates. Thick and thin lines denote the 66% and 95% credible intervals respectively and the shaded area shows the full posterior density. The dashed vertical lines are set at zero, indicating no effect of temperature on the parameter in question.
We did not find evidence for a general relationship between temperature and adult growth rate (γ1β2 = 0.05, 95% CI: −0.15, 0.23; Figure 2). Within species, however, we found evidence for positive relationships between temperature and adult growth rates in S. vitreus , M. dolomieu , and M. salmoides ( S. vitreus , γ1β2 = 0.17, 95% CI: 0.08, 0.25; M. dolomieu , γ1β2 = 0.29, 95% CI: 0.11, 0.50; M. salmoides , γ1β2 = 0.13, 95% CI: 0.04, 0.23; Figure 3, Table S3), and a negative relationship between temperature and adult growth rates in E. lucius (γ1β2 = −0.23, 95% CI: −0.33, −0.14; Figure 3, Table S3). From the subsidiary regression, we found evidence of a negative relationship between temperature and maximum age (γ1Amax = −0.37, 95% CI: −0.57, −0.15; Figure 4). Six of seven species had significant negative species‐specific relationships, whereas E. lucius exhibited a positive relationship between temperature and maximum age (γ1Amax = 0.19, 95% CI: 0.04, 0.33). As a result, most species exhibited inconsistent relationships between temperature and maximum body size (Figure 5, Table S3). The maximum size of E. lucius was predicted to be larger at higher temps (γ1Lmax = 1.19, 95% CI: 0.11, 2.44; Figure 5, Table S3). Again, effect sizes and directions were unrelated to species thermal preferenda.
Maximum age (95th quantile) as a function of temperature (growing degree days over the previous 10 years) for seven freshwater fish species. Silhouettes reproduced without modification from PhyloPic.org under a Creative Commons licence CC0 1.0: Esox lucius , Timothy Knepp and Michael Keesey; Pomoxis nigromaculatus , Rene Martin; Micropterus salmoides , Carlos Cano‐Barbacil; Lepomis macrochirus , Corrine Avidan. Silhouettes reproduced without modification from PhyloPic.org under a Creative Commons licence CC BY‐SA 3.0 https://creativecommons.org/licenses/by‐sa/3.0/: Perca flavescens and Sander vitreus , NOAA Great Lakes Environmental Research Laboratory and Timothy Bartley; Micropterus dolomieu , Sherman Foote Denton and Timothy J. Bartley.
Predicted growth curves at different water temperature for all seven species. Blue lines represent the 5th percentile of T10¯ observed (i.e., coolest waters), black lines represent the median of T10¯ observed, and red lines represent the 95th percentile of T10¯ observed (i.e., warmest waters). Growth curves are projected out to the estimated longevity for each temperature regime. Silhouettes reproduced without modification from PhyloPic.org under a Creative Commons licence CC0 1.0: Esox lucius , Timothy Knepp and Michael Keesey; Pomoxis nigromaculatus , Rene Martin; Micropterus salmoides , Carlos Cano‐Barbacil; Lepomis macrochirus , Corrine Avidan. Silhouettes reproduced without modification from PhyloPic.org under a Creative Commons licence CC BY‐SA 3.0 https://creativecommons.org/licenses/by‐sa/3.0/: Perca flavescens and Sander vitreus , NOAA Great Lakes Environmental Research Laboratory and Timothy Bartley; Micropterus dolomieu , Sherman Foote Denton and Timothy J. Bartley.
Discussion
4
The temperature‐size rule predicts that fish in warmer environments should exhibit faster juvenile growth rates, earlier and smaller maturation, and potentially smaller maximum body sizes than fish in cold environments (Atkinson 1994; Berrigan and Charnov 1994; Angilletta et al. 2004; Kuparinen et al. 2011; Crozier and Hutchings 2014). In the first empirical test of these patterns across more than a million fish in temperate lakes, we only found partial support for these expectations. Consistent with the temperature‐size rule, juvenile growth rates and maturity were faster and earlier, respectively. Inconsistent with the temperature‐size rule, we found that size at maturity remained constant with respect to temperature. In addition, maximum size did not show a consistent relationship with temperature. Therefore, while certain life‐history characteristics appear to respond to temperature as predicted, variable responses in other growth, maturation, or survival traits can yield unpredictable patterns in fish body size in response to thermal conditions.
For ectotherms, metabolic demands increase with temperature, particularly in adults (Dillon et al. 2010; Bestion et al. 2015). The ubiquity of faster juvenile growth rates, earlier maturation, and smaller maximum ages with increasing temperature is therefore consistent with life‐history theory's prediction that reduced survival selects for an accelerated pace of life (Gadgil and Bossert 1970; Reznick et al. 1990; Stearns 1992; Roff 1993; Arendt 2011). The one species with invariant maximum ages across temperature regimes, E. lucius , was concordantly the one species that showed invariant age at maturity across temperatures. Because we do not have data on true survival, however, we cannot rule out the possibility that faster juvenile growth rates and earlier maturity may be non‐adaptive responses to temperature (Angilletta and Dunham 2003; Gillooly et al. 2001; Kingsolver 2009; Zuo et al. 2012; Forster et al. 2012; Paaijmans et al. 2013). The assuredness of our conclusions is further challenged by the ubiquity of fishing in our study system (Xu et al. 2025). Fishing has the potential to reduce maximum age and select for faster life histories in a similar manner to the predicted effect of temperature. However, there is no correlation between temperature and fishing intensity in our study region (Deroba et al. 2007; Embke et al. 2020; Feiner et al. 2020), such that our interpretation of how temperature affects growth and maturity is not confounded.
While species overwhelmingly exhibit earlier maturation at higher temperatures, species did not exhibit a corresponding reduction in size at maturity. Size at maturity was largely invariant across temperature regimes. Optimality models assume that individuals mature at an age and size that maximises fitness; delayed maturity is a common prediction of optimality models when juvenile growth rate is low, and more time is needed to reach reproductive size (Stearns and Koella 1986; Perrin and Rubin 1990). The coupling of faster juvenile growth rate with smaller size at maturity is only expected if juvenile mortality is strongly linked to juvenile growth rate (Stearns and Koella 1986), or if asymptotic size is inversely related to juvenile growth rate (Berrigan and Charnov 1994). It is perhaps unsurprising therefore that this trend is not the norm in wild populations (Berrigan and Charnov 1994; Angilletta and Dunham 2003; Angilletta et al. 2004). Instead, we find support for plasticity in age at maturity allowing organisms to maintain a constant size at maturity, whereby an optimal reproductive schedule is achieved.
In general, adult growth rates were less affected by temperature than juvenile growth rates and higher temperatures did not result in smaller maximum body sizes. Many reasons exist for why the relationships between temperature, growth, and maturity might be different in laboratory experiments compared with a natural setting. Associations between temperature and other biotic or abiotic characteristics in the wild could obscure or even reverse the effects of temperature (Pauly 1980; Hayward and Margraf 1987; Gislason et al. 2010; Robinson et al. 2017; Salerno et al. 2021). For example, if there is a link between temperature and food availability, changes in water temperature could indirectly alter foraging behaviour and resource acquisition (Pink and Abrahams 2017; Holbrook et al. 2022). The lakes in this study vary greatly in their productivity (Heiskary and Wilson 2008); if the transient dynamics within these systems are such that the range of warmer temperatures is correlated with increased productivity, the trade‐off to allocate between somatic and reproductive growth is removed for fish in warmer, more productive systems (Hayward and Margraf 1987).
Alternatively, the failure to find clear concordance with the temperature‐size rule may stem from our overly simple metric to characterise the complex thermal regimes of lakes. In stratified lakes, fish may have seasonal access to cooler hypolimnetic waters and are thus unaffected by rising surface temperatures. However, use of these thermal refugia may itself come with a growth penalty because of lower food availability in cooler water; most of the species in our study are shallow water littoral species that occupy the epilimnion where food is most abundant. Thus, even though our temperature metric does not capture all nuances of a lake's thermal environment, it should still correlate with how a species' energy acquisition and growth will likely be affected by rising temperatures.
This study represents the most thorough test of the temperature‐size rule in wild fish populations. Previous investigations of the temperature‐size rule in wild populations only looked at changes in one component of growth, typically average or maximum body size, as it relates to temperature (Olalla‐Tárraga and Rodríguez 2007; Baudron et al. 2014; Audzijonyte et al. 2020; Oke et al. 2020; Solokas et al. 2023; Warne et al. 2024; Grabda et al. 2025). As a result, these prior studies can lend support for or against the temperature‐size rule, but do not evaluate its predictions in totality (Lindmark et al. 2023). Our results align with previous work that found equivocal support for consistent trends in body size with respect to temperature in natural systems (Huss et al. 2019; Audzijonyte et al. 2020; Lindmark et al. 2023; Solokas et al. 2023). However, it is difficult to draw comparisons with prior studies owing to the inconsistency in growth and size metrics under observation (Audzijonyte et al. 2025). Our results further reveal that temperature has the most consistent effect on juvenile growth rate and age at maturity. Only in certain instances is variation in those two traits sufficient to create hypothesised relationships between maximum size and temperature. The phenomenon of ‘shrinking’ fish is thus not necessarily a universal consequence of climate change (Audzijonyte et al. 2020; Warne et al. 2024).
Body size is intricately linked to fitness (Brown et al. 1993; Kingsolver and Huey 2008). For harvested populations specifically, body size and maturity are critical metrics for designing effective management policies. Climate‐induced changes in growth and size can therefore have profound consequences on demography and extinction risk. To accurately predict the effects of warming on wildlife, and thereby design climate‐smart mitigation strategies, we need a better understanding of how temperature shapes ontogenetic growth patterns in natural systems, not just in a laboratory setting.
Author Contributions
All authors conceived of the study; G.C.B. and P.N.F. conducted the analyses; G.C.B., P.N.F., O.P.J., and Z.S.F. led the writing of the paper. All authors approved the manuscript.
Conflicts of Interest
The authors declare no conflicts of interest.
Supporting information
Appendix S1: ele70344‐sup‐0001‐AppendixS1.pdf.
The reference list from the paper itself. Each links out to its DOI / PubMed record.
- 1Allen, J. A. 1877. “The Influence of Physical Conditions in the Genesis of Species.” Radical Review 1: 108–140.
- 2Angilletta, M. J. , and A. E. Dunham . 2003. “The Temperature‐Size Rule in Ectotherms: Simple Evolutionary Explanations May Not Be General.” American Naturalist 162: 332–342.10.1086/37718712970841 · doi ↗ · pubmed ↗
- 3Angilletta, M. J. , T. D. Steury , and M. W. Sears . 2004. “Temperature, Growth Rate, and Body Size in Ectotherms: Fitting Pieces of a Life‐History Puzzle.” Integrative and Comparative Biology 44: 498–509.21676736 10.1093/icb/44.6.498 · doi ↗ · pubmed ↗
- 4Arendt, J. D. 2011. “Size‐Fecundity Relationships, Growth Trajectories, and the Temperature‐Size Rule for Ectotherms.” Evolution 65: 43–51.20812979 10.1111/j.1558-5646.2010.01112.x · doi ↗ · pubmed ↗
- 5Atkinson, D. 1994. “Temperature and Organism Size–A Biological Law for Ectotherms?” Advances in Ecological Research 25: 1–58.
- 6Audzijonyte, A. , K. H. Andersen , D. Atkinson , et al. 2025. “Which Body Size Metrics Should Be Used for Assessing Temperature Impacts on Fish Growth and Size?” Global Change Biology 31: e 70296.40530464 10.1111/gcb.70296 · doi ↗ · pubmed ↗
- 7Audzijonyte, A. , E. Jakubavičiūtė , M. Lindmark , and S. A. Richards . 2022. “Mechanistic Temperature‐Size Rule Explanation Should Reconcile Physiological and Mortality Responses to Temperature.” Biological Bulletin 243: 220–238.36548974 10.1086/722027 · doi ↗ · pubmed ↗
- 8Audzijonyte, A. , S. A. Richards , R. D. Stuart‐Smith , et al. 2020. “Fish Body Sizes Change With Temperature but Not All Species Shrink With Warming.” Nature Ecology & Evolution 4: 809–814.32251381 10.1038/s 41559-020-1171-0 · doi ↗ · pubmed ↗