Morphology-driven oxygen evolution performance of NiOx nanostructures and implications for hole transport in perovskite solar cells
Prabhu Bharathan, Can Li, Bipin Rijal, Lihua Zhang, Areesha Maryam, Joseph Delgado, Kim Kisslinger, Adyasa Priyadarsini, Mahesh Nepal, Tanka P. Bhushal, Tara P. Dhakal, Shyam Kattel, Jiye Fang

TL;DR
This paper shows how shaping nickel oxide nanostructures improves both oxygen production and solar cell efficiency.
Contribution
The study introduces spindle-like NiOx nanostructures that achieve low OER overpotentials and high solar cell performance.
Findings
Spindle-like NiOx nanostructures crystallize at lower temperatures and show better OER activity.
NiOx-NS delivers a 395 mV OER overpotential, outperforming plate-like structures.
NiOx-NS as a hole transport layer achieves a 13.25% power conversion efficiency in solar cells.
Abstract
Morphology-controlled nanostructures provide an effective strategy to modulate both oxygen evolution reaction (OER) activity and photovoltaic performance in perovskite solar cells (PSCs). However, achieving low OER overpotentials and high power conversion efficiency (PCE) simultaneously through morphology engineering remains challenging. In this work, nickel oxide (NiOx) nanostructures with spindle-like (NiOx-NS) and plate-like (NiOx-NP) morphologies were synthesized and evaluated as bi-functional OER catalysts and hole transport layers (HTLs) in inverted PSCs. Structural and thermal analyses reveal that NiOx-NS crystallizes into a cubic phase at a lower temperature (300 °C), whereas NiOx-NP requires higher calcination temperatures, reflecting differences in precursor microstructure. Electrochemical measurements indicate that NiOx-NS calcined at 300 °C delivers the lowest OER…
Genes, proteins, chemicals, diseases, species, mutations and cell lines named across the full text — each resolved to its canonical identifier and authoritative record.
Click any figure to enlarge with its caption.
 Scheme 1
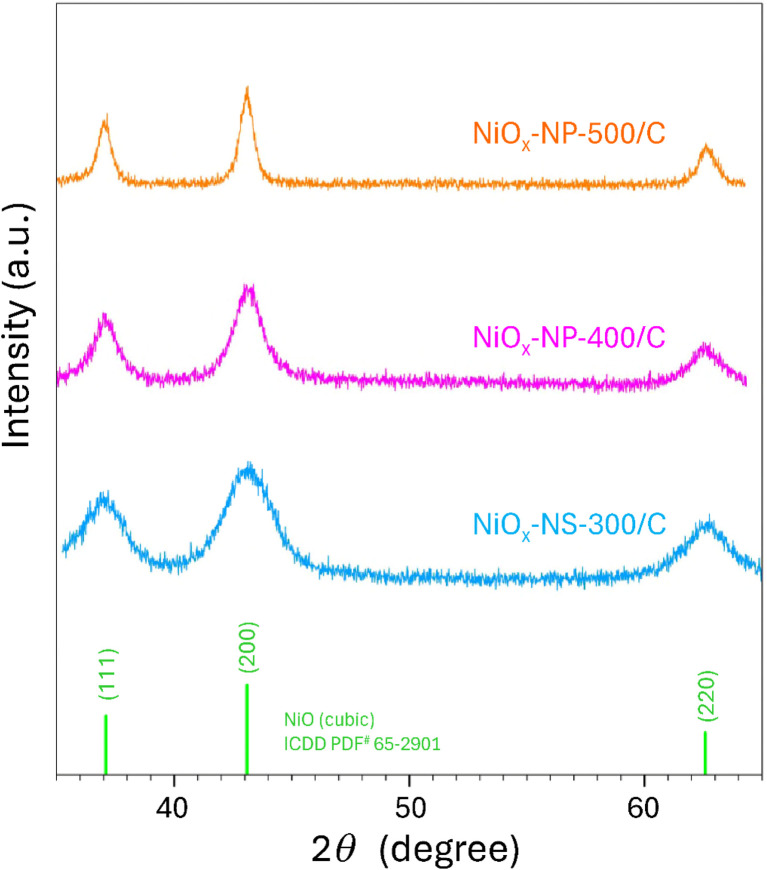 Fig. 1
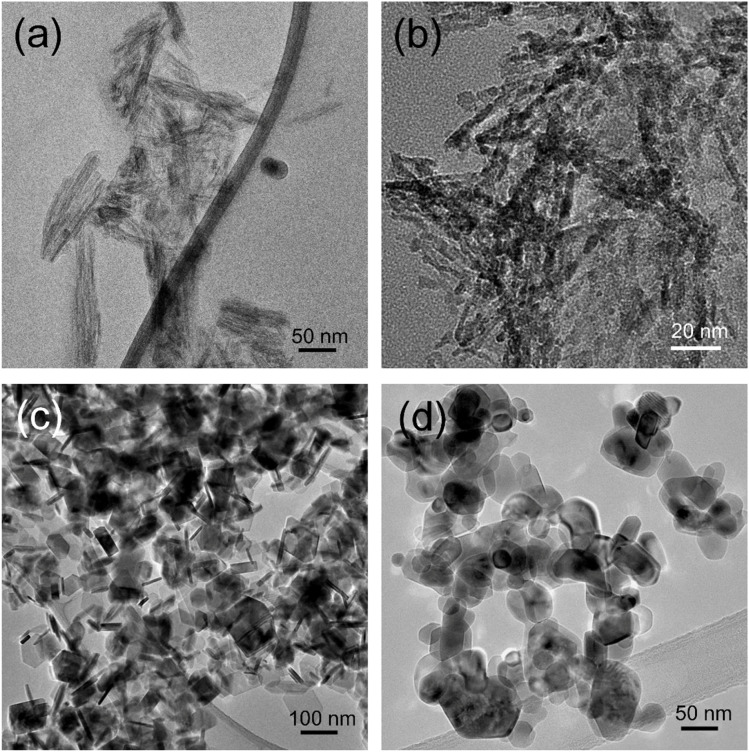 Fig. 2
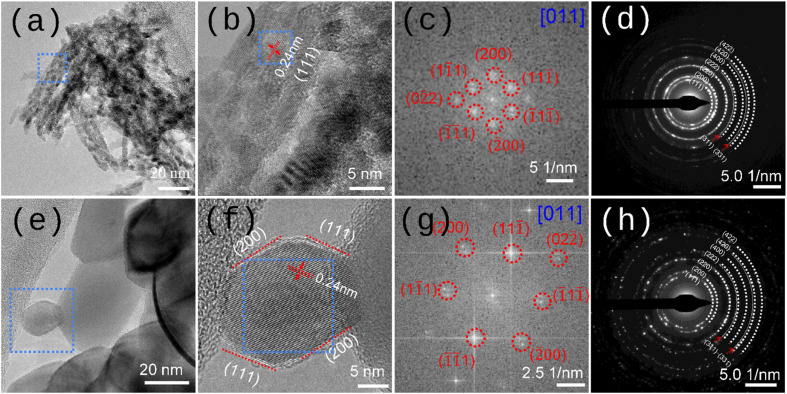 Fig. 3
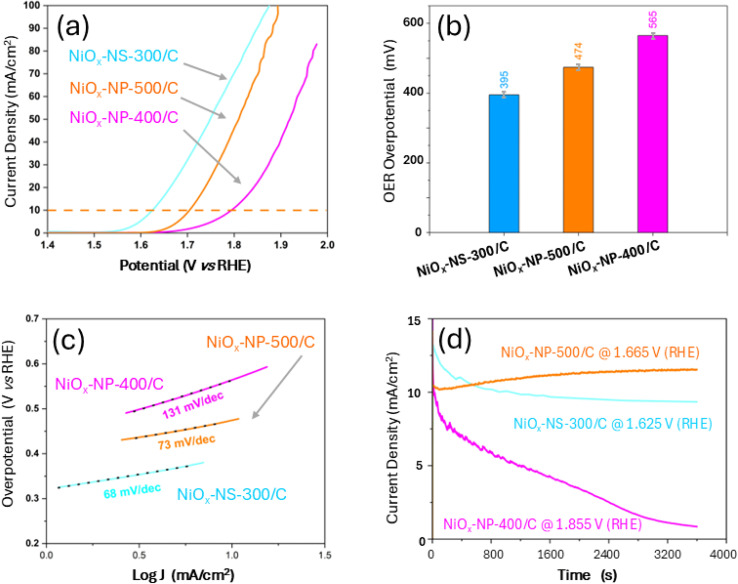 Fig. 4
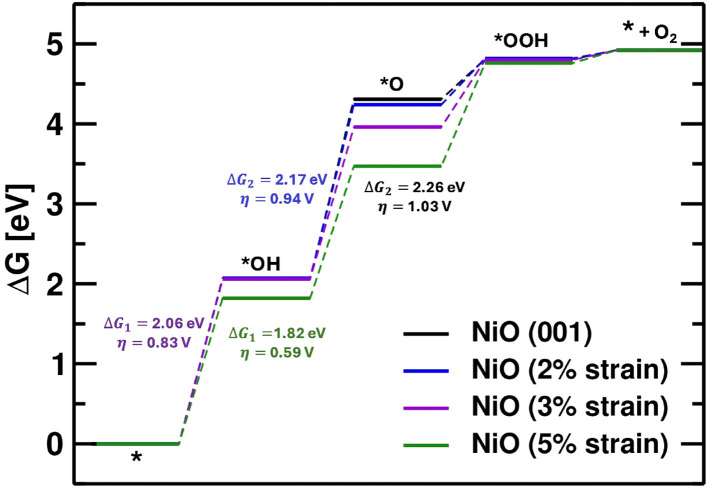 Fig. 5
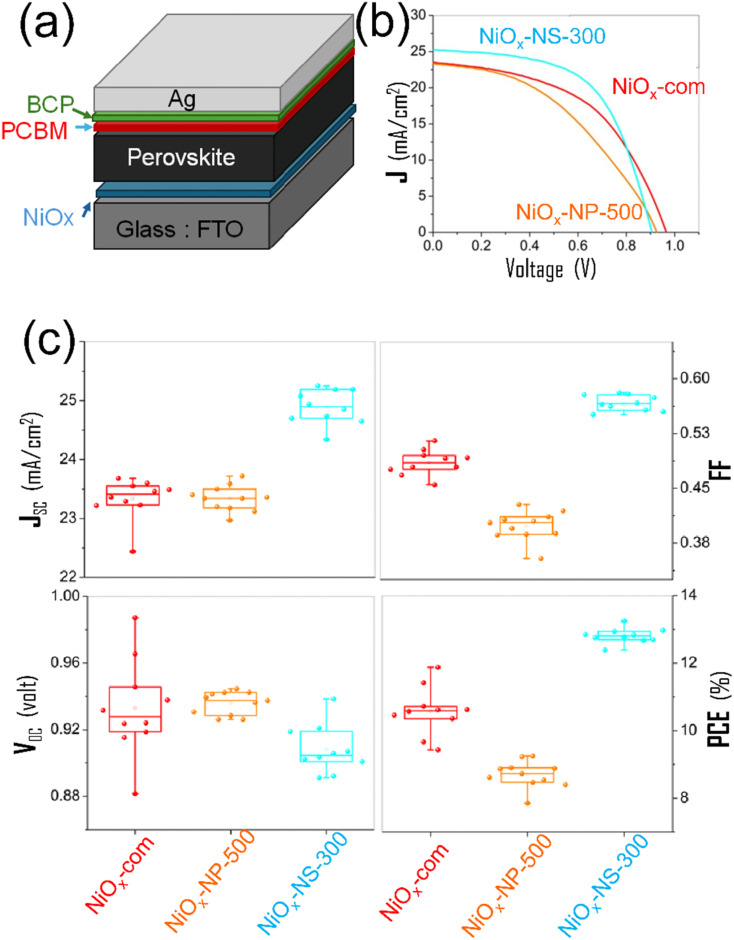 Fig. 6
- —Brookhaven National Laboratory10.13039/100006231
- —New York State Energy Research and Development Authority10.13039/100004862
- —Binghamton University10.13039/100008451
- —Division of Materials Research10.13039/100000078
- —National Science Foundation10.13039/100000001
- —San Diego Supercomputer Center10.13039/100016353
- —Office of Advanced Cyberinfrastructure10.13039/100000105
Peer Reviews
No public reviews on file for this paper yet. If you reviewed it on a platform where reviews are public (OpenReview, ICLR, NeurIPS, ICML), you can paste yours below so the community can read it here.
Videos
No videos yet. Explain this paper in a talk, walkthrough, or lecture? Add one.
Taxonomy
TopicsPerovskite Materials and Applications · Machine Learning in Materials Science · TiO2 Photocatalysis and Solar Cells
Introduction
Hydrogen production via electrochemical water splitting is a key technology for achieving a sustainable and carbon-neutral energy system.^1–3^ Among the two half-reactions, the oxygen evolution reaction (OER) in alkaline media is kinetically more demanding than the hydrogen evolution reaction (HER) due to its multistep, four-electron transfer pathway. This intrinsic complexity leads to sluggish reaction kinetics and high overpotentials.^4^ Consequently, the development of efficient, earth-abundant OER catalysts is essential for improving the overall efficiency of water electrolysis.
Nickel-based oxides (NiO_x_) have emerged as promising OER electrocatalysts owing to their low cost, chemical stability in alkaline media, and favorable electrochemical properties.^5–7^ However, despite extensive efforts, establishing a clear correlation between catalyst morphology and electrochemical performance remains challenging. Such understanding is critical, as catalyst morphology directly affects active-site exposure, charge-transfer characteristics, and reaction kinetics, which collectively govern catalytic efficiency.^8^ Elucidating morphology-performance relationships is therefore essential for the rational design of next-generation OER catalysts.
Beyond electrocatalysis, NiO_x_ is a p-type wide-bandgap semiconductor (>3.2 eV) that is widely used as a hole transport layer (HTL) in transparent conducting films,^9,10^ making it attractive for perovskite-based photovoltaic (PV) applications.^11,12^ Recent studies have demonstrated that bi-layered NiO_x_ architectures, comprising compact and nanoporous layers, can significantly enhance interfacial contact and reduce defect density, achieving a power conversion efficiency (PCE) of ∼20.7%.^13^ In addition, integration of NiO_x_ with self-assembled monolayers (SAMs) has been shown to improve interfacial properties, optimize energy-level alignment, and suppress defect formation in perovskite film.^14^ Furthermore, morphology-tailored NiO_x_ layers, particularly when combined with organic interlayers, effectively reduce open-circuit voltage losses in perovskite solar cells (PSCs).^15,16^ Notably, in both OER catalysis and HTL applications, NiO_x_ morphology plays a decisive role in determining functional performance.^17,18^
In this study, we systematically investigate the influence of NiO_x_ morphology on OER activity and its effectiveness as an HTL in PSCs. Two representative NiO_x_ nanostructures with distinct morphologies, spindle-like (NS) and plate-like (NP) nanostructures, were synthesized via controlled hydrothermal and thermal treatments, enabling direct comparison of their morphology-dependent structural, electrochemical, and PV properties. By correlating morphology with crystallization behavior, surface characteristics, and device performance, this work provides mechanistic insights into how morphology governs the multifunctional performance of NiOx nanomaterials.
Experimental section and computational method
Chemicals and materials
2.1
Nickel(ii) nitrate hexahydrate (Ni(NO_3_)2·6H_2_O, 99.99%), nickel(ii) acetate tetrahydrate (Ni(CH_3_CO_2_)2·4H_2_O, 98%), dimethylformamide (DMF, 99.8%), dimethyl sulfoxide (DMSO, 99%), isopropanol (IPA, 99.5%), and cetyltrimethylammonium bromide (CTAB, 95%) were purchased from Sigma-Aldrich. Methylammonium bromide (MABr, >99.99%), methylammonium iodide (MAI, >99.99%), formamidinium iodide (FAI, 99.99%), and methylammonium chloride (MACl, >99.99%) were obtained from Great Cell Solar Materials. Potassium hydroxide (KOH, 99.98%), urea (CO(NH_2_)2, > 99.9%), and bathocuproine (BCP, 98%) were supplied by Thermo Fisher Scientitic. Cesium iodide (CsI, 99.999%), lead iodide (PbI_2_, >99%), fullerene (C60, 99.95%), silver (Ag, 99.99%), and anhydrous ethanol (Koptec, 200 proof) were received from Acros Organics, Tokyo Chemical Industries (TCI), Solaris Chem, Kurt J. Lesker, and Decon Labs, Inc., respectively. All the chemicals were used as received without further purification. Ketjenblack EC600JD was provided by Lion Specialty Chemicals Co., Ltd (JP), and commercial nickel oxide (NiO_x_-com) nanoparticles were provided by US Research Nanomaterials Inc. (99.98%). Ultrapure de-ionized water with a resistivity of 18.2 MΩ·cm was obtained from a Purelab Flex3 water purification system (ELGA, UK).
Synthesis of NiOx nanostructures
2.2
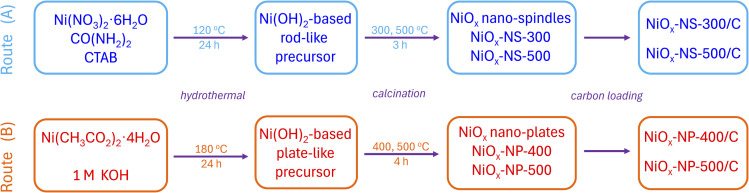
NiO_x_ nanocrystals with NS and NP morphologies were synthesized via hydrothermal and annealing routes by controlling the nickel precursors, pH regulation, and the use of CTAB,^19–21^ as illustrated in Scheme 1. NiO_x-NS was obtained through urea-assisted hydrolysis combined with surfactant-directed anisotropic growth, whereas NiOx-NP was formed via direct KOH precipitation under strongly alkaline conditions using KOH. In the urea-assisted route (Route A), gradual pH evolution during hydrothermal treatment promotes the formation of hydroxide-based precursors, while CTAB, known to selectively adsorb on specific crystal facets and to stabilize surfaces with compatible surface energies,^19–21^ acts as a structure-directing agent, promoting anisotropic growth.^7^ In contrast, direct pH control with KOH (Route B) enables rapid precipitation of nickel hydroxide precursors, leading to the formation of NiOx_-NP nanocrystals.
Schematic illustration of the synthesis routes for generating NiOx nanostructures. (A) NiOx nano-spindles (NiOx-NS) and (B) NiOx nano-plates (NiOx-NP).
Details of NiOx nano-spindle synthesis and catalyst preparation
2.2.1
NiO_x-NS samples were synthesized via a modified hydrothermal method adapted from previous work.^22^ In brief, 1.450 g of Ni(NO_3)2·6H_2_O, 0.600 g of urea, and 0.911 g of CTAB were dissolved in 200 mL of ultrapure water under continuous stirring. The solution was transferred to a Teflon-lined stainless-steel autoclave and heated at 120 °C for 24 h. After naturally cooling to room temperature, the resulting precipitate was separated and washed three times using a 1 : 1 (v/v) mixture of ultrapure water and ethanol, followed by centrifugation. The collected solids were dried in a vacuum oven at 60 °C for 24 h and subsequently calcined in air at 300 °C or higher temperatures for 3 h. This process yielded NiO_x_ with a well-defined nano-spindle morphology.
A measured amount of NiO_x-NS was ultrasonically dispersed in 5 mL of hexane and then added to a pre-sonicated suspension of carbon black (Ketjenblack EC600JD) in ethanol. The formulation was adjusted to achieve an estimated NiOx_ loading of 60 wt% on carbon. The combined suspension underwent an additional 2 h of sonication and was left to settle overnight. The mixture was then centrifuged to remove the supernatant, and the resulting solid was air-dried. The final product, consisting of carbon-supported NiO_x_ nano-spindles, is denoted as NiO_x-NS/C. For example, NiOx-NS-300/C and NiOx-NS-500/C refer to NiOx_ nano-spindles on carbon calcined at 300 °C and 500 °C for 3 h, respectively.
Details of NiOx nanoplate synthesis and catalyst preparation
2.2.2
NiO_x-NP samples were synthesized via a two-step process. First, Ni(OH)2 nanoplates were prepared using a hydrothermal method adapted from the literature.^23^ Specifically, 0.107 g of Ni(CH_3_CO_2)2·4H_2_O was dissolved in 50 mL of ultrapure water, followed by the addition of 1 mL of 1 M KOH to raise the pH to ∼13. The solution was transferred to a Teflon-lined autoclave and heated at 180 °C for 24 h. After cooling to room temperature, the supernatant was removed, and the precipitate was washed three times with a 3 : 1 (v/v) mixture of ultrapure water and ethanol. The product was collected by centrifugation and air-dried. In the second step, the resulting Ni(OH)2 nanoplates were calcined in air at 400 °C and 500 °C for 4 h in a tube furnace, producing NiO_x_ nanoplates labeled as NiO_x-NP-400 and NiOx_-NP-500, respectively.
Each of the NiO_x-NP sample was then loaded on Ketjenblack EC600JD by following the same procedure used for NiOx-NS/C. The resulting carbon-supported materials are designated as NiOx-NP-400/C and NiOx_-NP-500/C, corresponding to their respective calcination temperatures.
Working electrode preparation and electrochemical measurements
2.3
To prepare the catalyst ink, 5 mg of NiO nanocrystals were dispersed in a mixture containing 1.0 mL of acetone and 20.0 µL of 5% Nafion® solution, followed by ultrasonication for 1 h to achieve uniform dispersion. Subsequently, 30.0 µL of the ink was drop-cast onto a pre-cleaned glassy carbon (GC) rotating disk electrode (RDE) (5 mm diameter; Pine Research Instrumentation) and allowed to dry at room temperature.
Electrochemical measurements were conducted at room temperature on a Gamry 1000 E workstation using a standard three-electrode setup. The working electrode was a GC RDE coated with the carbon-supported catalyst, while a saturated Ag/AgCl (4 M KCl) electrode and a graphite rod served as the reference and counter electrodes, respectively. All potentials were converted to the reversible hydrogen electrode (RHE) scale using ERHE = EAg/AgCl + 1.0258 (V), and the OER overpotential was calculated as EOER = ERHE − 1.23(V).
Perovskite precursor solution preparation
2.4
A 1.5 M Cs_0.05_FA_0.84_MA_0.11_Pb(I_0.985_Br_0.015_)3 perovskite precursor solution was prepared by mixing 6.55 mg of MABr, 16.93 mg of MAI, 19.49 mg of CsI, 216.68 mg of FAI, 746.8 mg of PbI_2,_ and 8.1 mg of MACl in 1 mL of DMF : DMSO (4 : 1 v/v) solvent mixture. The solution included 8% excess PbI_2_ and MACl to promote improved perovskite crystallization and film formation. After stirring overnight, the solution was filtered using a 0.22 µm PTFE syringe filter before use.
Fabrication of perovskite solar cells
2.5
Fluorine-doped tin oxide (FTO) coated glass substrates (2.5 × 2.5 cm^2^) were washed with detergent and deionized water before being sonicated for 5 min each in acetone and IPA. The substrates were then dried using a nitrogen stream and treated with UV-ozone for 30 min. For PCE assessment, NiO_x_ inks were prepared by dispersing 15 mg of the respective NiO_x_ nanomaterials in 1 mL of a 1 : 1 (v/v) IPA: ethanol solvent mixture. These inks were statically spin-coated onto the cleaned FTO substrates at 4000 rpm for 30 s, followed by thermal annealing on a hot plate at 140 °C for 10 min under ambient conditions. Subsequent device fabrication was performed inside a nitrogen-filled glovebox maintained at <1 ppm O_2_ and <5 ppm H_2_O. The perovskite layer was deposited using a two-step spin-coating process. The precursor solution was statically dispensed and spin-coated at 1000 rpm for 10 s, followed by 5000 rpm for 25 s. During the final 10 s of the second spin step, 300 µL of chlorobenzene was dripped onto the rotating substrate to induce rapid crystallization. The resulting film was immediately annealed on a hot plate at 100 °C for 1 h, yielding a uniform, black, mirror-like perovskite film. A 15 nm layer of C_60_ was then deposited via thermal evaporation as the electron transport layer. This was followed by dynamic spin-coating of a 5 nm BCP layer (0.5 mg mL^−1^ in IPA) at 5000 rpm for 20 s and subsequent annealing at 80 °C for 5 min. Finally, an 80 nm Ag top electrode was thermally evaporated under ultrahigh vacuum (∼10^−7^ Torr), completing the device architecture.
Current–voltage characterization of the solar cell
2.6
Current–voltage (J–V) measurements were performed using a Keithley 4200-SCS semiconductor characterization system in conjunction with a solar simulator (Photo Emission Tech) under standard AM1.5 G illumination at 100 mW cm^−2^. The voltage was swept in the reverse direction at a scan rate of 0.01 V s^−1^. The active area of each tested device was 0.09 cm^2^.
Other characterization methods
2.7
X-ray diffraction (XRD) patterns were recorded using a PANalytical X'pert Pro diffractometer equipped with a Cu K_α1_ radiation source. Transmission electron microscopy (TEM) was performed on a JEOL 2100 F microscope operated at 200 kV. For TEM characterization, nanocrystal samples (without carbon support) were dispersed in hexane and drop-cast onto TEM grids, followed by cleaning to remove residual organics. Thermogravimetric analysis (TGA) was carried out under a nitrogen atmosphere using a TA Instruments Q50 system (TA-Q50 Thermo Balance), with samples heated from room temperature to 500 °C at 10 °C min^−1^. Raman spectra were acquired using a DXR Raman microscope (Thermo Scientific) equipped with a 532 nm excitation laser, operated at a power of 2 mW. High-resolution TEM (HRTEM) was performed on Thermo Fisher Talos 200X.
Computational methods
2.8
All the spin-polarized Density Functional Theory (DFT) calculations were performed using the Vienna Ab initio Simulation Package (VASP) code.^24^ The projector augmented wave (PAW)^25^ method was used to describe the interaction between the frozen core and free valence electrons. Perdew–Burke–Ernzerhof (PBE) exchange–correlation function,^26^ within generalized gradient approximation (GGA) calculations, along with semiempirical D3 dispersion correction, for van der Waal's interaction, was used for all the calculations.^27,28^ The cutoff energy of structure optimization was set to 450 eV throughout the simulation. A vacuum of 18 Å was added along the direction normal to the catalyst surface to avoid the error due to self-interaction among periodic slabs. A Monkhorst–Pack grid of 5 × 5 × 1 k-point mesh was used to sample the Brillouin zone for NiO(001) surface. The structural relaxation was performed iteratively until the energy and force criteria converged to 10^−5^ eV and 10^−2^ eV Å^−1^. The Hubbard U parameter (Ueff) of 6.00 eV is used for Ni on NiO.^29^
Considering the four-electron transfer pathway using OH^−^ (alkaline medium) as the active species, the four steps of the OER are described as
where, * represents the active site on the catalyst.
Accordingly, the Gibbs free energy change (ΔG) of each elementary step is given by,
where, Ei = electronic energy (i = intermediates), ZPE_i_ = zero-point energy, and TS_i_ = entropic correction of the surface adsorbed species.
Results and discussion
Morphology-controlled synthesis and characterization of NiOx
3.1.
Thermal transformation of hydroxide precursors with different morphologies was examined by TGA and derivative thermogravimetry (DTG), as shown in Fig. S1. The NiO_x-NS precursor from Route (A) exhibited two major mass losses at ∼300 °C (∼13.72 wt%) and ∼340 °C (∼30.86 wt%) (Fig. S1a), attributed to CTAB-assisted conversion to NiOx_ followed by formation of non-stoichiometric phases at higher temperature. In contrast, the NiO_x-NP precursors from Route (B) began losing mass at ∼250 °C, indicating lower thermal stability, with a sharp loss between 275 and ∼300 °C marking the onset of NiOx_-NP formation (Fig. S1b).
The crystallinity of carbon-supported NiO_x_ samples calcined at different temperatures was further examined by XRD (Fig. 1). NiO_x-NS fully crystallized at 300 °C after 3 h calcination (NiOx-NS-300/C), whereas NiOx-NP required ≥400 °C for 4 h to achieve complete crystallization. Clear NiO diffraction peaks were observed for NiOx-NS-300/C, while NP precursors treated at 300 °C retained the hexagonal Ni(OH)2 phase with no detectable NiO reflections (XRD pattern not shown). Complete phase transformation was achieved for carbon-supported NP samples calcined for 4 h at 400 °C (NiOx-NP-400/C) and 500 °C (NiOx-NP-500/C), both showing well-defined cubic NiO diffraction patterns (ICDD PDF 65-2901). The rhombohedral NiO phase is excluded by the absence of characteristic peak splitting at 2θ = 37.24–37.30° and 62.84–62.92° (ICDD PDF 89-3080), consistent with HRTEM (vide infra). These results indicate that NiOx-NS crystallizes fully at a lower temperature, whereas NiOx_-NP requires higher calcination temperatures, with all final products adopting the cubic phase.
XRD patterns of carbon-supported NiOx-NS-300/C, NiOx-NP-400/C, NiOx-NP-500/C, along with the reference pattern for cubic NiO (ICDD PDF 65-2901).
Fig. 2 compares the morphologies of the hydroxide precursors obtained from both synthetic routes and their corresponding free-standing NiO_x_ nanostructures. Route (A) yields clustered nanowires (∼25 nm in diameter and 80–100 nm in length, Fig. 2a), which transform into nano-spindles (NiO_x-NS-300) after calcination at 300 °C for 3 h (Fig. 2b). Each NS consists of multiple polycrystalline NiOx_ domains composed of 5–7 nm primary crystallites (also see Fig. 3a), in good agreement with the crystalline size of 5.6 nm estimated from the Scherrer equation^30^ based on (200) peak broadening (1.5114°) in Fig. 1. In contrast, Route (B) produces monodisperse hexagonal platelets with well-defined edges, ∼60 nm in lateral size and <8 nm in thickness (Fig. 2c). Subsequent calcination at 500 °C for 4 h (NiO_x-NP-500) results in a mixture of large- and small-area NiOx_ nanoplates with reduced thickness (Fig. 2d).
TEM images of Ni(OH)2 precursors and the resulting NiOx nanostructures. (a) As-synthesized Ni(OH)2-based nano-spindle precursor (Route A); (b) NiOx nano-spindles obtained by annealing the Ni(OH)2 nano-spindles at 300 °C for 3 h (e.g., NiOx-NS-300); (c) As-synthesized Ni(OH)2-based nano-plate precursor (Route B); and (d) NiOx nano-plates obtained by annealing the Ni(OH)2 nano-plates at 500 °C for 4 h (e.g., NiOx-NP-500).
High-resolution TEM (HRTEM) analysis and selected area electron diffraction (SAED) patterns. (a–d), HRTEM image of pristine NiOx-NS-300: (a) HRTEM image; (b) zoomed-in view of the region marked by the blue box, showing measured lattice spacing; (c) corresponding diffractogram of the zoomed-in area; (d) SAED pattern. (e–h), Corresponding HRTEM observations for pristine NiOx-NP-500: (e), overview image; (f) zoomed-in view with lattice spacing; (g) diffractogram; (h) SAED pattern.
HRTEM was employed to examine the crystallographic structure of pristine NiO_x_ samples prepared without carbon support. For NiO_x-NS-300, well-defined lattice fringes are observed (Fig. 3a and b), with an interplanar spacing of ∼0.24 nm derived from the fast Fourier transform (FFT) diffractogram (Fig. 3c), consistent with the (111) lattice spacing of cubic NiO (d111 = 2.4217 Å, ICDD PDF 65-2901). The corresponding selected area electron diffraction (SAED) pattern (Fig. 3d) confirms a single-phase cubic structure. A similar analysis of NiOx-NP-500 (Fig. 3e–h) reveals pronounced lattice fringes, indicative of high crystallinity. The magnified region (Fig. 3f) shows an interplanar spacing of ∼0.24 nm corresponding to the {111} planes of cubic NiO, with the nanoplate oriented along the [011] zone axis. This suggests that the exposed edges of NiOx-NP-500 correspond to {111} and {200} facets (Fig. 3f), and the basal surface of the nanoplate is most likely parallel to the {110} facet. This structural assignment is supported by the FFT diffractogram (Fig. 3g), which resolves the {111} reflections, and by the SAED pattern (Fig. 3h), which exhibits sharp diffraction spots characteristic of single-phase cubic NiO. The consistent lattice spacings and diffraction features observed for both NiOx-NS-300 and NiOx-NP-500 confirm their high crystallinity and a cubic phase, regardless of synthesis route. Nevertheless, the distinct morphologies and local structure features indicate synthesis-dependent microstructural variations that may influence physical properties. The distinct NiOx_ crystallization observed for the two types of precursors (Fig. 1 and S1) can be attributed to differences in precursor domain size and NiO_x_ evolution pathways. Specifically, NS precursors consist of thin nanowires (∼25 nm in diameter) that fragment into discrete small nanocrystals during conversion to NiO_x, whereas NP precursors comprise larger platelets (∼25 nm in lateral size) and undergo comparatively limited structural reorganization. The higher surface energy associated with the NS precursors consequently lowers the thermal energy barrier for phase transformation, enabling NiOx_ crystallization at lower calcination temperatures than required for NP precursors.
Raman spectroscopy was used to probe optical phonon modes and defects in both NiO_x-NS-300 and NiOx-NP-500 (Fig. S2). The NiOx-NS-300 spectrum (Fig. S2a) shows peaks at 345–355, 520–530, 740–750, and 1070–1080 cm^−1^, corresponding to the one-phonon transverse optical (TO), one-phonon longitudinal optical (LO), second-order transverse optical (2TO), and second-order longitudinal optical (2LO) modes, respectively,^31–34^ consistent with NiO nanorods (30–80 nm) previously reported.^35^ Defect-induced lattice symmetry breaking activates otherwise forbidden modes. Accordingly, a feature near 250 cm^−1^ within the one-phonon band is attributed to defect-induced phonons associated with lattice distortion and vacancies.^36–38^ In contrast, NiOx_-NP-500 (Fig. S2b) exhibits only two dominant peaks at 490–500 and 1060–1070 cm^−1^, assigned to the LO^36^ and 2LO^39^ modes, respectively. The absence of TO and defect-related modes indicates a lower defect concentration in nano-plates, likely arising from their planar morphology and implying distinct material properties relative to nano-spindles.
OER performance
3.2.
OER polarization curves of the NiO_x_ catalysts, measured in 1 M KOH using a three-electrode configuration with a GC RDE, are shown in Fig. 4a. At 10 mA cm^−2^, NiO_x-NS-300/C, NiOx-NP-400/C, and NiOx-NP-500/C exhibited overpotentials of 395 mV, 565 mV, and 474 mV vs. RHE, respectively (Fig. 4b). Among nanoplate catalysts, NiOx-NP-500/C outperformed NiOx_-NP-400/C, indicating enhanced OER activity with higher calcination temperature.
OER performance of NiOx-NS-300/C, NiOx-NP-400/C, and NiOx-NP-500/C. (a) Polarization curves (current density vs. potential) recorded in 1 M KOH at an electrode rotation speed of 1600 rpm. The horizontal dashed line indicates the benchmark current density of 10 mA cm−2, used to evaluate the OER overpotential; (b) OER overpotentials of three catalysts at a current density of 10 mA cm−2 1 M KOH; (c) Tafel slopes of three catalysts obtained from (a–d) chronoamperometry plots showing current density vs. time for NiOx-NS-300/C (at 1.625 V vs. RHE), NiOx-NP-400/C (at 1.855 V vs. RHE), and NiOx-NP-300/C (at 1.665 V vs. RHE), measured in 1 M KOH at a rotation speed of 1600 rpm using an RDE for a duration of 1 h.
In alkaline media, OER proceeds via a four-electron transfer mechanism,^40^ with overpotential largely governed by OH^−^ adsorption.^4^ The lower overpotential of NiO_x-NS-300/C indicates weaker OH^−^ adsorption (Fig. 4a),^41–43^ which contributes to its superior activity. As evidenced in Fig. 3 and S2, this behavior is attributed to the tensile strain induced by oxygen vacancies^44^ and inter-crystal defects,^45^ as well as exposure of high-index facets that increase active sites^46^ and promote favorable OH^−^ adsorption–desorption kinetics,^47^ consistent with its low Tafel slope of 68 mV dec^−1^ (Fig. 4c). The spindle morphology further enhances accessible surface area and charge/mass transport.^48,49^ In contrast, NiOx-NP predominantly exposes low-index facets (Fig. 3f), such as {111} surfaces, which are known to bind intermediates more strongly and limit activity.^50^ The fraction of more active {001} facets is therefore significantly lower in NiOx-NP than in NiOx_-NS-300, explaining the higher overpotentials of the nanoplate catalysts.
Despite their similar morphologies, NiO_x-NP-400/C and NiOx-NP-500/C exhibit markedly different OER performance. NiOx-NP-400/C shows a higher overpotential and larger Tafel slope (565 mV at 10 mA cm^−2^, 131 mV dec^−1^) than NiOx-NP-500/C (474 mV, 73 mV dec^−1^, Fig. 4b and c), indicating stronger OH^−^ adsorption and slower kinetics. DFT calculations on NiO(001) surfaces (Fig. 5) reveal that tensile strain can reduce the theoretical overpotential from 1.03 V (unstrained) to 0.59 V at 5% strain, indicating a strain-assisted lowering of the rate-limiting barrier. Experimentally, however, NiOx-NP-500/C, which is expected to have less tensile strain, exhibits a lower overpotential than NiOx-NP-400/C. This discrepancy suggests that no strain exists and/or the dominant exposed facets in NiOx-NP may not be the highly active {001} facets,^50^ but rather less active facets such as {011}, consistent with HRTEM analysis. Interestingly, the NiOx-NS system shows lower overpotentials and relatively consistent behavior across calcination temperatures. At 10 mA cm^−2^, the OER overpotentials for NiOx-NS-300/C (395 mV) and NiOx-NS-500/C (364 mV) are very close (Fig. S3), with only a slight decrease for the higher-temperature sample, despite the theoretical prediction that NiOx-NS-300/C should exhibit a lower OER overpotential still not being observed. These results confirm that the spindle-like NiOx_-NS morphology provides superior intrinsic activity and that its OER performance is largely insensitive to calcination temperature, highlighting its advantage for efficient water oxidation.
Free energy diagram of OER on NiO(001), calculated using first-principles Density Functional Theory (DFT) method.
Chronoamperometry tests (Fig. 4d) conducted for 1 h at 1600 rpm in 1 M KOH, at 1.625 V (NiO_x-NS-300/C), 1.855 V (NiOx-NP-400/C), and 1.665 V (NiOx-NP-500/C) vs. RHE, corresponding to their respective 10 mA cm^−2^ overpotentials, reveal distinct stability trends. NiOx-NP-500/C shows stable, gradually increasing current, indicating excellent durability and possible in situ activation, whereas NiOx-NP-400/C undergoes rapid current decay. NiOx-NS-300/C exhibits only a minor decline, indicating superior stability relative to NiOx_-NP-400/C. These trends are attributed to electrochemically active surface area (ECSA) stabilization and degradation dynamics under forced convection, which enhances oxygen removal but may accelerate catalyst dissolution and ECSA loss. Although no visible dissolution was observed, further analyses are required to confirm Ni leaching. Overall, these results demonstrate that morphology and stoichiometry critically govern both OER activity and durability, underscoring the importance of coordinated structural design and thermal processing in Ni-based oxide electrocatalysts.
Photovoltaic performance
3.3.
To further assess morphology-dependent NiO_x_ performance as HTLs, NiO_x-NS-300 and NiOx-NP-500 were incorporated into PSCs, with a commercial NiOx_ (NiO_x_-com) used as a reference. This comparison is intended to evaluate relative HTL performance under identical testing conditions, rather than to achieve the maximum absolute PCE. Consequently, the measurements were performed without exhaustive optimization, although state-of-the-art PSC architectures and processing were employed.
Fig. 6 presents the device structure (Fig. 6a) and PV performance (Fig. 6b) of PSCs using different NiO_x-based HTLs. J–V curves and box-and-whisker plots reveal that NiOx-NS-300 delivers the highest efficiency among the tested devices. As shown in Fig. 6b and c, the best NiOx-NS-300-based PSC achieved a PCE of 13.25%, with an open-circuit voltage (Voc) of 0.91 V, a short-circuit current density (Jsc) of 25.19 mA cm^−2^, and a fill factor (FF) of 58.1%. In comparison, the best NiOx-NP-500 device reached a PCE of 9.25%, with Voc = 0.93 V, Jsc = 23.34 mA cm^−2^, and FF = 42.8%), while the NiOx_-com device achieved 11.88% (Voc = 0.98 V, Jsc = 23.36 mA cm^−2^, FF = 51.5%).
Photovoltaic (PV) performance of perovskite solar cells (PSCs) incorporating different NiOx as hole transport layers (HTLs). (a) Schematic of the inverted PSC architecture using nanostructured NiOx as the HTL; (b) J–V curves of the best-performing devices based on NiOx-NS-300, NiOx-NP-500, and commercial NiOx (NiOx-com); (c) box-and-whisker plots, summarizing the short-circuit current density (Jsc), open-circuit voltage (Voc), fill factor (FF), and power conversion efficiency (PCE) of devices with different NiOx-based HTLs.
The superior performance of NiO_x-NS-300 arises primarily from enhanced Jsc and FF, indicating more efficient hole extraction at the NiOx/perovskite interface, improved interfacial contact, favorable energy-level alignment, and higher bulk conductivity.^51,52^ Ink photographs (Fig. S4) show that NiOx-NS-300 exhibits a darker (black) coloration than NiOx-NP-500 and NiOx-com, suggesting a distinct Ni oxidation state^53^ associated with stronger p-type character and improved conductivity.^54^ Additionally, the narrower PCE distribution for NiOx_-NS-300-based devices indicates improved HTL uniformity, enabling more consistent layer deposition and enhanced device reproducibility.
Although OER catalysis and hole transport in PSCs operate through distinct mechanisms and performance metrics, both functions are strongly governed by NiO_x_ morphology. In OER, spindle-like NiO_x_ benefits from defect-rich surfaces, favorable facet exposure, lattice strain effects, and enhanced charge-transport pathways, which collectively facilitate intermediate adsorption and accelerate reaction kinetics; whereas in PSCs, these same characteristics promote enhanced hole hopping transport and more efficient hole extraction at the NiO_x/perovskite interface. This comparison highlights that morphology-induced structural features can simultaneously optimize NiOx_ performance across electrochemical and photovoltaic applications.
Conclusions
In conclusion, NiO_x_ nanostructures with spindle- and plate-like morphologies were synthesized via controlled hydrothermal and annealing processes, enabling a systematic evaluation of morphology-dependent properties. The spindle-like NiO_x, which crystallized at a lower temperature (300 °C), exhibited superior OER activity, delivering lower overpotentials (395 mV vs. 565 and 474 mV at 10 mA cm^−2^) and smaller Tafel slopes (68 mV dec^−1^vs. 131 and 73 mV dec^−1^) than NiOx_ nanoplates calcined at 400 and 500 °C, respectively, together with enhanced operational stability. Beyond electrocatalysis, spindle-like NiO_x_ also demonstrated superior performance as a hole transport layer in perovskite solar cells, achieving higher device efficiency and improved uniformity compared with plate-like NiO_x_ and commercial NiO_x_ specimens. The best spindle-like NiO_x-based device reached a power conversion efficiency of 13.25% (Voc = 0.91 V, Jsc = 25.19 mA cm^−2^, FF = 58.1%), exceeding those using a plate-like NiOx-based device or the commercial benchmark. The distinct crystallization behaviors from the two types of precursors are attributed to differences in their microstructures, while the enhanced OER and photovoltaic performance of spindle-like NiOx_ is ascribed to favorable facet exposure, tensile strain, higher defect density, and enhanced interfacial charge transport, as supported by structural characterization and DFT analysis. Overall, this work highlights morphology control and thermal optimization as effective strategies to tailor phase transformation, electrocatalytic activity, and charge-transport properties, providing guidance for the design of multifunctional NiO_x_ materials for water oxidation and perovskite photovoltaic applications.
Author contributions
P. B., C. L., and B. R. performed synthesis and device fabrication. P. B., C. L., B. R., L. Z., A. M., K. K., M. N., and T.B. carried out characterization and data curation. A. P. and S. K. conducted computation and modeling. P. B., C. L., B. R., L. Z., J. D., and A. M. conducted formal analysis. T. D., S. K., and J. F. contributed to supervision, funding acquisition, and conceptualization. P. B., B. R., J. F., S. K., and T. D. prepared the original draft. All authors reviewed, edited, and approved the final manuscript.
Conflicts of interest
There are no conflicts to declare.
Supplementary Material
RA-016-D6RA00607H-s001
The reference list from the paper itself. Each links out to its DOI / PubMed record.
- 1Liu S. Wei Y. Wang M. Shen Y. Coord. Chem. Rev.2025522216190
- 2Yu Z.-Y. Duan Y. Feng X.-Y. Yu X. Gao M.-R. Yu S.-H. Adv. Mater.202133200710010.1002/adma.20200710034117808 · doi ↗ · pubmed ↗
- 3Hu C. Zhang L. Gong J. Energy Environ. Sci.20191226202645
- 4Suntivich J. May K. J. Gasteiger H. A. Goodenough J. B. Shao-Horn Y. Science 2011334138313852203351910.1126/science.1212858 · doi ↗ · pubmed ↗
- 5Nardi K. L. Yang N. Dickens C. F. Strickler A. L. Bent S. F. Adv. Energy Mater.201551500412
- 6Babar P. T. Lokhande A. C. Gang M. G. Pawar B. S. Pawar S. M. Kim J. H. J. Ind. Eng. Chem.201860493497
- 7Silva V. D. Simões T. A. Grilo J. P. F. Medeiros E. S. Macedo D. A. J. Mater. Sci.20205566486659
- 8Li X. Ge L. Du Y. Huang H. Ha Y. Fu Z. Lu Y. Yang W. Wang X. Cheng Z. ACS Nano 202317681168213694314410.1021/acsnano.3c 00387 · doi ↗ · pubmed ↗