Combined Impact of Smoking Duration and Malnutrition on Cancer Survival: Insights Into Systemic Inflammation
Hong Zhao, Bing Yin, Zhe Zhao, Xiangrui Li, Changhong Xu, Yi Li, Zhaoting Bu, Xinyin Chen, Hanping Shi

TL;DR
This study shows that both smoking and malnutrition worsen cancer survival, with their combined effect being especially harmful due to increased inflammation.
Contribution
The study reveals a dose-response relationship between smoking duration and malnutrition on cancer mortality and links it to systemic inflammation.
Findings
Smoking and malnutrition independently increase cancer mortality risk, with the highest risk in patients with both factors.
Prolonged smoking and worsening malnutrition are associated with elevated levels of inflammatory markers like CRP and WBC.
Every additional 5 years of smoking increases mortality risk by 6%, and 10 years of smoking increases it by 86% in malnourished patients.
Abstract
Smoking and malnutrition are established risk factors for cancer survival, yet evidence on their combined effects remains limited. This study aimed to investigate the joint impact of smoking duration and malnutrition on overall survival (OS) in patients with solid tumours and to explore the potential underlying mechanism—systemic inflammation. This study was based on the Investigation of Nutrition Status and Clinical Outcomes in Common Cancers (INSCOC), which enrolled 29 988 patients with solid tumours and collected data on smoking status, nutritional status assessed by the Patient‐Generated Subjective Global Assessment (PG‐SGA) and haematological indicators. Restricted cubic spline regression, Cox proportional hazards models and logistic regression were used to examine the associations of smoking and malnutrition with OS and their relationships with inflammatory markers. A total of…
Genes, proteins, chemicals, diseases, species, mutations and cell lines named across the full text — each resolved to its canonical identifier and authoritative record.
Click any figure to enlarge with its caption.
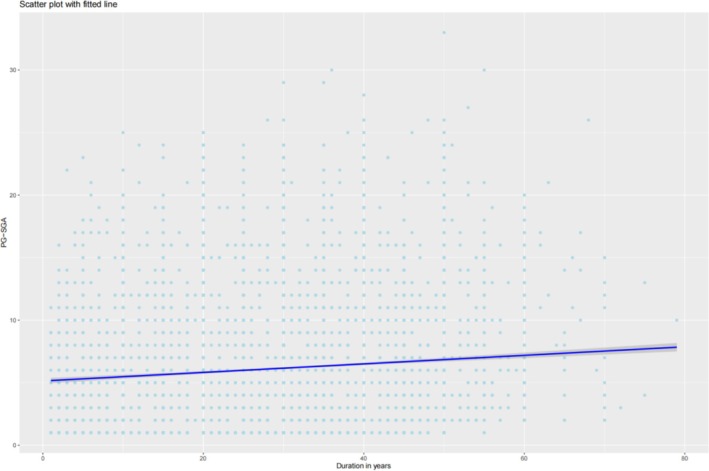 FIGURE 1
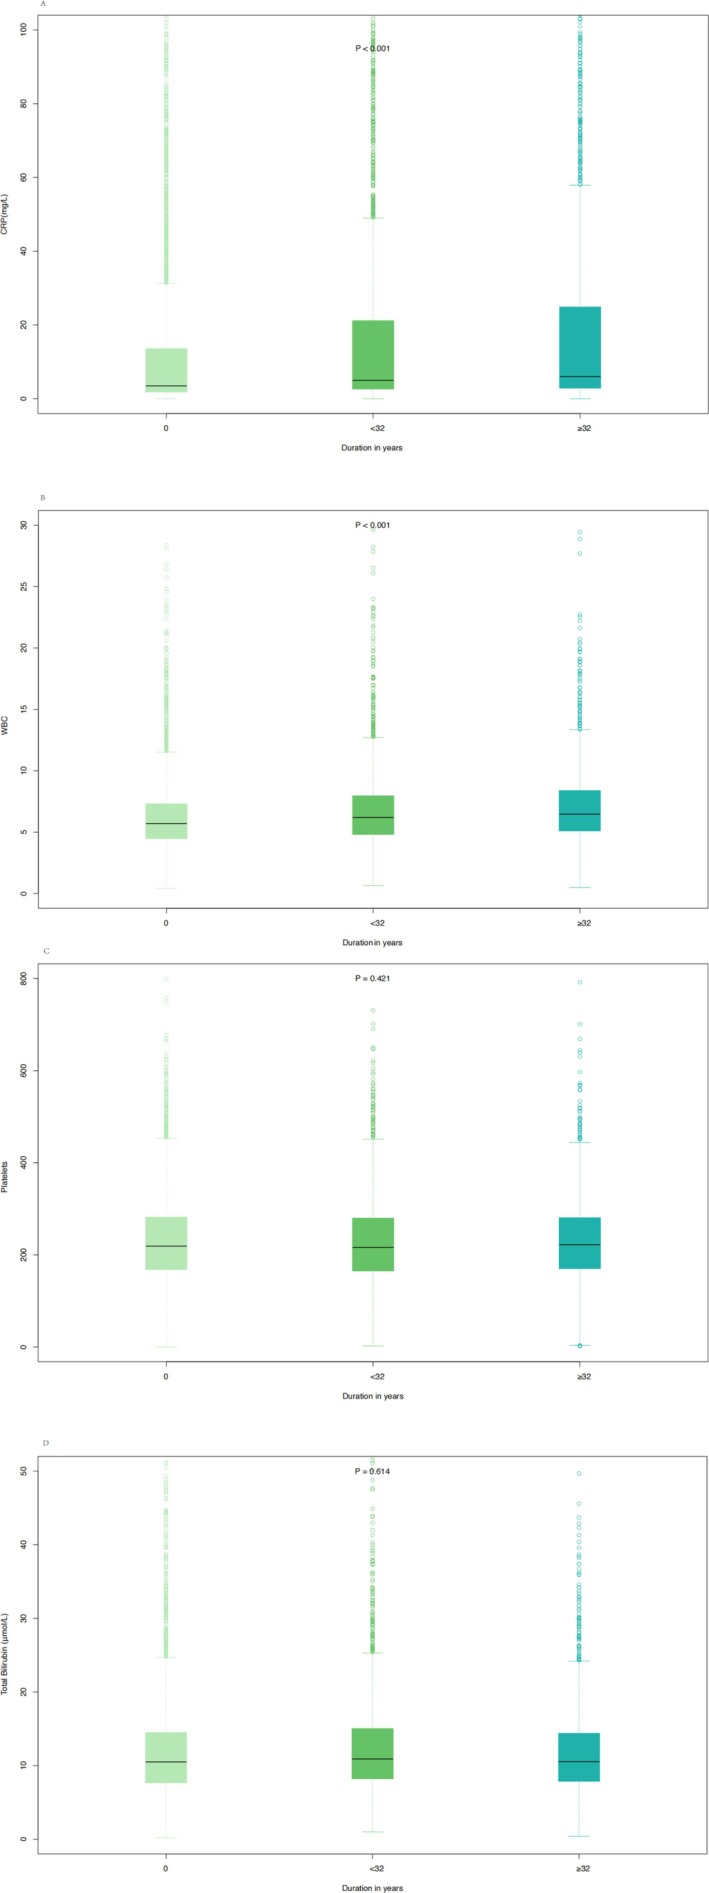 FIGURE 2
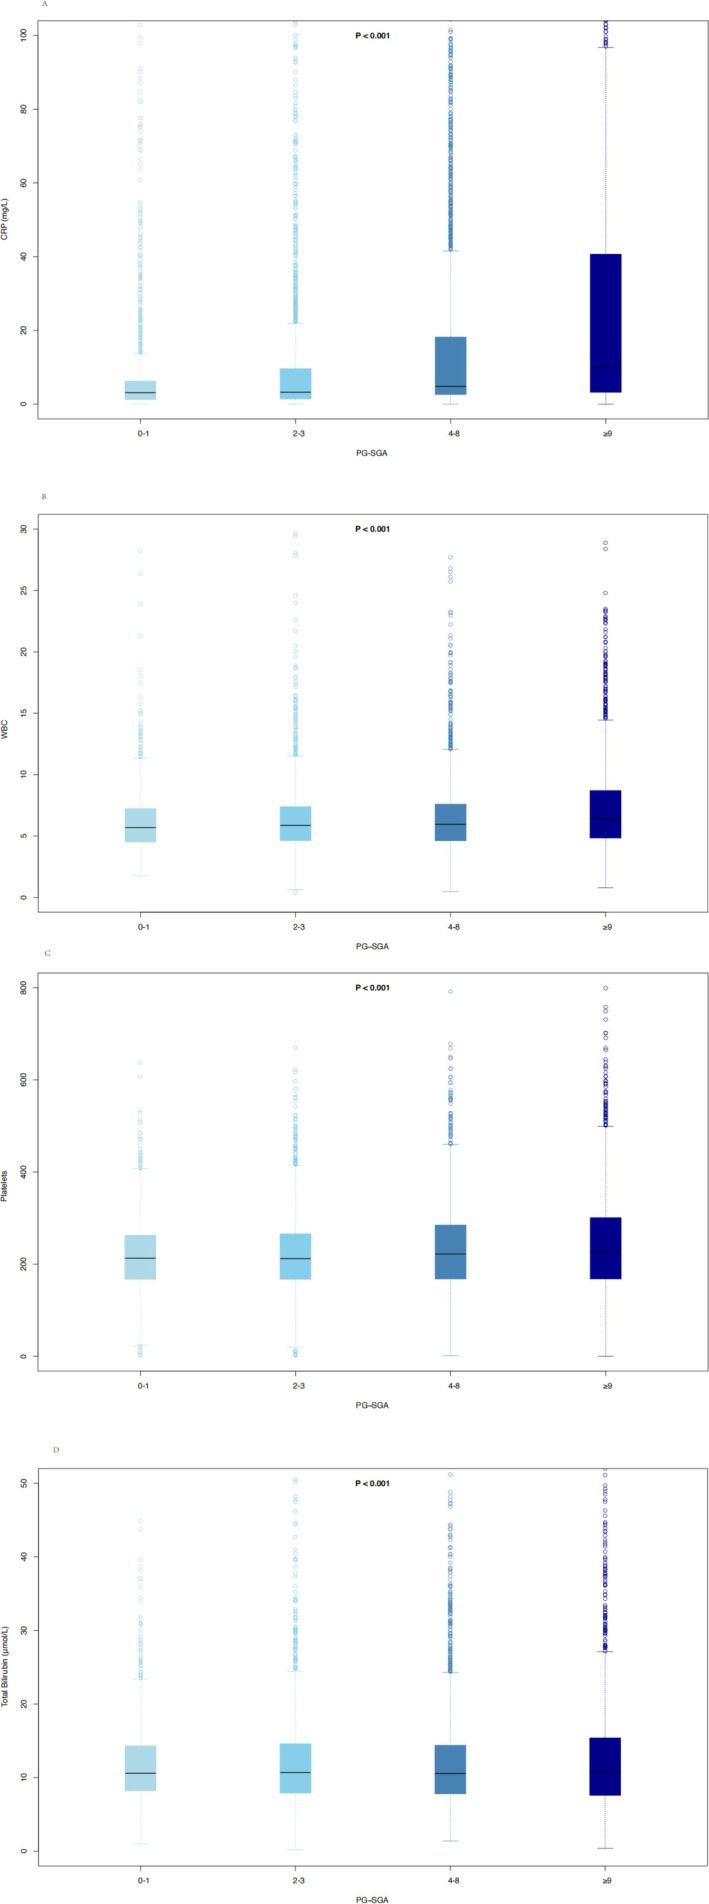 FIGURE 3
| Characteristics |
Patients, no. (%) No smoking ( |
Patients, no. (%) Smoking ( |
| ||
|---|---|---|---|---|---|
| No malnutrition ( | Malnutrition ( | No malnutrition ( | Malnutrition ( | ||
| Sex | |||||
| Male | 2093 (25.5) | 2944 (31.3) | 4350 (91.8) | 7095 (92.8) | < 0.001 |
| Female | 6107 (74.5) | 6454 (68.7) | 391 (8.2) | 554 (7.2) | |
| Age (mean [SD]) | 53.10 (11.45) | 57.13 (12.41) | 56.95 (10.31) | 60.17 (10.57) | < 0.001 |
| Smoking | |||||
| No | 8200 (100.0) | 9398 (100.0) | 0 (0.0) | 0 (0.0) | < 0.001 |
| Yes | 0 (0.0) | 0 (0.0) | 4741 (100.0) | 7649 (100.0) | |
| Packs (median [IQR]) | 0.00 [0.00, 0.00] | 0.00 [0.00, 0.00] | 1.00 [0.57, 1.00] | 1.00 [0.57, 1.00] | < 0.001 |
| Duration in years (median [IQR]) | 0.00 [0.00, 0.00] | 0.00 [0.00, 0.00] | 30.00 [20.00, 40.00] | 30.00 [20.00, 40.00] | < 0.001 |
| Pack‐year (median [IQR]) | 0.00 [0.00, 0.00] | 0.00 [0.00, 0.00] | 30.00 [14.29, 40.00] | 30.00 [15.00, 42.86] | < 0.001 |
| Cancer types | |||||
| Nasopharyngeal carcinoma | 747 (9.1) | 371 (3.9) | 621 (13.1) | 413 (5.4) | < 0.001 |
| Digestive system cancers | 2195 (26.8) | 4880 (51.9) | 1617 (34.1) | 4372 (57.2) | |
| Lung cancer | 1487 (18.1) | 1713 (18.2) | 1991 (42.0) | 2522 (33.0) | |
| Breast cancer | 2380 (29.0) | 1069 (11.4) | 116 (2.4) | 91 (1.2) | |
| Genitourinary system cancers | 1319 (16.1) | 1281 (13.6) | 361 (7.6) | 208 (2.7) | |
| Malignant brain tumours | 72 (0.9) | 84 (0.9) | 35 (0.7) | 43 (0.6) | |
| TNM | |||||
| I | 1139 (16.8) | 974 (12.7) | 485 (12.6) | 584 (9.4) | < 0.001 |
| II | 2001 (29.6) | 1771 (23.1) | 800 (20.7) | 1207 (19.5) | |
| III | 2011 (29.7) | 2441 (31.8) | 1336 (34.6) | 2107 (34.0) | |
| IV | 1613 (23.8) | 2489 (32.4) | 1241 (32.1) | 2293 (37.0) | |
| Surgery | |||||
| No | 6250 (76.2) | 6821 (72.6) | 3704 (78.1) | 5544 (72.5) | < 0.001 |
| Yes | 1950 (23.8) | 2577 (27.4) | 1037 (21.9) | 2105 (27.5) | |
| Chemotherapy | |||||
| No | 3833 (46.7) | 4731 (50.3) | 2044 (43.1) | 3871 (50.6) | < 0.001 |
| Yes | 4367 (53.3) | 4667 (49.7) | 2697 (56.9) | 3778 (49.4) | |
| Radiotherapy | |||||
| No | 7214 (88.0) | 8448 (89.9) | 4074 (85.9) | 6725 (87.9) | < 0.001 |
| Yes | 986 (12.0) | 950 (10.1) | 667 (14.1) | 924 (12.1) | |
| BMI (mean [SD]) | 23.62 (3.26) | 21.87 (3.48) | 23.31 (3.15) | 21.47 (3.27) | < 0.001 |
| PG‐SGA | |||||
| < 4 | 8200 (100.0) | 0 (0.0) | 4741 (100.0) | 0 (0.0) | < 0.001 |
| ≥ 4 | 0 (0.0) | 9398 (100.0) | 0 (0.0) | 7649 (100.0) | |
| COPD | |||||
| No | 8180 (99.8) | 9350 (99.5) | 4663 (98.4) | 7513 (98.2) | < 0.001 |
| Yes | 20 (0.2) | 48 (0.5) | 78 (1.6) | 136 (1.8) | |
|
| |||||
| No | 7681 (93.7) | 8624 (91.8) | 4338 (91.5) | 7051 (92.2) | < 0.001 |
| Yes | 519 (6.3) | 774 (8.2) | 403 (8.5) | 598 (7.8) | |
| Hypertension | |||||
| No | 7036 (85.8) | 7637 (81.3) | 3921 (82.7) | 6260 (81.8) | < 0.001 |
| Yes | 1164 (14.2) | 1761 (18.7) | 820 (17.3) | 1389 (18.2) | |
| Occupation | |||||
| Mental labour | 1221 (14.9) | 1088 (11.6) | 624 (13.2) | 858 (11.2) | < 0.001 |
| Physical labour | 2489 (30.4) | 3373 (35.9) | 1742 (36.7) | 2947 (38.5) | |
| Retirement and other | 4490 (54.8) | 4937 (52.5) | 2375 (50.1) | 3844 (50.3) | |
| All | Model 0 | Model 1 | Model 2 | |||||
|---|---|---|---|---|---|---|---|---|
| HR (95% CI) |
| HR (95% CI) |
| HR (95% CI) |
| |||
| No smoking and no malnutrition | 1 [reference] | No smoking and no malnutrition | No smoking and no malnutrition | |||||
| No smoking and malnutrition | 1.39 (1.32, 1.46) | < 0.001 | No smoking and malnutrition | 1.26 (1.19, 1.34) | < 0.001 | No smoking and malnutrition | 1.25 (1.17, 1.33) | < 0.001 |
| Smoking and no malnutrition | 1.55 (1.45, 1.65) | < 0.001 | Smoking and no malnutrition | 1.25 (1.16, 1.35) | < 0.001 | Smoking and no malnutrition | 1.24 (1.15, 1.35) | < 0.001 |
| Smoking and malnutrition | 1.93 (1.83, 2.04) | <0.001 | Smoking and malnutrition | 1.49 (1.38, 1.59) | < 0.001 | Smoking and malnutrition | 1.46 (1.36, 1.57) | < 0.001 |
| Male | ||||||||
| No smoking and no malnutrition | 1 [Reference] | No smoking and no malnutrition | No smoking and no malnutrition | |||||
| No smoking and malnutrition | 1.32 (1.2, 1.45) | < 0.001 | No smoking and malnutrition | 1.28 (1.16, 1.43) | < 0.001 | No smoking and malnutrition | 1.27 (1.14, 1.41) | < 0.001 |
| Smoking and no malnutrition | 1.27 (1.16, 1.38) | < 0.001 | Smoking and no malnutrition | 1.22 (1.11, 1.35) | < 0.001 | Smoking and no malnutrition | 1.22 (1.1, 1.35) | < 0.001 |
| Smoking and malnutrition | 1.57 (1.45, 1.7) | < 0.001 | Smoking and malnutrition | 1.46 (1.33, 1.6) | < 0.001 | Smoking and malnutrition | 1.44 (1.31, 1.58) | < 0.001 |
| Female | ||||||||
| No smoking and no malnutrition | 1 [Reference] | No smoking and no malnutrition | No smoking and no malnutrition | |||||
| No smoking and malnutrition | 1.4 (1.31, 1.49) | < 0.001 | No smoking and malnutrition | 1.23 (1.15, 1.33) | < 0.001 | No smoking and malnutrition | 1.22 (1.13, 1.32) | < 0.001 |
| Smoking and no malnutrition | 1.43 (1.18, 1.74) | < 0.001 | Smoking and no malnutrition | 1.33 (1.06, 1.67) | 0.012 | Smoking and no malnutrition | 1.32 (1.06, 1.66) | 0.015 |
| Smoking and malnutrition | 2.01 (1.74, 2.32) | < 0.001 | Smoking and malnutrition | 1.71 (1.45, 2.01) | < 0.001 | Smoking and malnutrition | 1.71 (1.45, 2.01) | < 0.001 |
- —National Key Research and Development Program10.13039/501100012166
- —Laboratory for Clinical Medicine, Capital Medical University
- —Nation Multidisciplinary Cooperative Diagnosis and Treatment Capacity Project for Major Diseases: Comprehensive Treatment and Management of Critically Ill Elderly Inpatients
Peer Reviews
No public reviews on file for this paper yet. If you reviewed it on a platform where reviews are public (OpenReview, ICLR, NeurIPS, ICML), you can paste yours below so the community can read it here.
Videos
No videos yet. Explain this paper in a talk, walkthrough, or lecture? Add one.
Taxonomy
TopicsInflammatory Biomarkers in Disease Prognosis · Nutrition and Health in Aging · Cancer Risks and Factors
Introduction
1
Cancer is the second leading cause of death globally [1]. In the United States, over 4 million cancer deaths have been avoided since 1991 due to the reduction in smoking, early detection of certain cancers and improvements in adjuvant and metastatic treatment options [2]. In China, lung cancer has become the leading cause of cancer‐related deaths, with smoking being the most important factor contributing to cancer mortality [3]. Cancer is a large category of various malignant tumours, the causes of which, either in whole or in part, are due to factors that individuals and governments can control through their choices. These factors include smoking and alcohol consumption, obesity, low intake of fruits and vegetables, lack of physical exercise and sun exposure. Therefore, if more people avoid these factors, a significant portion of the impact of cancer can be alleviated [4]. Despite the continuous advancement of cancer treatment technologies, patient survival rates are still affected by various complications, with smoking being a prominent modifiable independent risk factor [5, 6].
Smoking is a widely prevalent and highly harmful habit. The smoke produced by burning tobacco contains various harmful substances, including nicotine, tar and carbon monoxide [7]. Smoking reduces the effectiveness of most widely used cancer treatments, including immunotherapy, radiation therapy and chemotherapy [8]. Gemine et al.'s research found that smoking cessation was independently and significantly associated with improved survival in non–small cell lung cancer, regardless of its stage [9]. Among smokers, complete smoking cessation is still the most effective way to prevent cancer and cardiovascular diseases [10].
The causes of cancer‐related malnutrition are complex and are caused by malignant tumours that induce a systemic pro‐inflammatory state [11]. Malnutrition is associated with worse clinical outcomes in cancer patients [12]. Smoking is a risk factor for nutritional status in cancer patients [13]. On the one hand, smoking causes changes in taste and smell, reducing patients' appetite and food intake [14]. On the other hand, smoking is linked to a higher risk of sarcopenia [15].
Tumour‐associated inflammation is a characteristic of nearly all cancers, and inflammation is a recognized hallmark of cancer, significantly contributing to the development and progression of malignant tumours [16, 17]. Studies further show that the tumour microenvironment, mainly coordinated by inflammatory cells, plays an essential role in tumour progression, promoting proliferation, survival and migration. Inflammatory mediators and cellular effectors are vital components of the tumour's local environment [18, 19]. Smoking‐related oxidative stress induces inflammation, leading to further production of reactive oxygen species, which may increase oxidative damage to macromolecular targets, thus contributing to the initiation and/or progression of cancer [20]. Smoking can damage immune cell function and provoke inflammatory reactions, thereby promoting cancer progression [21].
Notably, smoking and malnutrition do not exist in isolation but may interact with and reinforce each other as risk factors. Smoking not only causes direct damage to the body through carcinogenic substances but also suppresses appetite, alters taste and smell and induces oxidative stress, inflammation and metabolic disorders [22], thereby potentially increasing the risk of malnutrition. A previous study demonstrated that paternal smoking was associated with an increased risk of malnutrition in children [23]. Smoking history has been identified as a significant risk factor associated with malnutrition in patients with stroke [24]. C‐reactive protein (CRP) is an important acute‐phase protein that reflects systemic inflammation, and its elevation is commonly observed in cancer patients with systemic inflammatory states [25]. CRP levels were significantly higher in malnourished patients compared with well‐nourished patients, indicating enhanced systemic inflammation in the malnourished group [26]. Malnutrition significantly reduces antioxidant levels and impairs T‐cell activity and NF‐κB regulatory function, thereby rendering the body more susceptible to oxidative stress [27]. Both factors converge through a shared pathological mechanism involving inflammation, leading to elevated pro‐inflammatory cytokines, increased oxidative damage and enhanced immunosuppression, thereby jointly promoting tumourigenesis and progression and shortening patient survival. However, most previous studies have examined smoking or malnutrition separately, and evidence regarding their potential synergistic effects via inflammatory pathways remains limited. Whether their coexistence exerts a stronger detrimental impact on cancer survival is still unclear. Therefore, this multicentre prospective cohort study aimed to evaluate whether smoking and malnutrition act in concert at the inflammatory level and whether their combined effect is more detrimental to patient outcomes than either factor alone.
Methods
2
Research Design and Participants
2.1
This study was based on the Investigation of Nutrition Status and Clinical Outcomes in Common Cancers (INSCOC), a multicentre prospective cohort study conducted in China since 2013. The study aimed to systematically collect clinical, nutritional and follow‐up data from cancer patients to evaluate the impact of nutritional status on clinical outcomes. The detailed study design and methodology have been previously published [28]. Inclusion criteria comprised patients aged ≥ 18 years with a pathological diagnosis of breast cancer, biliary tract carcinoma, bladder carcinoma, cervical cancer, colorectal cancer, endometrial cancer, oesophageal cancer, gastric cancer, liver cancer, lung cancer, malignant brain tumours, nasopharyngeal carcinoma, ovarian cancer, pancreatic cancer or prostate cancer. Exclusion criteria included severe infection, immunodeficiency, concurrent malignancies, incomplete serological data, serious cardiopulmonary comorbidities and lack of follow‐up. For individuals who were admitted multiple times during the study period, only data from the first hospitalization were collected. Written informed consent was obtained from all participants. The study was conducted in accordance with the principles of the Declaration of Helsinki. All participating centres and institutions received approval from the relevant Ethics Committee (registration no.: ChiCTR1800020329; ethics approval number: Medical Research Ethics Review [2013] 82). The Ethics Committee overseeing the study was the Medical Ethics Committee of the First Affiliated Hospital of Sun Yat‐sen University.
Assessment of Demographic Characteristics and Haematological Measurements
2.2
Data collection began at baseline, within 48 h of hospital admission. Baseline assessments were carried out by trained investigators using specialized equipment. Current smokers were defined as individuals who had smoked more than 100 cigarettes in their lifetime and who reported smoking either daily or occasionally at the time of the survey [29]. The specific smoking history was obtained through self‐report or from the patient's relatives, including the average number of packs smoked per day and the duration of smoking in years. The Patient‐Generated Subjective Global Assessment (PG‐SGA) is a nutritional assessment method adapted by Ottery for cancer patients [30]. Malnutrition was defined as a PG‐SGA score of 4 or greater, and the PG‐SGA has been widely used in studies of malnutrition among cancer patients in China [13]. Based on nutritional assessment, PG‐SGA scores were further categorized into four groups: 0–1 as normal, 2–3 as mild malnutrition, 4–8 as moderate malnutrition and ≥ 9 as severe malnutrition [31]. Within 24 h of hospital admission, patients underwent routine laboratory tests, including platelet count, total lymphocyte count and levels of haemoglobin, albumin, total protein, creatinine, CRP and other relevant markers, all of which were analysed by the clinical laboratories of the participating hospitals.
Outcomes and Covariates
2.3
The endpoint of this study was overall survival (OS), which was defined as the time from cancer diagnosis to death or the last follow‐up (30 June 2022).
Covariates included sex, age, TNM, cancer types, surgery, chemotherapy, radiotherapy, occupation and BMI.
Statistical Analysis
2.4
All data, whether normally distributed or not, were presented as means with standard deviations (SDs) or medians with interquartile ranges (IQRs), and comparisons between groups were made using t‐tests, analysis of variance tests or Mann–Whitney U tests. Categorical variables were presented as number and percentage and were compared between groups using the χ2 test. A restricted cubic spline regression model was used to analyse the relationship between PG‐SGA, smoking (packs, duration in years, pack‐years) and OS in cancer patients. Cox proportional hazards models were employed to examine the relationship between smoking, nutritional status and OS, with results presented as hazard ratios (HRs) and 95% confidence intervals (CIs). Multivariable logistic regression analyses were used to explore the relationship between smoking and malnutrition in cancer patients, with results presented as odds ratios (ORs) and 95% CIs. Univariable and multivariable Cox proportional hazards models were used to analyse haematological markers influencing OS in cancer patients. The box plot was used to illustrate the distribution differences in inflammatory markers' concentrations across different PG‐SGA scores and smoking durations. To assess the reliability of the results, sensitivity analyses were conducted. All statistical analyses were conducted using R software, Version 4.2.0 (R Project for Statistical Computing). A two‐sided p‐value of less than 0.05 was regarded as statistically significant.
Results
3
Basic Characteristics of Patients With Solid Tumours
3.1
A total of 29 988 patients with solid tumours were included in this study (Figure S1). Among them, 8200 were non‐smokers with no malnutrition, 9398 were non‐smokers with malnutrition, 4741 were smokers with no malnutrition, and 7649 were smokers with malnutrition (Table 1). In the smoking group, males accounted for more than 90% (91.8% in the no malnutrition group, 92.8% in the malnutrition group), whereas in the non‐smoking group, females made up more than 50% (74.5% in the no malnutrition group, 68.7% in the malnutrition group). In the smoking group, the average age of patients with malnutrition was significantly higher than that of those without malnutrition (60.17 years vs. 56.95 years), and the overall age of the smoking group was higher than that of the non‐smoking group. Regardless of smoking status, the average age of patients with malnutrition was higher than that of those without malnutrition.
Smoking and Malnutrition
3.2
Figure S2 showed that OS decreased as PG‐SGA scores increased in cancer patients. Figure S3 showed that longer smoking duration was associated with worse OS in cancer patients, and the restricted cubic spline regression curve illustrated a clear dose–response relationship. In Model 2 of Table 2, compared to the reference group of non‐smokers with no malnutrition (HR = 1), the death risk for non‐smokers with malnutrition increased by 25% (HR = 1.25, 95% CI 1.17–1.33, p < 0.001); for smokers with no malnutrition, the death risk increased by 24% (HR = 1.24, 95% CI 1.15–1.35, p < 0.001); and for smokers with malnutrition, the death risk increased by 46% (HR = 1.46, 95% CI 1.36–1.57, p < 0.001). Similar results were observed in both males and females. Table S1 revealed that compared to non‐smokers, smokers had a higher incidence of malnutrition (OR = 1.15, 95% CI 1.08–1.24, p < 0.001), and this result was observed in both males and females. Among the smokers, the threshold for smoking packs was 1, and for smoking duration, it was 22 (Figure S5). Due to fewer female smokers, a separate analysis was done for the female group, where the threshold for smoking packs was 0.1 and the threshold for smoking duration was 39 (Figure S6). The risk of malnutrition for short smoking duration and heavy packs increased significantly by 13% compared to the reference group (non‐smokers) (OR = 1.13, 95% CI 1.01–1.27, p = 0.033), whereas the risk for long duration and light packs showed a higher increase (OR = 1.19, 95% CI 1.06–1.34, p = 0.003), suggesting that long‐term smoking has a more lasting impact on malnutrition (Table S2). Long‐term smoking posed a greater risk for malnutrition in females (OR = 3.68, 95% CI 1.26–13.46, p = 0.027).
The Association Between Smoking Duration and OS
3.3
Figure S7 showed that, among smoking cancer patients, OS gradually decreased with increasing smoking duration. Table S3 was the baseline table for patients based on the smoking duration tertiles (T1: 0–20, T2: 20–32, T3: ≥ 32). Among smokers with solid tumours, each 5‐year increase in smoking duration was associated with a 6% higher risk of death (HR = 1.06, 95% CI 1.04, 1.07, p < 0.001); the risk for the high‐duration group (≥ 22 years) was 31% higher compared to the reference group (HR = 1.31, 95% CI 1.21–1.41, p < 0.001); using T1 group as the reference, the risk for T3 group increased by 40% (HR = 1.40, 95% CI 1.26–1.57, p < 0.001), and trend analysis confirmed that the risk increased with longer smoking duration (p for trend < 0.001). These results held true for both males and females (Table S4). Figure S8 showed that longer smoking duration was associated with progressively shorter OS among participants with malnutrition. Figure S9 showed that in participants with malnutrition, the threshold value for smoking duration was 25. Table S5 was the baseline table for patients based on smoking duration tertiles (T1: 0, T2: 0–20, T3: ≥ 20). Table S6 presented the analysis of the relationship between smoking duration and OS in malnourished patients with solid tumours. The findings indicated that regardless of covariate adjustments, longer smoking duration significantly increased the death risk in these patients. Specifically, in the fully adjusted model (Model 2), each additional 10 years of smoking was associated with an 86% higher risk of death (HR = 1.86, 95% CI 1.55–2.23, p < 0.001). When grouped by smoking duration, the long‐duration group (≥ 25 years) had a significantly higher death risk compared to the reference group (HR = 1.24, 95% CI 1.16–1.32, p < 0.001), and when T1 group was used as a reference, the risk in the T3 group increased by 25% (HR = 1.25, 95% CI 1.16–1.35, p < 0.001). Gender stratification showed that this increased risk was present in both male and female patients, with a more significant risk increase in females. Sensitivity analysis also confirmed the robustness of the above results (Tables S11 and S12).
The Connection Between Smoking, Malnutrition and Inflammation
3.4
Figure 1 illustrated that longer smoking duration was associated with higher PG‐SGA scores. Figure S10 indicated that 9065 patients with complete haematological data were included. Table S7 presented baseline characteristics stratified by smoking duration tertiles, revealing a significant increase in median CRP levels (from 3.50 to 6.00 mg/L) and a rising trend in WBC count (from 5.70 × 10^9^/L to 6.47 × 10^9^/L) with increasing smoking duration. Table S8 summarized the baseline characteristics according to PG‐SGA categories and showed that as nutritional status worsened, both CRP and WBC levels increased markedly (CRP from 3.11 to 10.00 mg/L; WBC from 5.70 × 10^9^/L to 6.39 × 10^9^/L). In smoking populations, univariate and multivariate Cox regression analyses (Table S9) identified CRP, WBC, platelet count and total bilirubin as risk factors for OS. Similarly, in malnourished populations, Cox regression analyses (Table S10) demonstrated that albumin, CRP, WBC, platelet count and total bilirubin were risk factors for OS. Figure 2 showed that with increasing smoking duration, CRP levels (median [IQR]) rose progressively (3.50 [1.79–13.60]; 5.00 [2.60–21.20]; 6.00 [2.87–24.90]), and WBC levels increased correspondingly (5.70 [4.47–7.31]; 6.20 [4.80–7.97]; 6.47 [5.10–8.40]), whereas platelet count and total bilirubin showed no significant increasing trend across smoking groups. Figure 3 demonstrated that higher PG‐SGA scores were associated with significantly elevated CRP (3.11 [1.23–6.28]; 3.23 [1.40–9.62]; 4.83 [2.60–18.20]; 10.00 [3.20–40.70]) and WBC levels (5.70 [4.51–7.24]; 5.88 [4.63–7.40]; 5.95 [4.62–7.60]; 6.39 [4.84–8.71]), whereas platelet count and bilirubin concentrations showed no significant increasing trend. Mediation analyses (Figure S12) indicated that CRP accounted for 4.7% and WBC for 6.3% of the association between smoking and mortality. In the association between malnutrition and mortality (Figure S13), CRP mediated 9.1% and WBC mediated 4.4%.
Scatter plot with fitted line of PG‐SGA and duration in years in patients with solid tumours.
The box plot of haematological indicators in smoking patients.
The box plot of haematological indicators in malnutrition patients.
Discussion
4
This study comprehensively examined the joint effects of smoking and malnutrition on OS in patients with solid tumours, addressing limitations of previous single‐factor analyses. Using a large cohort of nearly 30 000 patients, we demonstrated that both smoking and malnutrition independently predicted worse prognosis, and the highest risk of mortality was observed when both were present. A clear dose–response relationship was observed for smoking duration, and inflammatory markers such as CRP and WBC partially mediated these associations. These findings highlight the synergistic role of smoking and malnutrition in promoting systemic inflammation and adverse clinical outcomes.
The results indicated that both smoking and malnutrition independently raised the death risk, and their combination resulted in an even higher death risk. These findings are consistent with prior research. Phua et al. found that, compared to those who never smoked, both former and current smokers had an elevated risk of smoking‐related second primary cancers [32]. Park et al. found that by effectively controlling smoking at both the population and individual levels in Korean men, around one‐third of cancer deaths could be prevented [33]. Smoking, recognized as one of the primary risk factors for cancer, has been extensively proven to elevate the risk of cancer and decrease the treatment effectiveness and survival rates of cancer patients [33, 34].
Regarding the Association Between Smoking and Overall Mortality
4.1
We found that longer smoking duration was associated with an increased risk of death, showing a clear dose–response relationship. Patients with extended smoking histories exhibited significantly higher mortality, suggesting that long‐term smoking served as an adverse prognostic factor in cancer survival. This finding is consistent with previous studies. Kwan et al. found that longer duration and more pack‐years of cigarette smoking were associated with a higher risk of recurrence of non‐muscle‐invasive bladder cancer [35]. Doll et al. found that among men born around 1920, long‐term smoking in adulthood doubled the mortality rate in specific age groups, but quitting smoking at age 50 reduced this risk by half, and quitting at age 30 could nearly eliminate the risk [36].
The role of inflammation in cancer progression has been widely studied. Our research found that both smoking duration and malnutrition were associated with elevated inflammation markers such as CRP and WBC count, suggesting that inflammation may be one of the mechanisms by which smoking and poor nutritional status jointly shorten survival. Smoking‐related oxidative stress can exacerbate the inflammatory response, further promoting cancer development and progression [21]. Myburgh et al. found that active smokers with the rs3093068 C allele had an increased risk of elevated CRP concentrations [37]. Berania et al. found that active smokers had significantly higher WBC counts compared to never smokers and former smokers [38]. The development of cancer malnutrition also causes a further increase in inflammation levels in the body. Gomes de Lima et al. found that patients with weight loss and malnutrition had significantly higher serum CRP levels compared to patients without weight loss and in good nutritional status [39]. Xie et al. found that a high IBI (C‐reactive protein × neutrophil/lymphocyte ratio) is an independent high‐risk factor influencing cancer patients' physical condition, malnutrition, cachexia and short‐term prognosis [40]. Therefore, shortening smoking duration and improving nutritional status may help reduce tumour‐related inflammation levels and enhance patient survival.
The impact of smoking and malnutrition on the OS of cancer patients has been reported in many studies. However, this study provides a detailed and in‐depth investigation of the combined effect of smoking (packs, duration in years, pack‐year) and malnutrition on the OS of cancer patients and explores the underlying mechanism of increased inflammation levels, guiding clinical control of inflammation in cancer patients with smoking and malnutrition. These findings suggest that cancer patients with both smoking exposure and poor nutritional status may particularly benefit from anti‐inflammatory interventions, highlighting the need for targeted management strategies in this high‐risk population. The limitations are as follows: (1) Haematological data were limited, and other inflammatory markers related to smoking or malnutrition still needed to be investigated. (2) The biological mechanisms of inflammation underlying smoking and malnutrition required further exploration.
Conclusion
5
Smoking and malnutrition are important factors affecting the survival of cancer patients. Our findings highlight the importance of intervening in smoking duration and improving nutritional status in the management of cancer patients. It also guides clinical control of CRP and WBC inflammation levels in smokers with malnutrition.
Funding
This work was supported by the National Key Research and Development Program (2022YFC2009600, 2022YFC2009601), Laboratory for Clinical Medicine, Capital Medical University (2023‐SYJCLC01) and Nation Multidisciplinary Cooperative Diagnosis and Treatment Capacity Project for Major Diseases: Comprehensive Treatment and Management of Critically Ill Elderly Inpatients (No. 2019.YLFW) to Dr Hanping Shi.
Ethics Statement
The study was conducted in accordance with the principles of the Declaration of Helsinki. All participating centers and institutions received approval from the relevant Ethics Committee (Registration No.: ChiCTR1800020329; Ethics approval number: Medical Research Ethics Review [2013] 82). The Ethics Committee overseeing the study was the Medical Ethics Committee of the First Affiliated Hospital of Sun Yat‐sen University.
Conflicts of Interest
The authors declare no conflicts of interest.
Disclaimer
The views and conclusions expressed in this study are solely those of the authors and do not necessarily reflect the official policies or positions of the affiliated institutions or funding agencies. This research was conducted independently, and any opinions, findings or conclusions presented are the authors' own.
Supporting information
Figure S1: Flow chart. Figure S2: Association between PG‐SGA scores and all‐cause mortality in patients with solid tumours using a restricted cubic spline regression model among all participants. Figure S3: Association between smoking and all‐cause mortality in patients with solid tumours using a restricted cubic spline regression model among all participants. Figure S4: Prevalence rate of cancer types. Figure S5: Cut‐off value calculation among all smoking participants. Figure S6: Cut‐off value calculation among all smoking female participants. Table S1: The association between smoking status and nutritional condition stratified by sex. Table S2: The association between smoking status and nutritional condition stratified by sex. Figure S7: Association between smoking and all‐cause mortality in patients with solid tumours using a restricted cubic spline regression model among all smoking participants. Table S3: Baseline characteristics of patients with solid tumours among smoking participants, stratified by smoking duration tertiles. Table S4: The association of duration in years with all‐cause mortality in smoking patients with solid tumours. Figure S8: Association between smoking and all‐cause mortality in patients with solid tumours using a restricted cubic spline regression model among all malnutrition participants. Figure S9: Cut‐off value calculation among all malnutrition participants. Table S5: Baseline characteristics of patients with solid tumours among malnutrition participants, stratified by smoking duration tertiles. Table S6: The association of duration in years with all‐cause mortality in malnutrition patients with solid tumours. Figure S10: Flow chart. Figure S11: Cut‐off value calculation among all smoking participants. Table S7: Baseline characteristics of patients with solid tumours, stratified by smoking duration cut‐off values. Table S8: Baseline characteristics of patients with solid tumours, stratified by PG‐SGA score values. Table S9: Univariate and multivariate Cox regression analyses of haematological indicators in smoking populations. Table S10: Univariate and multivariate Cox regression analyses of haematological indicators in malnutrition populations. Table S11: Sensitivity analysis of the association between smoking duration and all‐cause mortality in Smoking Patients. Table S12: Sensitivity analysis of the association between smoking duration and all‐cause mortality in malnutrition patients. Figure S12: Hazard ratios (HR) for all‐cause mortality with 95% confidence intervals are shown for smoking in relation to CRP and WBC. Figure S13: Hazard ratios (HR) for all‐cause mortality with 95% confidence intervals are shown for PG‐SGA in relation to CRP and WBC.
The reference list from the paper itself. Each links out to its DOI / PubMed record.
- 1S. Kiri and T. Ryba , “Cancer, Metastasis, and the Epigenome,” Molecular Cancer 23, no. 1 (2024): 154.39095874 10.1186/s 12943-024-02069-w PMC 11295362 · doi ↗ · pubmed ↗
- 2R. L. Siegel , A. N. Giaquinto , and A. Jemal , “Cancer Statistics, 2024,” CA: A Cancer Journal for Clinicians 74, no. 1 (2024): 12–49.38230766 10.3322/caac.21820 · doi ↗ · pubmed ↗
- 3D. Sun , H. Li , M. Cao , et al., “Cancer Burden in China: Trends, Risk Factors and Prevention,” Cancer Biology & Medicine 17, no. 4 (2020): 879–895.33299641 10.20892/j.issn.2095-3941.2020.0387 PMC 7721090 · doi ↗ · pubmed ↗
- 4S. M. Schwartz , “Epidemiology of Cancer,” Clinical Chemistry 70, no. 1 (2024): 140–149.38175589 10.1093/clinchem/hvad 202 · doi ↗ · pubmed ↗
- 5N. Adler , A. T. Bahcheli , K. C. L. Cheng , et al., “Mutational Processes of Tobacco Smoking and APOBEC Activity Generate Protein‐Truncating Mutations in Cancer Genomes,” Science Advances 9, no. 44 (2023): eadh 3083.37922356 10.1126/sciadv.adh 3083 PMC 10624356 · doi ↗ · pubmed ↗
- 6H. Scherübl , “Smoking Tobacco and Cancer Risk,” Deutsche Medizinische Wochenschrift 146, no. 6 (2021): 412–417.33735927 10.1055/a-1216-7050 · doi ↗ · pubmed ↗
- 7N. L. Benowitz , “Nicotine Addiction,” New England Journal of Medicine 362, no. 24 (2010): 2295–2303.20554984 10.1056/NEJ Mra 0809890 PMC 2928221 · doi ↗ · pubmed ↗
- 8S. Chellappan , “Smoking Cessation After Cancer Diagnosis and Enhanced Therapy Response: Mechanisms and Significance,” Current Oncology 29, no. 12 (2022): 9956–9969.36547196 10.3390/curroncol 29120782 PMC 9776692 · doi ↗ · pubmed ↗