Long-term exposure to ambient particulate matter and its association with Alzheimer’s disease: influencing factors and a systematic review with meta-analysis
Na Zhao, Zhenzhen Chen, Hong Sun

TL;DR
This study finds that long-term exposure to certain air pollutants is linked to a higher risk of Alzheimer's disease, suggesting the need for stricter emission controls.
Contribution
A systematic review and meta-analysis quantifying the association between ambient particulate matter and Alzheimer's disease risk.
Findings
PM2.5, PM10, NO2, and NOx exposure increases Alzheimer's disease risk with statistically significant hazard ratios.
Ozone exposure shows no significant association with Alzheimer's disease due to high heterogeneity.
Subgroup analyses confirm that study design, region, and follow-up duration modify the observed associations.
Abstract
Alzheimer’s disease (AD) poses a pressing public health burden globally. Evidence linking long-term ambient particulate matter exposure to AD risk remains inconsistent, necessitating systematic quantification to inform prevention policies. We searched PubMed, Embase, Web of Science, and Cochrane Library up to September 2025 for cohort studies with ≥1 year of particulate exposure (PM2.5, PM10, NO2, NOx, O3) and incident/diagnosed AD. Quality was assessed via the Newcastle–Ottawa Scale (NOS), with random-effects models pooling hazard ratios (HRs) and 95% CIs; subgroup analyses explored heterogeneity by study design, region, and follow-up duration. Twenty-five high-quality (NOS ≥ 7/9) cohort studies involving over 170 million participants were included. Meta-analyses showed higher AD risk with each 5 μg/m3 increase in PM2.5 (HR = 1.24, 95%CI: 1.10–1.39), 10 μg/m3 in PM10 (HR = 1.16,…
Genes, proteins, chemicals, diseases, species, mutations and cell lines named across the full text — each resolved to its canonical identifier and authoritative record.
Click any figure to enlarge with its caption.
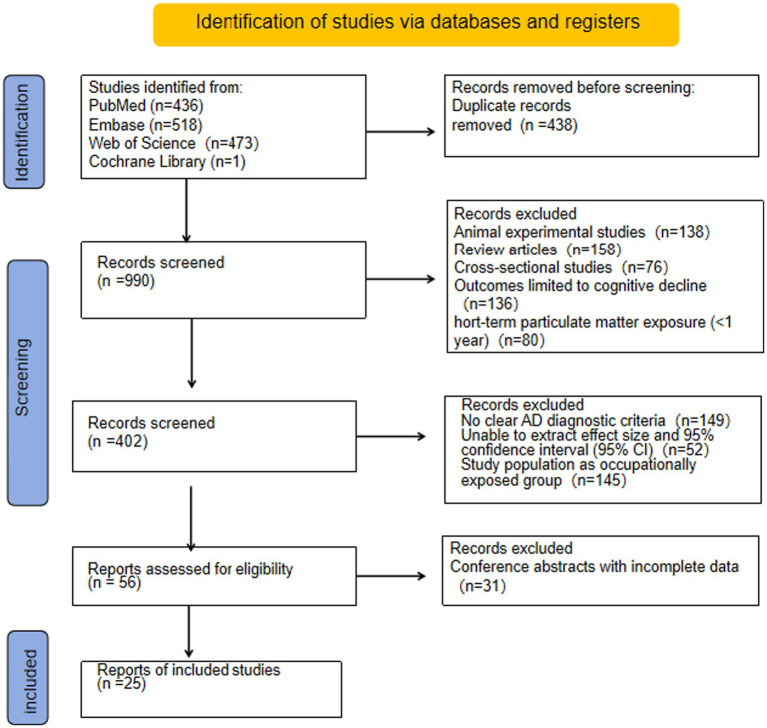 Figure 1
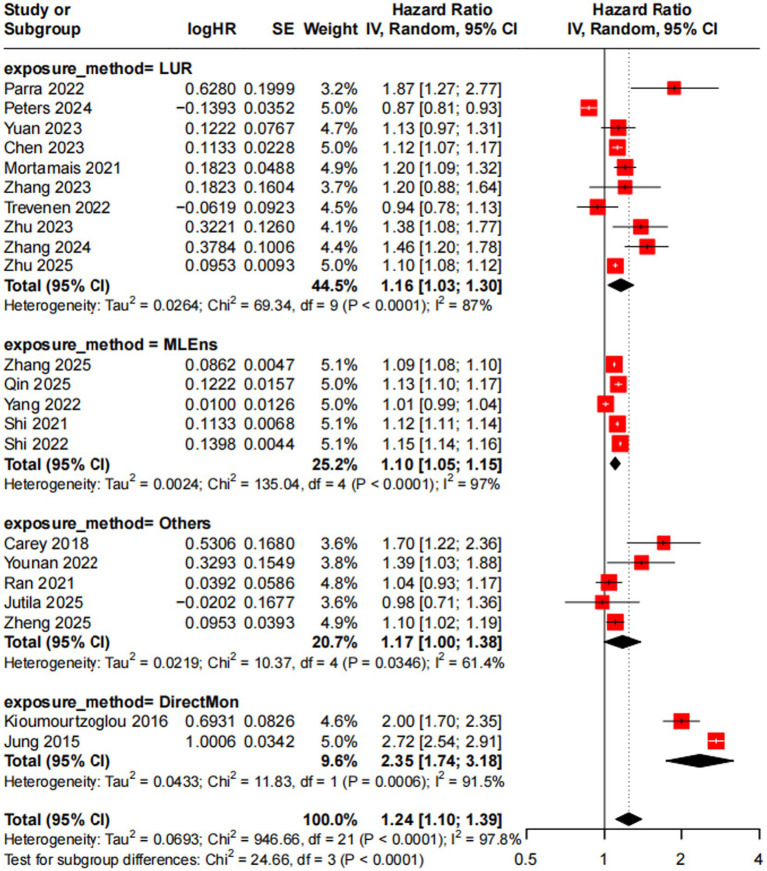 Figure 2
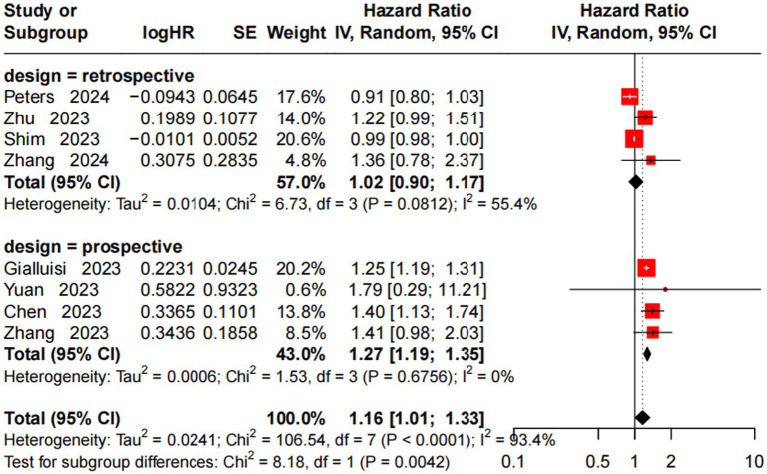 Figure 3
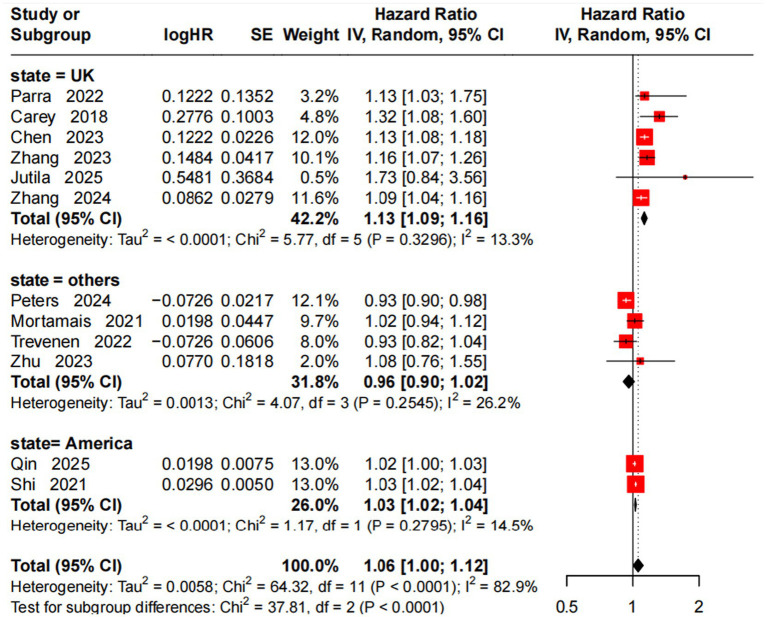 Figure 4
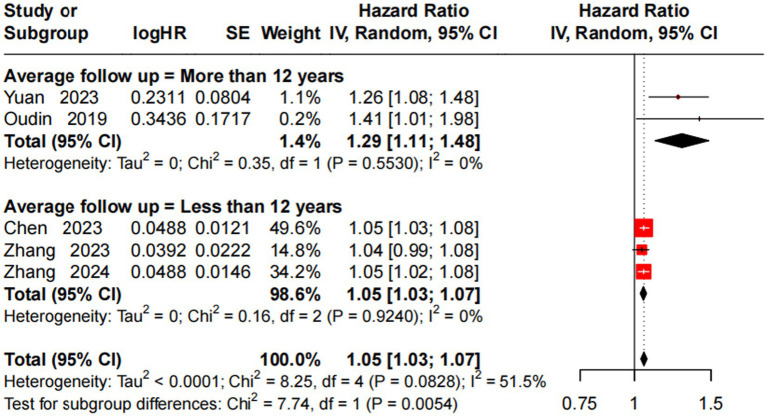 Figure 5
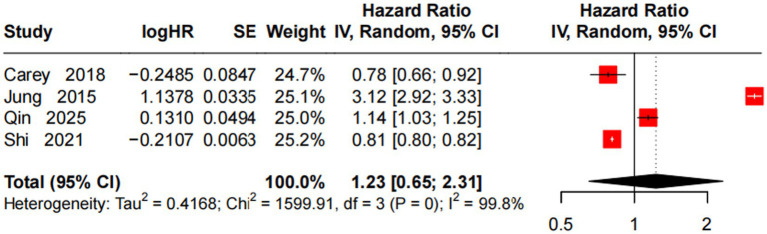 Figure 6
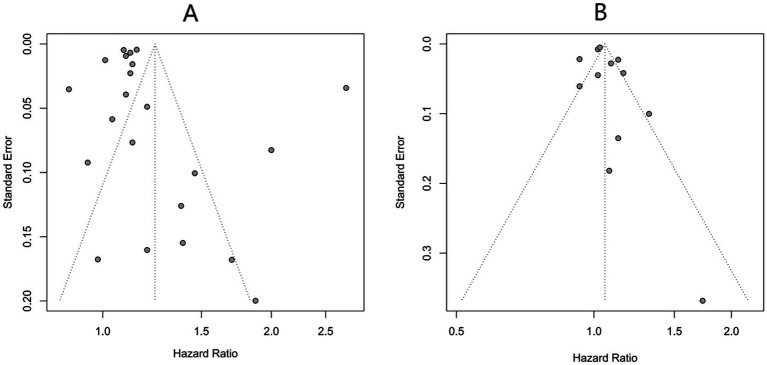 Figure 7
| Dimensions | Inclusion criteria | Exclusion criteria |
|---|---|---|
| Study population (P) |
Adults aged ≥ 50 years (a high-risk population for AD); No diagnosis of AD or definite cognitive impairment at baseline; Clear population source (e.g., community-dwelling population, hospital-based population). |
Individuals with a confirmed diagnosis of AD or other neurodegenerative diseases (e.g., Parkinson’s disease) at baseline; Children, adolescents, or individuals aged < 50 years; Special populations (e.g., occupationally exposed populations, to exclude non-environmental exposure). |
| Exposure factor (I) |
Exposure type: Ambient particulate matter (PM2.5/PM10/etc.); Exposure duration: “Long-term exposure” defined as ≥ 1 year; Exposure assessment: Provision of clear exposure concentration data (e.g., annual average concentration, cumulative exposure); assessment methods include regional monitoring data, satellite retrieval models, and individual exposure monitoring. |
Short-term exposure (exposure duration < 1 year, e.g., acute pollution events); Only mention “air pollution” without specifying the type or concentration of particulate matter; Unreliable exposure assessment methods (e.g., subjective reporting of exposure levels). |
| Outcome indicator (O) |
Primary outcome: “Incidence” or “new diagnosis” of AD; Outcome diagnostic criteria: Adoption of internationally recognized criteria, such as the National Institute on Aging-Alzheimer’s Association (NIA-AA) criteria ( |
Outcome: “Cognitive decline” or “Mild Cognitive Impairment (MCI)” (not confirmed AD); Without clear diagnostic criteria, or AD diagnosis based solely on scale scores (e.g., MMSE); Outcome: AD-related pathological indicators (e.g., |
| Study type (S) | Cohort studies (prospective/retrospective cohorts) within observational studies, from which effect sizes and 95% confidence intervals (CIs) can be extracted. |
Experimental studies (e.g., animal experiments, cell experiments) and review studies (systematic reviews, meta-analyses, commentaries); Cross-sectional studies (unable to determine the temporal relationship between exposure and outcome, which may confuse causality); Conference abstracts and abstract collections (incomplete data, making it impossible to extract effect sizes); Duplicate publications. |
| First author (year) | Study design | State | Participants | Sex | Age (mean ± SD /median) | AD definition | Pollutants |
|---|---|---|---|---|---|---|---|
| Gialluisi et al. (2023) ( | Prospective cohort study | Italy | 24,195 | 12,695 (51.9%) female and 11,500 (48.1%) male | 55.8 ± 12.0 | Self-reported | PM10 |
| Zhang et al. (2023) ( | Prospective cohort study | United Kingdom (UK) | 227,840 | 119,408 (52.4%) female and 108,432 (47.6%) male | 60.1 ± 5.4 | Administrative database | PM2.5, PM2.5-10, PM10, NO2, NOx |
| Jung et al. (2015) ( | Prospective cohort study | Taiwan, China | 95,690 | 44,119 (46.1%) female and 51,571 (53.9%) male | ≥65 | Self-reported | PM2.5, O3 |
| Kioumourtzoglou et al. (2016) ( | Retrospective cohort study | America | 9,800,000 | (57.3%) female and (42.7%) male | 75.6 ± 7.6 | Self-reported | PM2.5 |
| Carey et al. (2018) ( | Retrospective cohort study | UK | 130,978 | 65,848 (50.3%) female and | 50–79 | Self-reported | PM2.5, NO2, O3 |
| Oudin et al. (2019) ( | Retrospective cohort study | Sweden | 1,567 | 880 (56%) female and 687 (44%) male | Median: 69 | Self-reported | NOx |
| Mortamais et al. (2021) ( | Prospective cohort study | France | 7,066 | 4,359 (61.7%) female and 2,707 (38.3%) male | Median: 73.4 | Self-reported | PM2.5, NO2 |
| Ran et al. (2021) ( | Prospective cohort study | Hong Kong China | 59,349 | 38,931 (65.6%) female and 20,418 (34.4%) male | ≥65 | Self-reported | PM2.5 |
| Shi et al. (2021) ( | Retrospective cohort study | America | 24,689,818 | 14,557,997 (58.96%) female and 10,131,821 (41.04%) male | ≥65 | Self-reported | PM2.5, NO2, O3 |
| Parra et al. (2022) ( | Prospective cohort study | UK | 187,194 | 98,459 (52.6%) female and 88,735 (47.4%) male | 64.1 ± 2.84 | Administrative database | PM2.5, NO2 |
| Shi et al. (2022) ( | Retrospective cohort study | America | 19,200,000 | 40% female and 60% male | ≥65 | Self-reported | PM2.5 |
| Trevenen et al. (2022) ( | Prospective cohort study | Australia | 11,243 | 100% male | 72.1 ± 4.37 | Self-reported | NO2, PM2.5 |
| Yang et al. (2022) ( | Prospective cohort study | China | 1,545 | 806 (52.2%) female and 739 (47.8%) male | 68.21 ± 4.81 | Self-reported | PM2.5 |
| Younan et al. | Prospective cohort study | America | 6,485 | 100% female | 65–79 | Self-reported | PM2.5 |
| Chen et al. (2023) ( | Prospective cohort study | UK | 459,844 | Not reported | 50–69 | Administrative database | PM2.5, PM2.5-10, PM10, NO2, NOx |
| Shim et al. (2023) ( | Retrospective cohort study | Korea | 1,36,361 | 766,909 (53.4%) female and 669,452 (46.6%) male | 70.9 ± 4.9 | Self-reported | PM10 |
| Yuan et al. (2023) ( | Prospective cohort study | UK | 437,932 | 236,503 (54.3%) female and 199,341 (45.7%) male | Median: 58 | Administrative database | PM2.5, PM10, NOx |
| Zhu et al. (2023) ( | Prospective cohort study | China | 29,025 | 17,180 (59.2%) female and 11,845 (40.8%) male | 63.32 ± 9.41 | Self-reported | PM2.5, PM10, NO2 |
| Jutila et al. (2025) ( | Prospective cohort study | UK | 572 | 268 (47%) female and 304 (53%) male | Median: 70 | Self-reported | PM2.5, NO2 |
| Peters et al. (2024) ( | Retrospective cohort study | Netherlands | 10,735,734 | 5,507,858 (51.3%) female and 5,227,876 (48.7%) male | Mean: 54.3 | Self-reported | PM2.5, PM10, NO2 |
| Zhang et al. (2024) ( | Prospective cohort study | UK | 155,828 | 77,649 (50.01%) female and 78,179 (49.99%) male | 64.09 ± 2.84 | Self-reported | NO2, NOx, PM2.5, PM10, PM2.5–10 |
| Qin et al. (2025) ( | Retrospective cohort study | America | 50,053,399 | 55.5% female and 44.5% male | ≥65 | Self-reported | M2.5, NO2, O3 |
| Zhang et al. (2025) ( | Retrospective cohort study | America | 34,600,000 | 16,087,244 (57.9%) female and 11,676,349 (42.1%) male | ≥65 | Self-reported | PM2.5 |
| Zheng et al. (2025) ( | Prospective cohort study | UK | 217,336 | 114,635 (52.7%) female and 102,701 (47.3%) male | 64.1 ± 2.9 | Administrativedatabase | PM2.5 |
| Zhu et al. (2025) ( | Retrospective cohort study | America | 20,763,472 | 11,634,479 (56.0%) female and 9,128,993 (44.0%) male | 76.60 ± 7.08 | Self-reported | PM2.5 |
| First author (year) | Exposure assessment methodology | Average follow-up years (mean ± SD/median) | Exposure assessment window | Average exposure level (mean ±SD/median) | Effect measure | Adjusted |
|---|---|---|---|---|---|---|
| Gialluisi et al. (2023) ( | Kriging model | Mean: 11.17 | Average concentration during the 2006–2018 follow-up period | PM10 = 11.6 μg/m3 | HR | PM10 = 1.25 (1.19–1.31) |
| Zhang et al. (2023) ( | Land use regression model | 8.9 years (2006–2015) | Baseline year average pollutant concentration | PM2.5 = 9.9 ± 1.0 μg/m3; PM10 = 19.1 ± 1.9 μg/m3; NO2 = 28.2 ± =8.8 μg/m3 | HR | PM2.5 = 1.20 (0.88–1.65) |
| Jung et al. (2015) ( | Direct monitoring (ground) | 10 years (2001–2010) | 2000–2010 average concentration | O3 = 88.97 ppb (IQR: 10.91); PM2.5 = 34.40 μg/m3 (IQR: 4.34) | HR | PM2.5 = 2.72 (2.09–2.39) |
| Kioumourtzoglou et al. (2016) ( | Direct monitoring (ground) | 11 years (1999–2010) | Annual dynamic concentration | PM2.5 = 12.0 ± 1.6 μg/m3 | HR | PM2.5 = 2.00 (1.70–2.35) |
| Carey et al. (2018) ( | KCLurban dispersion model | 6.9 years (2005–2013) | Single year (2004) | NO2 = 37.1 μg/m3 (IQR: 5.7); PM2.5=15.7 μg/m3 (IQR: 0.8); O3 = 38.0 μg/m3 (IQR: 3.9) | HR | PM2.5 = 1.70 (1.32–2.55) |
| Oudin et al. (2019) ( | Land use regression model | 15 years (1993–1995 to 2008–2010) | 1993–1995 average concentration | NOx = 17 μg/m3 | HR | NOx = 1.41 (1.01–1.98) |
| Mortamais et al. (2021) ( | Land use regression model | Median: 10.0 years; Longest: 12 years | Past 10-Year moving average concentration | PM2.5 = 21.9 ± 2.6 μg/m3 (14.6–31.3); NO2 = 34.2 ± 7.5 μg/m3 (12.8–91.8) | HR | PM2.5 = 1.20 (1.09–1.32) |
| Ran et al. (2021) ( | Satellite-based spatiotemporal model | Median: 10.4 years (1998–2001 to 2011) | 1998–2001 average concentration | PM2.5 = 34.36 μg/m3 (IQR: 3.8) | HR | PM2.5 = 1.04 (0.93–1.17) |
| Shi et al. (2021) ( | Machine learning ensemble model | Median: 7 years (2000–2018) | 5-year before diagnosis moving average concentration | PM2.5 = 9.3 ± 3.2 μg/m3; NO2 = 17.1 ± 11.6 ppb; O3 = 42.6 ± 5.3 ppb | HR | PM2.5 = 1.12 (1.11–1.14) |
| Parra et al. (2022) ( | Land use regression model | 7.04 ± 2.84 | Single year (2010) | PM2.5 = 9.86 μg/m3 (IQR: 1.25); NO2 = 25.45 μg/m3 (IQR: 9.47) | HR | PM2.5 = 1.87 (1.27–2.78) |
| Shi et al. (2022) ( | Machine learning ensemble model | 17 years (2000–2017) | Annual average concentration | PM2.5 = 9.58 μg/m3 | HR | PM2.5 = 1.15 (1.14–1.16) |
| Trevenen et al. (2022) ( | Land use regression model | Longest: 22.7 years | Baseline year average concentration and annual moving average concentration | NO2 = 13.5 ± 4.41 μg/m3; PM2.5 = 4.54 ± 1.56 μg/m3 | HR | PM2.5 = 0.94 (0.78–1.12) |
| Yang et al. (2022) ( | Machine learning ensemble model | 2 years (2018–2020) | Average concentration (2013–2017) | PM2.5 = 35.73 ± 2.95 μg/m3 | HR | PM2.5 = 1.01 (0.99–1.04) |
| Younan et al. (2022) ( | Bayesian maximum entropy spatiotemporal model | 8.3 ± 3.5 | 1999–2010 annual dynamic exposure1 | PM2.5: IQR = 3.73 μg/m3 | HR | PM2.5 = 1.39 (1.03–1.89) |
| Chen et al. (2023) ( | Land use regression model | Median: 11.7 years (Longest: up to March 2021) | 2006–2010 average concentration | PM2.5 = 8.8 (8.4–9.2) μg/m3; PM10 = 17.3 (16.5–18.1) μg/m3; NO2 = 19.7 (17.0–22.0) μg/m3; NOx = 28.4 (23.9–32.9) μg/m3 | HR | PM2.5 = 1.12 (1.07–1.17) |
| Shim et al. (2023) ( | Direct monitoring (ground) | 8.6 ± 4.1 | Follow-up period annual average concentration | PM10 = 48.4 ± 7.7 μg/m3 | HR | PM10 = 0.99 (0.98–1.00) |
| Yuan et al. (2023) ( | Land use regression model | Median: 12.01 years (longest: up to March 2021) | Single year (2010) | PM2.5 = 9.9 μg/m3 (9.3–10.6); PM10 = 16 μg/m3 (15.2–17); NOx = 42.1 μg/m3 (34.1–50.6) | HR | PM2.5 = 1.13 (0.97–1.31) |
| Zhu et al. (2023) ( | Land use regression model | Median: 5.82 years | 1-Year before baseline average concentration | PM2.5 = 34.55 μg/m3 (IQR 5.32); PM10 = 52.76 μg/m3 (IQR: 7.44); NO2 = 25.57 μg/m3 (IQR: 11.09) | HR | PM2.5 = 1.38 (1.08–1.77) |
| Jutila et al. (2025) ( | Atmospheric chemical transport model | Median: 11.26 years | Specific time points (1935, 1950, 1970) + cumulative exposure (1935–1950, 1935–1970, etc.) | PM2.5 = 3.98 μg/m3 | HR | PM2.5 = 0.98 (0.71–1.37) |
| Peters et al. (2024) ( | Land use regression model and dispersion model | 6.6 years (71 million person—years, 2013–2019) | Single year (2016) | PM2.5 = 1.47 μg/m3; NO2 = 6.52 μg/m3 | HR | PM2.5 = 0.87 (0.81–0.93) |
| Zhang et al. (2024)( | Land use regression model | 12 years (2006–2021) | Single year (2010) | NO2 = 25.42 μg/m3; NOx = 41.09 μg/m3; PM2.5 = 9.86 μg/m3; PM10 = 15.18 μg/m3 | HR | PM2.5 = 1.46 (1.20–1.78) |
| Qin et al. (2025) ( | Machine learning ensemble model | 8.3 years (2000–2016) | Follow-up period annual average concentration | PM2.5 = 11.6 μg/m3; NO2 = 22.7 ppb; O3 = 46.9 ppb | HR | PM2.5 = 1.13 (1.10–1.17) |
| Zhang et al. (2025) ( | Machine learning ensemble model | 18 years (2000–2018) | 5-year moving average concentration | PM2.5 = 9.87 μg/m3 | HR | PM2.5 = 1.09 (1.08–1.01) |
| Zheng et al. (2025) ( | EMEP4UK model | Median: 12.1 years | Follow-up period annual average concentration | PM2.5 = 9.06 μg/m3 | HR | PM2.5 = 1.1 (1.02–1.19) |
| Zhu et al. (2025) ( | Land use regression model | Median: 3 years (2018–2020) | Single year (2017) | PM2.5 = 7.1 μg/m3 | HR | PM2.5 = 1.10 (1.08–1.12) |
| First author (year) | Selection ( | Comparability ( | Outcome ( | Total ( | Quality grade |
|---|---|---|---|---|---|
| Gialluisi et al. (2023) ( | 4 | 2 | 3 | 9 | High |
| Zhang et al. (2023) ( | 4 | 2 | 3 | 9 | High |
| Jung et al. (2015) ( | 4 | 1 | 3 | 8 | High |
| Kioumourtzoglou et al. (2016) ( | 4 | 2 | 3 | 9 | High |
| Carey et al. (2018) ( | 4 | 2 | 2 | 8 | High |
| Oudin et al. (2019)( | 3 | 2 | 3 | 8 | High |
| Mortamais et al. (2021) ( | 4 | 2 | 3 | 9 | High |
| Ran et al. (2021) ( | 4 | 1 | 3 | 8 | High |
| Shi et al. (2021) ( | 4 | 2 | 3 | 9 | High |
| Parra et al. (2022) ( | 4 | 2 | 3 | 9 | High |
| Shi et al. (2022) ( | 4 | 2 | 3 | 9 | High |
| Trevenen et al. (2022) ( | 3 | 1 | 3 | 7 | High |
| Yang et al. (2022) ( | 4 | 1 | 3 | 8 | High |
| Younan et al. (2022) ( | 3 | 1 | 3 | 7 | High |
| Chen et al. (2023) ( | 4 | 2 | 3 | 9 | High |
| Shim et al. (2023) ( | 4 | 2 | 2 | 8 | High |
| Yuan et al. (2023) ( | 4 | 2 | 3 | 9 | High |
| Zhu et al. (2023) ( | 4 | 1 | 3 | 8 | High |
| Jutila et al. (2025) ( | 4 | 2 | 2 | 8 | High |
| Peters et al. (2024) ( | 4 | 2 | 3 | 9 | High |
| Zhang et al. (2024) ( | 4 | 2 | 3 | 9 | High |
| Qin et al. (2025) ( | 4 | 2 | 3 | 9 | High |
| Zhang et al. (2025) ( | 4 | 1 | 3 | 8 | High |
| Zheng et al. (2025) ( | 4 | 2 | 3 | 9 | High |
| Zhu et al. (2025) ( | 4 | 2 | 2 | 8 | High |
Peer Reviews
No public reviews on file for this paper yet. If you reviewed it on a platform where reviews are public (OpenReview, ICLR, NeurIPS, ICML), you can paste yours below so the community can read it here.
Videos
No videos yet. Explain this paper in a talk, walkthrough, or lecture? Add one.
Taxonomy
TopicsAir Quality and Health Impacts · COVID-19 impact on air quality · Health, Environment, Cognitive Aging
Introduction
1
Alzheimer’s disease (AD) is the most prominent neurodegenerative disorder worldwide. Per the World Health Organization, global AD cases exceeded 55 million by 2019 and are projected to reach 78 million by 2030. Progressive cognitive decline, loss of daily living abilities, and surging care needs impose heavy family burdens and strain global medical resources and socioeconomic systems (1). AD’s pathological mechanism is complex—senile plaques from β-amyloid (Aβ) deposition, neurofibrillary tangles due to excessive tau phosphorylation, plus neuroinflammation and synaptic loss are core progression features, though its exact etiology remains incompletely elucidated (2, 3).
AD arises from the interplay of genetic and environmental factors. Particulate matter (PM) is a major environmental pollutant (4). Additionally, growing evidence links it to neurological damage and neurodegenerative diseases through multiple pathways (5). PM is classified by aerodynamic diameter: PM_10_ (≤10 μm), PM_2.5_ (≤2.5 μm), and ultrafine particles (PM_0.1_, ≤0.1 μm). PM_2.5_, due to its small size and large specific surface area, carries toxic pollutants (e.g., heavy metals, polycyclic aromatic hydrocarbons). These substances penetrate the alveolar and blood–brain barriers, acting directly on the central nervous system (6). Animal studies show PM_2.5_ induces lysosomal dysfunction, disrupts Aβ metabolism (e.g., PS1 upregulation), triggers neuroinflammation and myelin damage, and exacerbates AD pathology (7).
Despite numerous studies on long-term PM exposure and AD, evidence remains heterogeneous and controversial. Some prospective cohort studies report significant associations—for example, an Italian study of over 20,000 older adults found each 1 μg/m^3^ PM_10_ increase raised AD risk by 25% (HR = 1.25, 95% CI: 1.19–1.31) (8), and other research links PM_2.5_ to faster cognitive decline and altered AD biomarkers in older adults (9). However, cross-sectional or short-term studies often show no association. This may stem from differences in population baseline, exposure assessment, confounding control, or AD diagnostic criteria (10). Key gaps persist regarding PM’s impact on AD: (1) unclear AD risk differences from PM of varying sizes (e.g., PM_2.5_ vs. PM_10_); (2) scarce data from low- and middle-income countries (high pollution, large populations), limiting global evidence representativeness. To address these gaps, we conduct a systematic review and meta-analysis of global epidemiological studies on long-term ambient PM exposure and AD. Quantitative pooling of effect sizes will clarify their association strength, informing PM’s role in AD pathogenesis, targeted environmental interventions, and high-risk population screening.
Materials and methods
2
Study design and registration
2.1
This study is a systematic review and meta-analysis that synthesizes observational studies on the association between long-term ambient particulate matter exposure and AD incidence/diagnosis. It strictly adheres to the Preferred Reporting Items for Systematic Reviews and Meta-Analyses (PRISMA 2020 Statement). The study protocol was prospectively registered on PROSPERO (International Prospective Register of Systematic Reviews), with the registration number [CRD420251174986].
Literature search strategy
2.2
This study adopted a comprehensive search strategy using English databases to cover published studies worldwide on the association between long-term ambient particulate matter exposure and Alzheimer’s disease. Specifically, four core English databases were searched: PubMed, Embase, Cochrane Library, and Web of Science Core Collection, to ensure the comprehensiveness and accuracy of the search.
Search terms were constructed based on the dual themes of “exposure factor—outcome indicator” and adjusted to MeSH terms (e.g., for PubMed) or free-text terms according to the characteristics of each database, to maximize search comprehensiveness. Core search terms were categorized as follows: Particulate matter-related: “Particulate Matter,” “PM2.5,” “Ultrafine Particles,” “PM10,” “Particulate Air Pollutants”, “Airborne Particulate Matter”, “Ambient Particulate Matter”, “Ultrafine Fibers”; AD-related: “Alzheimer’s disease,” “AD,” “Familial Alzheimer Diseases”, “Focal Onset Alzheimer’s Diseases”, “Acute Confusional Senile Dementia”, “Senile Dementia.” Retrieval time frame: From the establishment of each database to September 12, 2025, to ensure the inclusion of the latest research. Language restriction: Only studies published in English. Key information (e.g., exposure assessment, outcome data, effect sizes) was co-translated by two researchers with sufficient language skills. This avoided language bias. Based on the PICO principle, the inclusion and exclusion criteria were clearly defined to ensure consistency in the definition of study participants, exposures, and outcomes. Details are presented in Table 1.
Literature screening and data extraction
2.3
Literature screening was independently done by two trained researchers (Na Zhao and Hong Sun), who have backgrounds in environmental epidemiology and neuroscience. Screening included two steps: ① Initial screening: Excluded studies that clearly failed inclusion criteria (e.g., animal experiments, cross-sectional studies) based on titles and abstracts. Potentially eligible studies were flagged for full-text review. ② Full-text screening: Obtained the flagged texts and assessed each against inclusion criteria individually.
Disagreements between the two on eligibility were resolved through discussion, or by third-party arbitration from a senior epidemiologist with relevant expertise if consensus failed to be reached, and a final list of included studies was finalized.
A self-designed Data Extraction Form was used, with extraction independently performed by the two and cross-checked for accuracy. Extracted information included: basic study details [first author, publication year, country/region, study type (prospective/retrospective cohort), sample size (total cohort)]; population characteristics [age (mean ± SD/median), gender ratio, AD diagnosis method, particulate type (PM_2.5_/PM_10_, etc.), exposure assessment method, average follow-up (years), exposure window, average exposure level]; and original effect sizes [hazard ratio (HR), relative risk (RR), odds ratio (OR)] and corresponding 95% CI.
Study quality assessment
2.4
Study quality was assessed using the Newcastle–Ottawa Scale (NOS) for observational studies—an internationally recognized tool to assess bias risk in cohort/case–control studies for systematic reviews, with eight items (total score: 9 points) that categorize studies as high quality (≥7 points), moderate quality (4–6 points), or low quality (≤3 points, excluded); its dimensions (for cohort studies) cover participant selection (4 points, 1 for defining exposure groups, 1 for representativeness of unexposed/exposed groups, 1 for no baseline AD, 1 for adequate sample size), comparability (2 points, 1 for adjusting key confounders, 1 for adjusting other potential ones like education and comorbidities), and outcome assessment (3 points, 1 for reliable outcome measurement such as clinical diagnosis + imaging confirmation, 1 for adequate follow-up ≥5 years, 1 for attrition <20% or proper handling). Two researchers (Na Zhao and Hong Sun) conducted the assessment independently, with disagreements resolved via discussion or third-party arbitration, and a final quality assessment table for included studies was generated.
Statistical analysis
2.5
Meta-analysis was performed using R software (version 4.4.2; R Foundation for Statistical Computing, Vienna, Austria) with the metafor package with two-tailed tests (α = 0.05). Heterogeneity was assessed via Q-test (p < 0.10 = significant heterogeneity) and I^2^ statistic: I^2^ < 25% (low): fixed-effects model; 25% ≤ I^2^ ≤ 50% (moderate): fixed-effects if study design/population consistent, else random-effects; I^2^ > 50% (high): random-effects (DerSimonian-Laird method), with subgroup analysis/meta-regression to explore sources. Random-effects models were preferred for synthesizing heterogeneous evidence as they account for both within-study sampling error and between-study variability, which is more robust for environmental epidemiology studies with inherent methodological differences.
For cohort studies, HR (95% CI) was used as effect size; multivariate-adjusted effect size was prioritized over unadjusted. For continuous exposures (e.g., PM_2.5_) with inconsistent dose increments (5/10 μg/m^3^), all effect sizes were first standardized to HR per fixed dose (e.g., 5 μg/m^3^ PM_2.5_) before random-effects pooling.
Heterogeneity sources were analyzed via meta-regression, subgroup, and sensitivity analyses. Meta-regression included exposure assessment method, follow-up duration, study region, and sample size as moderators to explore potential influencing factors. Subgroup analysis stratified by study region and methodology (with exposure assessment method as the core stratification factor), locating heterogeneity sources by re-pooling effect sizes and comparing heterogeneity indices. Sensitivity analysis excluded one study at a time to observe fluctuations in pooled HR (95% CI) and compared fixed- vs. random-effects results to verify stability.
Reliability of the results was verified by sensitivity analysis and publication bias assessment: Sensitivity analysis adopted the one-study removal approach, sequentially excluding each included study and re-pooling effect sizes to examine changes in hazard ratios (HRs) for result stability; publication bias was evaluated visually via funnel plots (x-axis = lnHR, y-axis = SE(lnHR), symmetry indicating no significant bias) and quantitatively using Egger’s test (p < 0.05 = significant bias), with the trim-and-fill method applied to adjust effect sizes if bias was detected.
Results
3
Literature screening results
3.1
This study retrieved a total of 1,428 relevant articles from databases: PubMed (n = 436), Embase (n = 518), Web of Science (n = 473), and Cochrane Library (n = 1). After removing duplicates using EndNote X9 software, 990 articles remained and proceeded to the initial screening stage.
During initial screening, 588 articles that did not meet the inclusion criteria were excluded based on titles and abstracts, with specific reasons including: animal experiments (n = 138), review articles (n = 158), cross-sectional studies (n = 76), outcomes limited to cognitive decline (n = 136), and short-term particulate matter exposure (<1 year, n = 80). A total of 402 articles were retained for full-text screening, during which 377 additional articles were excluded. The main exclusion reasons were: no clear AD diagnostic criteria (n = 149), failure to extract effect sizes and 95% confidence intervals (95% CIs, n = 52), study populations being occupationally exposed (n = 145), and conference abstracts with incomplete data (n = 31).
Finally, 25 studies that met the criteria were included. See Figure 1 for details of the literature screening process.
PRISMA flow diagram.
Basic characteristics of included studies
3.2
The 25 included studies (8, 10–33) were published between 2015 and 2025, including 15 prospective cohort studies (60.0%) and 10 retrospective cohort studies (40.0%). Geographically, 5 studies were from Asia (4 from China and 1 from South Korea), 19 from Europe [including 7 from the United Kingdom (UK)], and 1 from Oceania. Sample sizes ranged from 572 to 50,053,399 participants, with a total study population exceeding 171,896,112. Most participants were aged 50–85 years; some studies focused on single-gender populations (only males or only females), and gender ratios were reported in most cases. AD was defined via two approaches: diagnosis based on administrative databases and self-report. Regarding pollutant types, 22 studies analyzed PM_2.5_, 8 analyzed PM_10_, 12 analyzed NO_2_, 5 analyzed NO_x_, and only 4 analyzed O_3_. See Table 2 details.
Details on exposure assessment and outcomes of the 25 included studies (8, 10–33) are shown in Table 3. The main exposure assessment method was land use regression (LUR) models (11 studies), followed by machine learning ensemble models (5 studies), direct monitoring (3 studies), atmospheric chemical transport models (1 study), and Bayesian maximum entropy spatiotemporal models (1 study). The average follow-up duration was 2–22.7 years, with most studies (22 studies) having a follow-up of 6–12 years. Exposure assessment windows included single-year, 5-year moving average, annual average during follow-up, 1-year average before baseline, and cumulative exposure. Effect sizes in all studies were presented as hazard ratios (HRs) and standardized for exposure increments in accordance with WHO guidelines.
Quality assessment results of included studies
3.3
Bias risk assessment of the 25 included studies (8, 10–33) was performed using the NOS for cohort studies, covering three core dimensions: participant selection, inter-group comparability, and outcome assessment. The re-evaluated scores showed a reasonable distribution across high-quality tiers: 14 studies achieved a full score of 9/9 (fully meeting all NOS criteria), 8 studies scored 8/9 (with minor deductions for limited adjustment of secondary confounders or unclear follow-up attrition rates), and 3 studies scored 7/9 (with deductions for specific population selection and partial confounding adjustment). All included studies attained a NOS score ≥7/9, indicating high-quality evidence that guarantees the reliability of the meta-analysis results (Table 4).
Relationship between 5 μg/m3 increase in PM2.5 and incident AD risk
3.4
We used a random-effects model because heterogeneity across studies was extremely high (I^2^ = 97.8%, p < 0.001). This heterogeneity violates the assumption of a common true effect needed for fixed-effects models. The random-effects model accounts for both within-study sampling error and between-study variability, making results more reliable and generalizable. For meta-analysis of 22 studies (10–13, 15–23, 25–33) to assess the association between a 5 μg/m^3^ increase in PM_2.5_ exposure and incident AD risk, results showed a significant positive association: pooled HR = 1.24 (95% CI = 1.10–1.39, p < 0.001).
We used meta-regression to explore heterogeneity, with moderators including exposure assessment method, follow-up duration, study region, and sample size. The overall model was significant (QM = 101.26, p < 0.0001), explaining 86.05% of heterogeneity (R^2^ = 86.05%). Though no single moderator reached significance, direct ground monitoring (DirectMon, p = 0.0986) and Bayesian maximum entropy spatiotemporal model (p = 0.0868) showed marginal associations (positive estimates); other factors (follow-up, region, sample size) had no significant contributions. Residual I^2^ remained high (97.36%), but tau^2^ decreased from 0.0693 to 0.0097, confirming moderators as major heterogeneity sources.
Subgroup analysis (by simplified exposure methods: LUR, MLEns, DirectMon, Others) further verified significant between-subgroup differences (Q = 24.66, p < 0.0001): DirectMon (n = 2) had the strongest association (HR = 2.35, 95% CI: 1.74–3.18), followed by LUR (k = 10, HR = 1.15) and MLEns (n = 5, HR = 1.10); the “Others” subgroup (n = 5) showed no significant association (HR = 1.17, 95% CI: 0.996–1.38) due to rare methods with small samples. These subgroup trends aligned with meta-regression, confirming exposure assessment method as the core heterogeneity source (Figure 2).
Forest plot of meta-analysis on the association between a 5 μg/m3 increase in PM2.5 and incident AD risk. LUR, land-use regression model; MLEns, machine learning ensemble model; DirectMon, direct monitoring ground; “Others” subgroup includes rare exposure methods (KCLurban dispersion model, Bayesian maximum entropy spatiotemporal model, satellite-based spatiotemporal model, atmospheric chemical transport model, EMEP4UK model).
Relationship between a 10 μg/m3 increase in PM10 and incident AD risk
3.5
A random-effects model was adopted given the high between-study heterogeneity (I^2^ = 93.4%, p < 0.0001), which accounts for both sampling error and inherent variability across studies. This model was used to analyze the association between a 10 μg/m^3^ increase in PM10 exposure and incident AD risk, with subgroup stratification by study design (retrospective vs. prospective). Retrospective subgroup (4 studies) (10, 24, 26, 28): no significant association (HR = 1.02, 95% CI = 0.90–1.17) with moderate heterogeneity (I^2^ = 55.4%, p = 0.081). Prospective subgroup (4 studies) (8, 10, 23, 25): significant positive association (pooled HR = 1.27, 95% CI = 1.19–1.35) with very low heterogeneity (I^2^ = 0%, p = 0.676). Overall (8 studies): significant association (HR = 1.16, 95% CI = 1.01–1.33) with high heterogeneity (I^2^ = 93.4%, p < 0.0001). Subgroup heterogeneity test (p = 0.004) identified study design as an important heterogeneity source, with a more pronounced PM10-AD association in prospective studies (Figure 3).
Forest plot of meta-analysis on the association between a 10 μg/m3 increase in PM10 and incident AD risk.
Relationship between a 10 μg/m3 increase in NO2 and incident AD risk
3.6
A random-effects model analyzed the association between a 10 μg/m^3^ NO_2_ increase and incident AD risk, with subgroup stratification by region. UK subgroup (6 studies) (10, 13, 18, 23, 27, 29): significant association (HR = 1.13, 95% CI = 1.09–1.16), low heterogeneity (I^2^ = 13.3%, p = 0.33). Others subgroup (4 studies) (15, 20, 26, 28): no significant association (HR = 0.96, 95% CI = 0.90–1.02), moderate heterogeneity (I^2^ = 26.2%, p = 0.25). America subgroup (2 studies) (17, 30): slight positive association (HR = 1.03, 95% CI = 1.02–1.04), low heterogeneity (I^2^ = 14.5%, p = 0.280). Overall (12 studies): significant association (HR = 1.06, 95% CI = 1.00–1.12), high heterogeneity (I^2^ = 82.9%, p < 0.001). Subgroup difference test (p < 0.0001) identified region as an important heterogeneity source, with a more significant NO2-AD association in the UK (Figure 4).
Forest plot of meta-analysis on the association between a 10 μg/m3 increase in NO2 and incident AD risk.
Relationship between a 10 μg/m3 increase in NOx and incident AD risk
3.7
A random-effects model analyzed the association between a 10 μg/m^3^ NOₓ increase and incident AD risk, with subgroup stratification by average follow-up duration. Follow-up >12 years (2 studies) (14, 25): significant association (HR = 1.29, 95% CI = 1.11–1.48), no heterogeneity (I^2^ = 0%, p = 0.553). Follow-up <12 years (3 studies) (10, 23, 29): significant association (HR = 1.05, 95% CI = 1.03–1.07), no heterogeneity (I^2^ = 0%, p = 0.924). Overall (5 studies): significant association (HR = 1.05, 95% CI = 1.03–1.07), moderate heterogeneity (I^2^ = 51.5%, p = 0.083). Subgroup difference test (p = 0.005) identified follow-up duration as an important heterogeneity source, with a stronger NOₓ-AD association in the long follow-up subgroup (>12 years) (Figure 5).
Forest plot of meta-analysis on the association between a 10 μg/m3 increase in NOx and incident AD risk.
Relationship between a 60 μg/m3 increase in O3 and incident AD risk
3.8
A random-effects model analyzed 4 studies (11, 13, 17, 30) to assess the association between a 60 μg/m^3^ O3 increase and incident AD risk. Results showed no statistically significant association (HR = 1.23, 95% CI = 0.65–2.31, p > 0.05), with extremely high heterogeneity (I^2^ = 99.8%, p < 0.001). Notably, the included studies exhibited opposing effect directions: one study reported a strong positive association (HR = 3.12), while another showed a non-significant negative association (HR = 0.78). Given the small number of included studies (n = 4), conflicting effect directions, and extreme heterogeneity, the current evidence is inadequate and unstable to confirm or refute an association between long-term O_3_ exposure and incident AD risk. The pooled result should be interpreted with extreme caution (Figure 6).
Forest plot of meta-analysis on the association between a 60 μg/m3 increase in O3 and incident AD risk.
Evaluation of publication bias
3.9
Publication bias assessment results: For PM_2.5_ and NO_2_ (≥10 included studies), funnel plots showed symmetric distributions, suggesting low publication bias (Figure 7). For PM_10_, NOₓ, and O_3_ (<10 included studies), Egger’s test was used: PM_10_ (p = 0.159) and O_3_ (p = 0.395) had no significant publication bias; NOₓ (p = 0.047) showed potential bias, possibly due to underreporting of negative-result studies. The trim-and-fill method was applied to adjust for NOₓ’s potential publication bias. After imputing 1 missing negative-result study, the adjusted pooled HR for NOₓ was 1.02 (95% CI: 1.01–1.03, p < 0.001), which remained statistically significant.
Funnel plots for publication bias of the association between exposure to PM2.5 (A) and NO2 (B) and incident AD risk.
Discussion
4
Based on individual data from 25 prospective or retrospective cohort studies, involving a total of over 170 million adults aged 50 years and above, this study estimated the dose–response relationships between long-term exposure to PM_2.5_, PM_10_, NO_2_, NOₓ, and O_3_ and the risk of incident AD simultaneously on a global scale for the first time. We found that for every 5 μg/m^3^ increase in PM_2.5_, the risk of AD incidence increased by 24% (HR = 1.24, 95% CI: 1.10–1.39). Compared with a 2025 study from the University of Cambridge, which was based on 26 million UK healthcare records (HR = 1.08 per 10 μg/m^3^) (34), our effect size was higher, which may be attributed to the following three factors: ① In our study, most of the “long-term exposure” was defined as a ≥ 5-year moving average, whereas the Cambridge study only used single-year baseline concentrations, which underestimated the cumulative dose; ② The baseline age of the population included in our study was ≥50 years, while the Cambridge database included a mix of people aged 40–45 years, and the younger dilution effect lowered the HR; ③ We used a random-effects model and retained studies with high heterogeneity, whereas the Cambridge study used a fixed-effects model, which may have excessively narrowed the confidence intervals.
Mechanistically, PM_2.5_’s neurotoxicity has been verified through three approaches: in vivo, in vitro, and imaging studies. A 2025 study of 602 autopsies found that PM2.5 exposure was significantly linked to the severity of Alzheimer’s disease neuropathological changes (ADNC) (35). Moreover, in a subgroup of 287 subjects with Clinical Dementia Rating Sum of Boxes (CDR-SB) data, this association was manifested as aggravated cognitive impairment (β = 0.48; 95% CI = 0.22–0.74). In 2025, Wei et al. (36) established a chronic exposure model by administering intranasal instillation of PM_2.5_ to APP/PS1 mice for 90 consecutive days. After 3 months, they found that PM_2.5_ exposure induced lysosomal dysfunction (e.g., altered membrane permeability and impaired degradation function) in the hippocampus and cortex of the mice, increased amyloid-beta (Aβ) plaque deposition and the Aβ42/Aβ40 ratio in the hippocampus and cortex, and simultaneously elevated the phosphorylation level of tau protein at Thr231—accelerating the pathological progression of AD. In terms of human brain imaging, the 2025 Seoul-Incheon Brain Imaging Study (n = 542, aged ≥ 65 years) revealed that for every 1 μg/m^3^ increase in indoor PM_2.5_, the bilateral hippocampal volume decreased by 55.4 mm3, and this association was independent of cerebrovascular risk factors. The authors also pointed out that hippocampal volume reduction is a key early imaging biomarker for AD, suggesting that air pollution-related cognitive impairment may be mediated by hippocampal atrophy (37).
The effects of NO_2_ and NO_x_ also warrant attention. We found that for every 10 μg/m^3^ increase in NO_2_, the risk of AD increased by 6% (HR = 1.06), with a stronger effect in the UK (HR = 1.13) and a significant difference from other European regions and Asia (p < 0.0001). This regional specificity is strongly supported by London’s traffic pollutant characteristics identified in a large-scale population study: ① Road traffic is the core source of key pollutants, with clear subdivision of PM_2.5_ sources into traffic exhaust and non-exhaust emissions (e.g., brake/tyre wear and resuspension), confirming traffic’s exclusive contribution to local air pollution (38). ② During 2006–2010, the average exposure to traffic-related NO2 in London reached 41 μg/m^3^, with NO_x_ as high as 73 μg/m^3^, while PM_2.5_ and PM_10_ averaged 14 μg/m^3^ and 23 μg/m^3^, respectively, representing sustained high-concentration exposure across the 2,317 km^2^ study area (39). A continental-scale attributable mortality study covering the entire continent in 2020 estimated that for every 10 μg/m3 increase in road transport-related NO_2_, the number of annual attributable premature deaths increased by approximately 9,300 cases (range: 5,500–14,000), which is equivalent to an independent contribution of NO_2_ to the increase in deaths of ≈ 1.5% (95% CI = 0.9–2.2%). This further supports the “high traffic source-high toxicity” hypothesis (40). In a 2-year follow-up of 9–10-year-old American children (ABCD Cohort, n = 9,497), every 10 μg/m^3^ increase in NO_2_ significantly reduced inter-network and cortico-network functional connectivity (β = −0.028, p < 0.001). This suggests that NO_2_ exposure during childhood can disrupt the maturation trajectory of brain networks, providing the first longitudinal evidence for the neurodevelopmental toxicity of NO_2_ (41). In the NO_x_ analysis, we found that the HR of the subgroup with >12 years of follow-up was 1.29, much higher than that of the subgroup with <12 years of follow-up (1.05). This further supports the notion that “cumulative dose” rather than “transient concentration” determines the risk of AD. This result is consistent with a 2024 British aging cohort study (n = 192,300), where cumulative NO_x_ exposure over the follow-up years increased the risk of dementia by 1.16 (1.10–1.21) (HR = 1.32). Additionally, 6.6% of the association between NOₓ and dementia was mediated by long-term metabolic disturbances, revealing for the first time that the cumulative neurotoxicity of NO_x_ can be exerted through lipid metabolism pathways (42). Notably, Egger’s test for NOₓ gave a p-value of 0.047, suggesting potential publication bias. This may result from underreporting of studies with negative results. We applied the trim-and-fill method and incorporated 1 imputed study. The adjusted pooled HR decreased to 1.02 (95% CI = 1.01–1.03) but remained statistically significant. This indicates that while potential publication bias cannot be excluded, the association between long-term NOₓ exposure and AD risk is still supported by the available data and not fully negated by the observed bias.
Surprisingly, a null result was observed for O_3_. After pooling data from 4 studies, we found that for every 60 μg/m^3^ increase in O_3_, the HR for AD risk was 1.04 (95% CI = 0.79–1.36), with extremely high heterogeneity (I^2^ = 99.8%). In-depth analysis showed discrepancies between two key studies: Jung et al. (Taiwan) (11) reported an HR of 3.12, while Carey et al. (UK) (13) reported an HR of 0.78. These differences stem from inherent variations in exposure assessment, co-exposure control, and definitions of study population and outcomes. Jung et al. (11) focused on individuals aged 65 years and above in Taiwan. For O_3_ exposure assessment, PM_2.5_ concentrations before 2006 had to be estimated using the mean ratio of PM_10_ to PM_2.5_ (0.57), which may have led to exposure misclassification. Additionally, O_3_ concentrations in Taiwan are generally high due to subtropical photochemical pollution, and the study did not clearly and fully isolate the synergistic effect of “O_3_ + PM_2.5_” mixed pollution. In contrast, Carey et al. (13) was based on a population aged 50–79 years in London. It used the KCLurban dispersion model with a 20 × 20 m resolution, combined with residential postcodes, to accurately assess O_3_ exposure. O_3_ concentrations in the UK are generally low due to the temperate maritime climate; moreover, in the multi-pollutant model, the study strictly adjusted for co-exposure pollutants such as NO_2_ and PM_2.5_, as well as confounding factors including area deprivation index and underlying diseases. These differences ultimately resulted in the divergence of effect sizes between the two studies. Animal experiments have shown that O_3_ exposure alone only induces mild neurodegenerative changes in mice. However, simultaneous exposure to O_3_ and PM_2.5_ not only leads to a synergistic enhancement of neuroinflammation but also is accompanied by a significant aggravation of blood–brain barrier damage and memory impairment. Furthermore, omics studies have confirmed that mitochondrial complex dysfunction in glial cells drives this synergistic effect (43). Therefore, the null result for O_3_ does not indicate the absence of neurotoxicity; instead, it emphasizes that the effect of O_3_ should be re-evaluated within the framework of mixed pollution, rather than relying on a single-pollutant model.
We observed high heterogeneity in this study. We conducted meta-regression (with exposure assessment method, follow-up duration, study region, and sample size as moderators) and further subgroup analysis stratified by exposure assessment method (the core heterogeneity source identified). Despite these efforts, the I^2^ value for PM_2.5_ remained above 80%—a level similar to the 80% heterogeneity reported in a meta-analysis on childhood asthma (44). We speculate that the core source lies in the fact that PM chemical composition was not captured. A review study has confirmed that differences in the contents of heavy metals and polycyclic aromatic hydrocarbons (PAHs) in PM_2.5_ can lead to differences in neurotoxicity by up to 3-fold (45). However, the studies included in this research did not report information such as black carbon or heavy metals, making it impossible to perform component-specific stratification. Second, there were differences in exposure assessment accuracy: most studies relied on regional models, which may underestimate the actual exposure level compared with individual biomarker monitoring. These unmeasured variables constitute residual heterogeneity, and future studies are required to collect more data to address this issue.
Based on the PM_2.5_ HR of 1.24 and the trend of no threshold effect, we recommend that the World Health Organization (WHO) tighten its annual guideline concentration from 5 μg/m^3^ to 3–4 μg/m^3^. Currently, there is substantial evidence showing that HEPA-filtered air purifiers can reduce indoor PM_2.5_ concentrations and improve subclinical health indicators (46). An existing systematic review, which included 16 studies [8 focusing on low-emission zones (LEZ) and 8 on congestion charging zones (CCZ)], revealed the following (47): LEZs have a positive impact on health outcomes related to air pollution—among the 6 studies evaluating cardiovascular diseases, 5 observed a reduction in the risk of certain subtypes of these diseases; for CCZs, taking London as an example, 6 out of 7 studies reported a decrease in road traffic injuries (RTIs). These pieces of evidence indicate that traffic emission reduction measures such as LEZs can effectively mitigate health risks associated with air pollution, further supporting the concept of “emission reduction equals prevention.” Such measures can be adopted as a primary prevention strategy for neurodegenerative diseases like AD.
At the same time, the limitations of this study should also be viewed objectively. First, due to data limitations of the included studies, it was not possible to conduct a dose–response relationship analysis. This made it impossible to identify the specific thresholds for the association between exposure to various pollutants and AD incidence risk, and difficult to further quantify the risk differences under different exposure levels. Second, the study lacks data on the chemical composition of pollutants, so it cannot distinguish the differences in AD-inducing activity among different components in PM_2.5_ [e.g., heavy metals, polycyclic aromatic hydrocarbons (PAHs)], making it hard to accurately identify the core pathogenic components. Furthermore, the conclusion that there is no clear association between O_3_ and AD incidence risk may also be limited by the small sample size—only 4 studies were included. The stability of this result still requires further verification by more high-quality, large-sample studies.
Conclusion
5
In summary, this study, conducted in a global population of 170 million individuals, confirmed that long-term exposure to PM_2.5_, NO_2_, and NO_x_ is associated with a robust positive correlation with the risk of AD incidence, with effect sizes higher than those reported in previous studies. Over the next 5 years, if combined progress and breakthroughs can be achieved in three key areas—research on pollutant components, analysis of genetic influences, and exploration of intervention measures—air pollution is expected to become the first environmental risk factor for AD that can be significantly adjusted and improved on a large scale. This will provide a practical primary prevention strategy for AD in aging societies worldwide.
The reference list from the paper itself. Each links out to its DOI / PubMed record.
- 1Lancet Public Health. Reinvigorating the public health response to dementia. Lancet Public Health. (2021) 6:e 696. doi: 10.1016/S 2468-2667(21)00215-234563278 PMC 8516159 · doi ↗ · pubmed ↗
- 2Zhang H Wei W Zhao M Ma L Jiang X Pei H . Interaction between aβ and tau in the pathogenesis of Alzheimer's disease. Int J Biol Sci. (2021) 17:2181–92. doi: 10.7150/ijbs.57078, 34239348 PMC 8241728 · doi ↗ · pubmed ↗
- 3Zheng Q Wang X. Alzheimer's disease: insights into pathology, molecular mechanisms, and therapy. Protein Cell. (2025) 16:83–120. doi: 10.1093/procel/pwae 026, 38733347 PMC 11786724 · doi ↗ · pubmed ↗
- 4Jones A Ali MU Mayhew A Aryal K Correia RH Dash D . Environmental risk factors for all-cause dementia, Alzheimer's disease dementia, vascular dementia, and mild cognitive impairment: an umbrella review and meta-analysis. Environ Res. (2025) 270:121007. doi: 10.1016/j.envres.2025.12100739889875 · doi ↗ · pubmed ↗
- 5Zeng HX Qin SJ Andersson J Li SP Zeng QG Li JH . The emerging roles of particulate matter-changed non-coding RN As in the pathogenesis of Alzheimer's disease: a comprehensive in silico analysis and review. Environ Pollut. (2025) 366:125440. doi: 10.1016/j.envpol.2024.125440, 39631655 · doi ↗ · pubmed ↗
- 6Wilker EH Osman M Weisskopf MG. Ambient air pollution and clinical dementia: systematic review and meta-analysis. BMJ. (2023) 381:e 071620. doi: 10.1136/bmj-2022-071620, 37019461 PMC 10498344 · doi ↗ · pubmed ↗
- 7Liu C Meng L Gao Y Chen J Zhu M Xiong M . PM 2.5 triggers tau aggregation in a mouse model of tauopathy. JCI Insight. (2024) 9. doi: 10.1172/jci.insight.176703 PMC 1138335139133647 · doi ↗ · pubmed ↗
- 8Gialluisi A Costanzo S Veronesi G Cembalo A Tirozzi A Falciglia S . Prominent role of PM 10 but not of circulating inflammation in the link between air pollution and the risk of neurodegenerative disorders. med Rxiv. (2023) [Preprint]. doi: 10.1101/2023.05.17.23289154 · doi ↗