The decay of HIV under anti-retroviral therapy is biphasic even in humanized mice with just T cells
Jasmine A. F. Kreig, Angela Wahl, Elisabete Fernandes, Jenna B. Honeycutt, J. Victor Garcia, Ruy M. Ribeiro

TL;DR
This study shows that HIV's biphasic decay during treatment in mice is not due to different cell types but may be due to the virus's own lifecycle.
Contribution
The study refutes the hypothesis that macrophages and CD4+ T cells cause biphasic HIV decay and suggests intrinsic viral properties are responsible.
Findings
Biphasic HIV decay occurs even in mice with only CD4+ T cells, not macrophages.
The first decay phase half-life in mice matches that observed in humans.
The biphasic pattern is robust and not dependent on multiple cell types.
Abstract
HIV-1 plasma viral load decays in a biphasic manner during antiretroviral therapy (ART). It was hypothesized that this is due to infection of different cell types, namely CD4+ T cells and macrophages. We studied this possibility directly by modeling the decay of HIV-1 in humanized mice. We utilized previously published data from humanized T-cell only mice (TOM) and myeloid-only mice (MOM) infected with HIV-1 and treated with a potent ART regimen. Viral load decay dynamics were modeled using either a single or a biexponential decay fitted using nonlinear mixed effects techniques. Fits were compared using the corrected Bayesian information criterion (BICc). In TOM, the biphasic model was significantly better than a single-phase decay model (ΔBICc ≈ 16) despite additional parameters. In MOM, the biphasic decay was statistically better, but there was substantial uncertainty because the…
Genes, proteins, chemicals, diseases, species, mutations and cell lines named across the full text — each resolved to its canonical identifier and authoritative record.
Click any figure to enlarge with its caption.
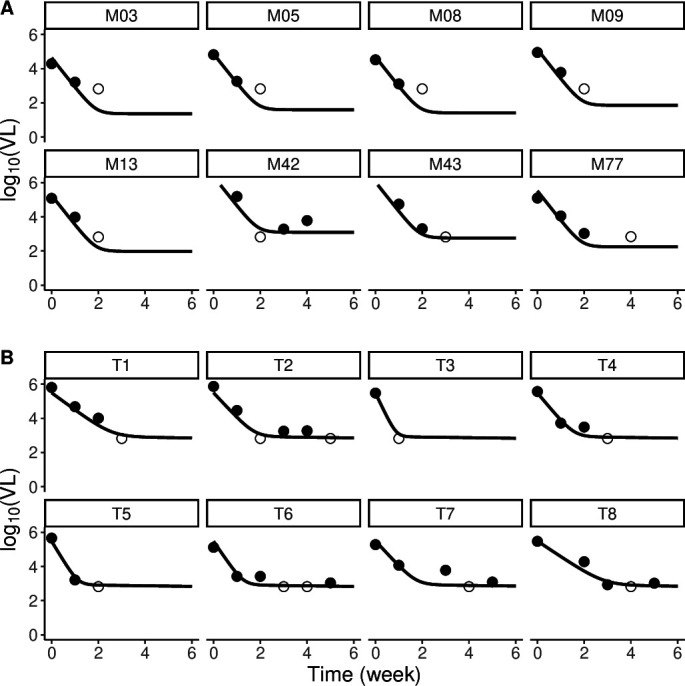 Fig 1
Fig 1| MOM ( | TOM ( | BLT ( | X4 ( | ||
|---|---|---|---|---|---|
| Single | BICc | 331.3 | 90.1 | 310.4 | 120.6 |
| Random effects |
|
|
|
| |
|
| 1 | 1 | 1 | 1 | |
| 3.9 (3.6, 4.2) | 3.5 (2.4, 5.1) | 1.9 (1.6, 2.2) | 2.1 (1.5, 4.0) | ||
| First-phase half-life (days) | 1.2 (1.1, 1.4) | 1.4 (0.96, 2.0) | 2.6 (2.2, 3.0) | 2.3 (1.6, 3.3) | |
|
| NA | NA | NA | NA | |
| 4.7 (4.6, 4.9) | 4.9 (4.2, 5.6) | 5.5 (5.3, 5.7) | 4.4 (4.0, 4.8) | ||
| Biphasic | BICc | 312.8 | 74.0 | 264.4 | 111.7 |
| Random effects |
|
|
|
| |
|
| 0.999 (0.999, 1) | 0.998 (0.996, 1) | 0.997 (0.994, 0.999) | 0.999 (0.998, 1) | |
| 4.0 (3.7, 4.3) | 3.7 (2.4, 5.8) | 2.6 (2.3, 2.9) | 3.6 (3.1, 4.1) | ||
| First-phase half-life (days) | 1.2 (1.1, 1.3) | 1.3 (0.84, 2.0) | 1.9 (1.7, 2.1) | 1.4 (1.2, 1.6) | |
| 0.000224 (0, 3.28e+43) | 6.37e−05 (0, 8.78e+24) | 0.284 (0.151, 0.536) | 3.83e−5 (5.24e−14, 2.8e+4) | ||
| Second-phase half-life (weeks) | 3094 | 10,881 | 2.4 | 18,098 | |
|
| 4.8 (4.6, 4.9) | 5.5 (5.2, 5.8) | 5.7 (5.5, 5.9) | 4.8 (4.5, 5.2) | |
| Random effects | MOM ( | TOM ( | BLT ( | X4 ( | |
|---|---|---|---|---|---|
| Single decay model |
| 350.51 | 91.28 | 318.12 | 120.74 |
|
| 365.94 | 90.1 | 356.83 | 127.23 | |
|
| 331.35 | 93.12 | 310.44 | 120.64 | |
| Biphasic model |
| 360.27 | 80.6 | 315.6 | 133.41 |
|
| 355.01 | 80.48 | 267.64 | 120.25 | |
|
| 317.1 | 80.61 | 305.22 | 127.52 | |
|
| 327.52 | 82.74 | 311.69 | 116.97 |
- —National Institute of Allergy and Infectious Diseaseshttp://dx.doi.org/10.13039/100000060
- —National Institute of Allergy and Infectious Diseaseshttp://dx.doi.org/10.13039/100000060
- —National Institute of Allergy and Infectious Diseaseshttp://dx.doi.org/10.13039/100000060
- —Fundacao para a Ciencia e Tecnologia
- —Los Alamos National Laboratoryhttp://dx.doi.org/10.13039/100008902
Peer Reviews
No public reviews on file for this paper yet. If you reviewed it on a platform where reviews are public (OpenReview, ICLR, NeurIPS, ICML), you can paste yours below so the community can read it here.
Videos
No videos yet. Explain this paper in a talk, walkthrough, or lecture? Add one.
Taxonomy
TopicsHIV Research and Treatment · HIV/AIDS drug development and treatment · HIV-related health complications and treatments
INTRODUCTION
HIV infects cells by engaging the glycoprotein CD4 (cluster of differentiation 4) on the surface of cells and a co-receptor, often C-C chemokine receptor type 5 (CCR5) or C-X-C chemokine receptor type 4 (CXCR4) (1). The main cellular targets of HIV in the body are CD4+ T cells and macrophages, where these proteins are co-expressed (1). A powerful tool in the study of infection of these different subsets of cells is humanized mouse models, that is, chimeras consisting of immunodeficient mice engrafted with human hematopoietic stem cells (2, 3). There are different humanized mouse models, including mice containing both T-cells and myeloid cells, mice with just T-cells and no myeloid cells, and vice versa (see a recent review in [4]). All these models support productive HIV infection and were used to study multiple aspects of infection, including the contribution of macrophages (5), central nervous system infection (6, 7), HIV persistence (8–10), HIV latency and reversal (11, 12), pharmacological interventions (13), and others (14, 15).
In humans, treatment of HIV infection with potent antiretrovirals results in a biphasic decline of the virus in the periphery, with a fast first phase half-life (time needed to remove half of the virions in circulation) of about 1 day and a slower second phase half-life of ~21 days (16–18). These dynamics have been consistently observed with many classes of antiretrovirals (19). One mechanism that has been evoked to explain the existence of two phases of decay is viral infection in different cell compartments, with different decay rates. One possibility is that the first phase is driven by the decay of infected CD4+ T cells and the second phase by the loss of infected macrophages (20, 21). This hypothesis can be directly tested in the appropriate humanized mouse models of HIV infection.
Here, we use data from humanized mice treated with antiretrovirals to analyze in detail the decay of HIV-1 under treatment. We take advantage of mice possessing only T cells (T-cell only mouse, TOM) or only myeloid cells, such as macrophages (myeloid-only mouse, MOM), to investigate whether the decay of virus is biphasic or exhibits a single phase, as would be predicted by the hypothesis that the biphasic decay is due to different types of cells, specifically T cells and macrophages.
MATERIALS AND METHODS
Data
The data used in this study were published previously (5, 8, 11). Briefly, humanized T-cell only mice (TOM) were generated by implanting human thymus and liver tissue under the kidney capsule of sublethally irradiated NOD.Cg-Prkdc^scid^ Il2rgtm^1Wjl^/SzJ mice (NSG; The Jackson Laboratory). Bone marrow/liver/thymus (BLT) mice also received autologous CD34+ hematopoietic stem cells (CD34 Microbead Kit, catalog 130-046-703; Miltenyi Biotec). Humanized MOMs were created by transplanting sublethally irradiated NOD.CB17-Prkdc^scid^/J mice (NOD/SCID; The Jackson Laboratory) with approximately 1 × 10^6^ cord blood or liver-derived CD34+ hematopoietic stem cells. Previous flow cytometric analysis confirmed the absence of human myeloid cells in ToM and human T cells in MoM (5, 8, 22). Moreover, MoM are constructed in a NOD/SCID background, and the thymus of NOD/SCID mice is unable to support thymopoiesis.
Mice were infected with R5-tropic or X4-tropic HIV viruses at a dose of 360,000 tissue culture infectious units (TCIU), as described before (5, 8). To measure viral load during treatment, peripheral blood was collected serially, and plasma was isolated by centrifugation. HIV infection was monitored in peripheral blood plasma with a one-step reverse transcriptase real-time PCR assay (ABI custom TaqMan Assays-by-Design, with an assay sensitivity of 668 RNA copies/mL) (5). Mice were administered daily intraperitoneal injections of emtricitabine (FTC; 211 mg per kg body weight), tenofovir disoproxil fumarate (TDF; 205 mg per kg body weight), and raltegravir (RAL; 56 mg per kg body weight), two reverse transcriptase inhibitors, and an integrase inhibitor.
Animal protocols were approved by the Institutional Animal Care and Use Committee of the University of North Carolina at Chapel Hill.
Model
A standard and well-tested model of HIV-1 infection and treatment (20) is to consider two types of target cells, T and M, which have been associated with CD4+ T cells and macrophages (20, 23–25). These cells are infected at constant rates (k and k_M_) to generate two types of infected cells, short-lived (T*) and longer-lived (M*), which then produce virus at different rates (P and p_M_). The virus is cleared at a constant rate, c, which has been measured to be very fast (c>20/day) (26). Treatment is modeled as a reduction in infection rate by (1−ε), where ε is the effectiveness of the drug. This model can be written as:
where we have assumed, as often done (20), that the number of target cells remains approximately at a constant level (T_0_ and M_0_) during the period of short-term therapy that we analyze here. If, in addition, we assume that ART is very potent and the number of new infections during therapy is negligible (ε_M_ = ε_T_ = 1), then those equations can be solved to show that the viral load changes according to
with and . Since c is large (e.g., c > 20/day^26^), the last term (~e ^ct^) becomes very small quickly. Indeed, our data have a weekly frequency, and at 1 week, this term corresponds to <10^−30^. Thus, the solution for V(t) becomes a simple biexponential, with two slopes of decay corresponding to the turnover of the two types of infected cells (T* at δ and M* at µ_M_). Moreover, at time t = 0, V(0) = V0, which implies that A + B ≈ 1. This simplified model is what we fit to our data set of humanized mice infected with HIV and treated with the potent ART regimen. That is, .
This model has three parameters – , , and µM – and allows us to test whether the decline is single ( ) or biphasic ( ) and to estimate the resultant decay rates. From these, we calculated the first- and second-phase half-lives as log(2)/δ and log(2)/µ_M_, respectively.
Data fitting
We fitted the model using a population approach (non-linear mixed effects) in Monolix (Lixoft SA, Antony, France) to a data set of infected MOMs (n = 78) and TOMs (n = 8). In multiple cases, viral load quickly goes below detection in the treated mice, and we do not include datapoints below the level of detection (LoD=688 RNA copies/mL) after the first instance of such a datapoint, which is used as censored in the fitting algorithm.
Assuming a constant error model, we fit the log_10_ of the viral load data for MOMs and TOMs separately because of the imbalance in group size. We use the corrected Bayesian information criteria (BICc) to evaluate each fit, wherein the lower the BICc value, the better the fit (27). We also assessed what is the most parsimonious structure for the random effects of the parameters using BICc. We present only the best resulting model. As a further test of the robustness of our main result, we also fitted mice that have both T-cells and myeloid cells (BLT mice) and MOM mice infected with an X4-tropic virus.
RESULTS AND DISCUSSION
When HIV-1 infection is treated with potent antiretroviral therapy, an initial biphasic decline is observed. We tested whether this observation holds true in humanized mice reconstituted only with T cells (TOM) or only with myeloid cells (MOM), which without treatment can maintain infection with high viral loads for more than 10 weeks (5, 11). If the hypothesis that the two phases of decline at the start of treatment are due to the decay of infected CD4+ T cells and macrophages at different rates, one would expect that in each of these mice types, a single phase of decline at different rates would be observed.
We fitted the observed decay in viral load in these mice upon initiation of treatment using a simpler version of standard models of viral infection (20) (see Methods). Our fits to the data showed that the biphasic model performed better statistically than the single decay model (Table 1; Fig. 1) across both groups of mice (TOM and MOM), with improvements of BICc of ~19 units in MOM and ~16 units in TOM despite the extra parameters for the biphasic model. However, in MOM, this biphasic decline is not visually apparent in the limited data, and it could be driven by the censored data. Only MOM number 42 shows the slowing down of decline characteristic of biphasic decay.
Bi-phasic fits for (A) selected MOM and (B) all TOM mice. Each panel represents one mouse’s viral load data (symbols) and corresponding best fit (line). Data below the limit of detection are represented as open circles. (We only present a subset of the MOM-infected mice.)
Importantly, we estimated that the first phase of decay has a similar half-life of 1.2 days for MOM and 1.3 days for TOM, and these are relatively well-constrained with 95% confidence intervals (1.1, 1.3) days and (0.84, 2.0), respectively. Moreover, the single-phase decay model estimates half-lives similar to the ones shown above (Table 1). On the contrary, the second phase of decline is much slower, with best estimates indicating essentially no decay in both MOM and TOM. It is possible that this result is due to difficulties estimating the second phase of decay because the virus is very low in this phase. This would be a bigger issue for MOM that starts with a lower viral load (V_0_= 4.8) than TOM (V_0_= 5.5) (P < 2.2e−16).
To understand our results better, we also fitted BLT mice, which have both CD4 T cells and macrophages and MOM mice infected with X4 virus. Similar to both MOM and TOM, the biphasic model performed better statistically than the single model (Table 1) demonstrating BICc improvements of ~46 and ~9 units in BLT and MOM-X4, respectively. But again, in MOM-X4, this could be driven by censored data, and only one mouse showed a clear slowing down of decay (not shown).
The fits presented in Table 1 represent the scenarios that yielded the lowest BICc values for each type of model. For comparison, we include information on alternative random effects structures (Table 2) across all mouse groups and for both the single and biphasic models. This table shows that, even if we define the same random effects for single phase and biphasic model (e.g., on δ and V0), the biphasic model has better statistical support.
Taken together, these results indicate that a model with biphasic decline for the viral load upon treatment initiation describes the data better in TOM and possibly in MOM as well. In addition, we find that the first phase decay rate and corresponding half-lives are very similar in TOM and MOM, independent of whether the latter have a true biphasic or only a single-phase decay. This suggests that the original hypothesis that the two phases of decline correspond to infection of these two different types of cells that are lost at different rates is untenable. Note that the estimated second phase decay rate in BLT mice (t 1/2= 2.4 weeks) is also much slower than the first phase decay rate of macrophages in MOM (Table 1).
We have proposed an alternative viral dynamical model, which provides a better description of the dynamics of HIV-1 under integrase strand-transfer inhibitor-containing ART (28), where the first and second phase are due to the same type of cells with different integration half-lives possibly due to different states of cell activation on infection (29, 30). This model could explain the present data where mice with just T-cells, nevertheless, show biphasic decay of viral load with a treatment that includes an integrase inhibitor. The first phase seen in the present study with weekly sampling would correspond to phase 1b in that study in humans, with a half-life of 1.8 days, which is consistent with the 1.2–1.3 days found here in humanized mice. Phase 2 here corresponds to phase 2 of that study although the rates are different since in the previous study, the half-life of phase 2 was 5 weeks (28), and here, it is much longer. For MOM, the same phenomenon could be operative in macrophages leading to a biphasic decline, or alternatively, there is much less variability in integration rates in macrophages, which would explain a single phase of decline. It should be pointed out that others have also cast doubt on turnover of infected macrophages being the source of the second phase decline by studying timings of the HIV intracellular lifecycle (24). This explanation based on different integration rates has support from human infection and treatment (28), but variability in other phases of the replication cycle may also explain the observed biphasic decline.
Although humanized mice have been used extensively for HIV research (4), their infection is not the same as human infection; thus, it is possible that different mechanisms are operating in humans. However, the reconstitution of MOM and TOM with human cells and the similar kinetics of virus before and under treatment is an indication that these mice are a good representation of similar processes in human infection. Our study has other limitations, perhaps the most important of which is that the initial viral load in these mice is relatively low, making it difficult to estimate the rate of the second phase of decay with confidence, and indeed, we found large confidence intervals for this estimate. This also makes asserting biphasic decline in MOM difficult. Nevertheless, the simpler results of biphasic decline in TOM and similar first phase half-lives in both MOM and TOM are robust. Another limitation is that we have a small number of TOM mice in our study. Although it would be better to have a more balanced number of mice, and that is the reason why we fitted the two groups separately, the results demonstrate that we have power to detect the statistical improvement of using a biphasic model in TOM (as seen in the BICc values). Finally, one assumption that we made is that the clearance rate of free virus, c, is large in the infected mice, as has been estimated in infected people (26). If it was much slower, than it would be possible that the first phase of decay observed in both MOM and TOM mice (t_1/2_ ~1.2–1.3 days) is due to viral clearance, and the second phase would correspond to the turnover of infected cells. However, this seems very unlikely for several reasons: (i) this hypothesis would imply that the turnover of productively infected cells, which would correspond to the second phase, is much slower than measured before, even though these are human cells infected by HIV; (ii) it would also imply that the similarity of the first phase decay rate with that observed in humans is only a (remarkable) coincidence; and iii) virus clearance in mice is typically fast, as seen for other viruses (31–33).
Overall, modeling the decay of HIV viral load in infected humanized mice under potent antiretroviral therapy indicates that the observed biphasic decline in humans is not due to different populations (lineages) of infected hematopoietic cells, but rather it is an intrinsic dynamical process of infection of CD4+ T cells and, possibly, macrophages.
The reference list from the paper itself. Each links out to its DOI / PubMed record.
- 1Berger EA, Murphy PM, Farber JM. 1999. Chemokine receptors as HIV-1 coreceptors: roles in viral entry, tropism, and disease. Annu Rev Immunol 17:657–700. doi:10.1146/annurev.immunol.17.1.65710358771 · doi ↗ · pubmed ↗
- 2Bosma GC, Custer RP, Bosma MJ. 1983. A severe combined immunodeficiency mutation in the mouse. Nature 301:527–530. doi:10.1038/301527 a 06823332 · doi ↗ · pubmed ↗
- 3Mc Cune JM, Namikawa R, Kaneshima H, Shultz LD, Lieberman M, Weissman IL. 1988. The SCID-hu mouse: murine model for the analysis of human hematolymphoid differentiation and function. Science 241:1632–1639. doi:10.1126/science.241.4873.16322971269 · doi ↗ · pubmed ↗
- 4Wahl A, Garcia JV. 2025. Humanized mouse systems to study viral infection: a new era in immunology research. Annu Rev Immunol 43:143–167. doi:10.1146/annurev-immunol-082223-03571840279306 · doi ↗ · pubmed ↗
- 5Honeycutt JB, Wahl A, Baker C, Spagnuolo RA, Foster J, Zakharova O, Wietgrefe S, Caro-Vegas C, Madden V, Sharpe G, Haase AT, Eron JJ, Garcia JV. 2016. Macrophages sustain HIV replication in vivo independently of T cells. J Clin Invest 126:1353–1366. doi:10.1172/JCI 8445626950420 PMC 4811134 · doi ↗ · pubmed ↗
- 6Endsley JJ, Huante MB, Naqvi KF, Gelman BB, Endsley MA. 2021. Advancing our understanding of HIV co-infections and neurological disease using the humanized mouse. Retrovirology (Auckl) 18:14. doi:10.1186/s 12977-021-00559-z PMC 820688334134725 · doi ↗ · pubmed ↗
- 7Honeycutt J.B, Garcia JV. 2018. Humanized mice: models for evaluating Neuro HIV and cure strategies. J Neurovirol 24:185–191. doi:10.1007/s 13365-017-0567-328831774 PMC 6506160 · doi ↗ · pubmed ↗
- 8Honeycutt JB, Thayer WO, Baker CE, Ribeiro RM, Lada SM, Cao Y, Cleary RA, Hudgens MG, Richman DD, Garcia JV. 2017. HIV persistence in tissue macrophages of humanized myeloid-only mice during antiretroviral therapy. Nat Med 23:638–643. doi:10.1038/nm.431928414330 PMC 5419854 · doi ↗ · pubmed ↗