Level and determinants of district primary healthcare system technical efficiency in Ghana: two-stage stochastic frontier analysis
Beatrice Amboko, Jacob Novignon, Rose Nabi Deborah Karimi Muthuri, Fiammetta Maria Bozzani, Anna Vassall, Edwine Barasa

TL;DR
This study evaluates how efficiently Ghana's districts use health resources for primary care and identifies factors that influence this efficiency.
Contribution
The study applies a two-stage stochastic frontier analysis to assess efficiency and its determinants in Ghana's district-level primary healthcare systems.
Findings
On average, districts operate at 87% efficiency, with potential for a 13% improvement.
Districts with more PHC facilities use resources more efficiently.
Higher income inequality is linked to lower healthcare efficiency.
Abstract
Primary healthcare (PHC) is critical towards achieving Universal Health Coverage (UHC). In Ghana, PHC is organised at the district level and plays a key role in the country’s pursuit of UHC. However, many districts face challenges not only with limited resources but also with how effectively they are used. We examined how efficiently districts in Ghana use their health resources and what factors are associated with this efficiency. We used a two-step stochastic frontier analysis model using data from 181 districts. The output variable was a composite coverage index derived from eight PHC service indicators for 2021, primarily reflecting maternal and child health and infectious disease services. Input variables included district health expenditure for 2020/2021 and the number of health facilities and clinical staff in 2021. We then assessed the associations between efficiency scores…
Genes, proteins, chemicals, diseases, species, mutations and cell lines named across the full text — each resolved to its canonical identifier and authoritative record.
Click any figure to enlarge with its caption.
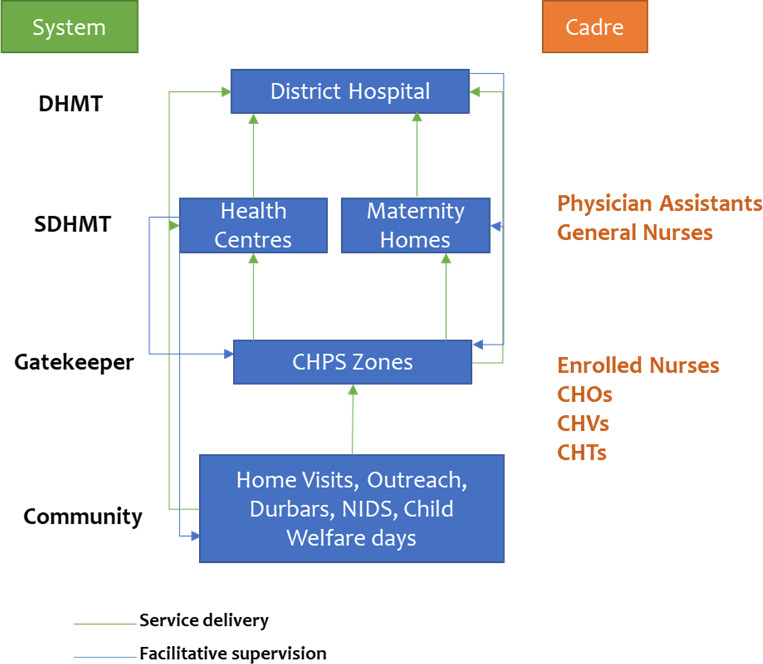 Figure 1
| Variable | Description | Data source | Data transformation |
|---|---|---|---|
| Output variable | |||
| Composite coverage index | A composite variable derived from eight output indicators. Percentage of women (15–49 years) that had family planning demand satisfied using modern methods Percentage of ANC clients who made the fourth visit Percentage of women who had skilled deliveries Measles-Rubella 2 vaccine coverage (ages 18–59 months) BCG vaccine coverage under 1 year Percentage of children that received DPT3 vaccine (under 1) Percentage of TB cases that completed treatment Percentage of ANC registrants that received LLINs | DHIMS2 for the year 2021 | No transformation |
| Inputs | |||
| Number of health facilities | Total number of health facilities per 10 000 population | DHIMS2 for the year 2021 | No transformation |
| Number of clinical staff | Total number of clinical staff per 10 000 population | DHIMS2 for the year 2021 | No transformation |
| Health Expenditure | Total district health expenditure per capita | Health expenditure for the year 2020/2021 | No transformation |
| Exogenous variables | |||
|
| |||
| Health facility type | Proportion of PHC facilities (includes health centres, clinics & CHPS) over all health facilities | DHIMS2 for the year 2021 | No transformation |
| Health insurance coverage | The proportion of the population covered by health insurance | Ghana Population and Housing Census 2021 | Squared |
|
| |||
| Literacy level | The proportion of the population that is literate | Ghana Poverty Mapping Report, 2015 | Squared |
| Gini coefficient | A measure of inequality in welfare distribution | Ghana Poverty Mapping Report, 2015 | Square root |
| Poverty incidence | The proportion of the population living below the national poverty line | Ghana Population and Housing Census 2021 | Square root |
| Urbanisation | The proportion of the population living in urban areas | Ghana Population and Housing Census 2021 | Square root |
|
| |||
| Population density | Number of persons per square kilometre | Ghana Population and Housing Census 2021 | Log |
| Variable | No of observations | Mean | SD | Minimum | Maximum |
|---|---|---|---|---|---|
| CCI (%) | 181 | 74.37 | 8.19 | 51.55 | 97.99 |
| Population | 181 | 130 367 | 69 602.42 | 38 268 | 443 981 |
| Health facilities (per capita) | 181 | 3.44 | 1.50 | 1.00 | 13.30 |
| Clinical staff (per capita) | 181 | 27.56 | 20.29 | 5.09 | 236.04 |
| Budget (per capita) | 181 | 144.72 | 122.53 | 6.74 | 1483.71 |
| Proportion of PHC facilities (%) | 181 | 35.12 | 13.67 | 8.00 | 99.00 |
| Health insurance coverage (%) | 181 | 71.01 | 12.27 | 40.50 | 94.70 |
| Literacy level (%) | 181 | 66.00 | 17.12 | 19.00 | 93.90 |
| Gini coefficient (%) | 175 | 38.78 | 6.15 | 27.20 | 64.00 |
| Poverty incidence (%) | 175 | 27.19 | 19.49 | 1.30 | 92.40 |
| Urbanisation (%) | 181 | 48.84 | 27.32 | 0.00 | 100.00 |
| Population density | 181 | 1070.19 | 2797.94 | 13.50 | 16 759.30 |
| Variable | 1 | 2 | 3 | 4 | 5 | 6 | 7 | 8 | 9 | 12 |
|---|---|---|---|---|---|---|---|---|---|---|
| No of HFs | 1.00 | |||||||||
| No. of clinical staff | 0.38 | 1.00 | ||||||||
| Budget | 0.16 | 0.27 | 1.00 | |||||||
| Proportion of PHC facilities | 0.38 | −0.10 | −0.07 | 1.00 | ||||||
| Health insurance coverage | 0.36 | 0.23 | 0.18 | 0.12 | 1.00 | |||||
| Literacy level | −0.12 | 0.11 | 0.18 | −0.52 | −0.01 | 1.00 | ||||
| Gini coefficient | 0.28 | 0.20 | 0.09 | 0.19 | 0.46 | −0.19 | 1.00 | |||
| Poverty incidence | 0.28 | 0.03 | −0.02 | 0.40 | 0.22 | −0.68 | 0.34 | 1.00 | ||
| Urbanisation | −0.38 | 0.07 | 0.11 | −0.63 | −0.03 | 0.67 | −0.18 | −0.53 | 1.00 | |
| Population density | −0.10 | 0.02 | 0.09 | −0.36 | −0.19 | 0.40 | −0.20 | −0.36 | 0.59 | 1.00 |
| Exogenous variables | Regression coefficient | P value | 95% CI |
|---|---|---|---|
| Proportion of PHC facilities | 0.151 | 0.007 | 0.041 to 0.261 |
| Health insurance coverage | −0.038 | 0.067 | −0.079 to 0.003 |
| Literacy level | −0.002 | 0.955 | −0.055 to 0.052 |
| Urbanisation | 0.022 | 0.275 | −0.012 to 0.062 |
| Population density | 0.002 | 0.628 | −0.010 to 0.006 |
| Poverty incidence | −0.001 | 0.690 | −0.006 to 0.004 |
| Gini coefficient | −0.858 | 0.006 | −1.146 to −0.252 |
- —http://dx.doi.org/10.13039/100000865Bill and Melinda Gates Foundation
Peer Reviews
No public reviews on file for this paper yet. If you reviewed it on a platform where reviews are public (OpenReview, ICLR, NeurIPS, ICML), you can paste yours below so the community can read it here.
Videos
No videos yet. Explain this paper in a talk, walkthrough, or lecture? Add one.
Taxonomy
TopicsGlobal Maternal and Child Health · Global Health Care Issues · Healthcare Systems and Reforms
Background
Like many other low- and middle-income countries, Ghana has pledged to achieve Universal Health Coverage (UHC).1 In 2020, Ghana’s current spending on health was 4% of the country’s gross domestic product,2 which was below the 5% recommended level for achieving UHC. In line with Ghana’s push for UHC, the country has a decentralised governance system for health.35 Decentralisation has been endorsed as a fundamental reform for improving the provision of public health services.6 7 Ghana adopted a mixed type of administrative decentralisation of health governance that includes delegation, deconcentration and, more recently, devolution.4812 The Ministry of Health (MoH) is the main governing body responsible for policy-making, national planning, coordination and overseeing teaching and specialised hospitals.3 8 The MoH delegated service delivery to a semi-autonomous agency, the Ghana Health Service (GHS), established in 1996 under the Ghana Health Service and Teaching Hospitals Act 525.358 10 11 13 14
Ghana has a three-tier health delivery system comprising district (primary), regional (secondary) and national (tertiary) levels. Primary healthcare (PHC) is delivered at the district level. The district health services are organised into three levels. The first level is the district level, which includes district hospitals that provide preventive, curative and promotive healthcare services. The second level comprises sub-district health centres, clinics and maternity homes, which serve as the first point of contact with the formal health system and provide basic preventive and curative services. The third and lowest level is the Community-based Health and Planning Services (CHPS), which provide preventive, promotive and treatment of common/minor illnesses (figure 1).1
Ghana PHC system.1 Durbars are community gatherings used to share health information, promote education and engage the public in culturally significant ways. Abbreviations: SDHMT: Sub-District Health Management Team; CHOs: Community Health Officers; CHPS: Community-Based Health Planning and Services; CHTs: Community Health Teams; CHVs: Community Health Volunteers; DHMT: District Health Management Team; NIDS: National Immunisation Days.
Districts have their own District Assembly Common Funds that provide the necessary resources for meeting the development needs of their communities. However, more than half of district-level expenditures are executed at the central level, specifically for payment of staff and investments. The districts do not have absolute control over their spending, with centrally defined guidelines dictating some allocations. Moreover, some funds are earmarked for specific programmes. The districts rely on the government budget, financial credits, internally generated funds, national health insurance scheme reimbursements and donor-funded programmes.5
The performance of district health systems can, therefore, be attributed to their ability to efficiently and effectively allocate and use the available resources. Moreover, achieving UHC in Ghana will need additional funding, which can only be justified if the current resources are efficiently used.15 16 Improved health system efficiency has been reported to create fiscal space for health by freeing up or reallocating resources within existing budgets to increase investment in health.15 17 Efficiency is the degree to which a system meets its objectives given the invested resources. Technical efficiency is accomplished when the allocation of resources is such that outputs are maximised for a given level of inputs or inputs are minimised for a given level of output.18
Understanding health system efficiency and the factors associated with it is an important research and policy question, given the important role of efficiency in improving the use of available resources and unlocking additional resources. The technical efficiency of health systems has been examined across Africa.1922 In Ghana, several studies have reported variations in efficiency and the associated factors at the health facility level.2328 However, there is currently no evidence on the efficiency of the district PHC system or the factors associated with it. We aimed to address this critical research gap by estimating the technical efficiency of district PHC systems in Ghana, with a particular focus on PHC outputs. We also aimed to identify key determinants of efficiency at the district level. This innovative approach shifts the lens from individual health facilities to entire district health systems, key operational units within Ghana’s decentralised healthcare system. Examining the efficiency of the district health systems in Ghana is important due to their central role in providing PHC and significant consumption of resources. For instance, the district health system consumed 50% of the MoH spending in the fiscal year 2006–2008.5 In this study, we estimated the technical efficiency of district PHC systems in Ghana and its determinants using a proxy for PHC outputs based on a composite index that primarily reflects maternal, child health and infectious disease services.
Methods
Study design
This was a cross-sectional study using secondary data to parametrise a stochastic frontier analysis (SFA) model of PHC service provision at the district level in Ghana.
Data sources
The data utilised for this study were obtained from the District Health Information Management System 2 (DHIMS2) for 2021, 2020/2021 budget allocation reports, 2021 population and housing census, and the poverty mapping report for 2015, as outlined in table 1. Data from 260 (95%) districts from 16 regions in Ghana was available. We included 181 (66%) districts in the efficiency analysis after dropping districts with missing clinical staff (3), budget (26), admissions (46), TB treatment (3) and HIV prevalence data (1) data. A total of 175 (64%) districts were included in the analysis of the effect of exogenous variables on efficiency due to missing data for poverty incidence and the Gini coefficient (6).
Table 1 outlines the variables used in the SFA model, their definitions, sources and data transformation. The input variables used in the efficiency estimation represent different types of resources, including:
Total number of public health facilities.Total number of clinical staff.District health expenditure.
The inputs were carefully selected to reflect physical, human and financial resources available for PHC service delivery in the districts. While we acknowledge that these variables do not fully reflect available resources in the districts, our choice was limited by readily available data. The number of public health facilities (hospitals, polyclinics, health centres, clinics, maternity homes and CHPS compounds) reflects physical infrastructure or capital, a basic requirement for our health production function. The clinical staff includes nurses, doctors and laboratory technicians, among others, who represent labour in our production function. A detailed list of health personnel by district is provided in online supplemental file 1. The health expenditure variable represents district-level spending on recurrent items like staff compensation and procurement of health commodities necessary for healthcare delivery in the districts. Most of the output and input data were obtained from the DHIMS2 for 2021 per district. The district health expenditure data was extracted from the budget allocation report for the year 2020/2021.
The output variable was a composite coverage index (CCI), a summary measure of service coverage.29 The CCI was calculated as a weighted average of coverage across eight key PHC interventions, grouped along four stages of the continuum of care: family planning, maternal and newborn care, immunisation and treatment of sick children.30 These stages represent critical points in the delivery of essential health services, particularly for women and children. Originally developed to support global health monitoring and equity assessments in LMICs, the CCI enables meaningful cross-district comparisons and is well-suited for efficiency analysis in such settings.
We selected the CCI because it aligns with Ghana’s UHC goals and the services typically delivered through the district-level PHC system. These output indicators are a fair reflection of the Ghana district PHC service delivery system, which plays key roles in providing preventive and curative care at the frontline. While the CCI is a widely used and policy-relevant metric, it predominantly reflects maternal, newborn and child health (MNCH) services. It does not explicitly account for other essential PHC components such as non-communicable disease (NCD) care, adult health or mental health services. Despite these limitations, it remains a practical proxy for evaluating PHC coverage in contexts with limited comprehensive routine data. Data on the district-level coverage of the eight PHC interventions were obtained from the DHIMS2 for the year 2021. The CCI was weighted and computed as detailed below and summarised in table 1.
where:
CCI - composite coverage index,
FP - family planning demand satisfied with modern methods,
ANC4 - completed four antenatal care visits,
SBA - skilled birth attendance,
BCG - BCG vaccine coverage,
DPT3 - DPT3 vaccine coverage,
LLIN - long-lasting insecticide-treated net coverage and
TB - completed treatment of tuberculosis.
We used various exogenous variables from the health system and socioeconomic factors (see table 1). We used suitable transformations for non-normally distributed variables after examining their distributions. The most suitable transformation for each variable was determined using the gladder command in Stata (table 1).
Data management and analysis
Data were collated into an Excel spreadsheet, cleaned and exported to Stata version 17 (StataCorp, College Station, TX, USA) for all the descriptive and inferential analyses. The analytical approach consisted of two stages. First, SFA was used to determine the technical efficiency of the production units, in this case, the districts, allowing us to rank districts according to a technical efficiency score and to compute the average technical efficiency score across districts. Second, we evaluated the relationship between the estimated efficiency and district characteristics.31 At this stage, tobit regression of the exogenous variables against the predicted efficiency scores was undertaken across the districts. Descriptive statistics, such as mean, SD, range of inputs, outputs and exogenous variables, were computed.
SFA is a parametric econometric technique used to estimate production or cost frontiers and measure efficiency across decision-making units like hospitals, districts and countries.32 33 Unlike traditional regression models, SFA introduces a composed error term where one component captures statistical noise (random shocks or measurement error) and the other represents inefficiency. The basic model expresses output as a function of inputs multiplied by a stochastic term reflecting these two effects. SFA is widely applied in fields such as healthcare for benchmarking performance, as it provides both frontier estimates and unit-specific efficiency scores, making it a key tool for identifying and addressing performance gaps.
We estimated output-oriented efficiency, assuming that each district could increase their outputs using a fixed quantity of inputs. We estimated output-oriented efficiency per district using the Battese and Coelli model, assuming the Cobb-Douglas functional form of production frontier due to its simplicity.33 34 The SFA model was specified as below:
where:
Output: district-level CCI,
Inputs: total number of health facilities (HF), clinical staff (CS) and health expenditure in each district.
V_i_: Symmetric random error term, accounting for statistical noise.
µ_i_: Non-negative inefficiency term, representing a deviation from the frontier (assumed to follow a distribution such as half-normal, truncated normal or exponential).
We then predicted the efficiency scores across the districts. To avoid the problem of multicollinearity in estimating the production function, we examined the correlation among and between inputs and exogenous variables using Pearson’s correlation coefficient. Correlation coefficients above a cut-off of 0.8 were considered to be highly correlated.35 This was followed by backward selection to include only less correlated variables in the analyses of associations between exogenous variables and technical efficiency. An exogenous variable with a p-value of <0.05 was considered statistically significant. The results are presented as coefficients with a 95% confidence interval (CI).
Patient and public involvement
Patients and/or the public were not involved in the design, or conduct, or reporting, or dissemination plans of this research. The reflexivity statement for this paper is linked as an online supplemental file 2.
Results
The descriptive statistics of inputs, outputs and exogenous variables are presented in table 2. On average, the population density across the districts was 1070 per km^2^, ranging between 14 and 16 759. There are wide differences between the minimum and maximum values for all the input and output variables, signifying uneven distribution and utilisation of resources across the districts. Specifically, the number of health facilities ranged from 1 to 13, clinical staff from 5 to 236 and expenditure from 7 to 1484 per 10 000 population. The mean CCI was 74% (SD: 8.2), ranging between 52% and 98% across the districts (table 2).
From the first stage of the SFA, the mean predicted efficiency across all the districts was 86.8% (SD: 6.58), ranging between 65.2 and 99.2%. The predicted technical efficiency scores for each district are provided in online supplemental file 3. A total of 175 (63.6%) districts were included in the second stage analysis of the determinants of efficiency. Table 3 outlines the correlation results among and between the inputs and exogenous variables. None of the variables was highly correlated. We, therefore, included all of them in the analysis of the factors.
Findings from the second stage analysis revealed two factors significantly associated with technical efficiency within the districts. These were the proportions of PHC facilities and the Gini coefficient. The proportion of PHC facilities within a district was positively associated with the technical efficiency of the district PHC systems. Conversely, the Gini coefficient was negatively associated with efficiency. There was no statistically significant association between efficiency and health insurance coverage, literacy levels, urbanisation, population density or poverty incidence (table 4).
Discussion
In this study, we have reported how efficiently PHC services are delivered at the district level in Ghana. The results suggest that while many districts perform reasonably well, there is still significant room to improve resource use. On average, districts could improve their efficiency in PHC service delivery by 13% without additional resources. However, the performance varies widely across the country. For example, 24 districts had efficiency scores below 80%, with some as low as 65%. This means they could potentially increase their PHC service output by 20% to 35% using the same inputs. On the other hand, only nine districts had efficiency scores above 95%. These findings highlight that Ghana’s district PHC systems are characterised by some technical inefficiencies. This is slightly lower than the level of inefficiency of an average of 30% reported from Kenya36 and 20% reported across the African Region.37 38
The second stage of regression of the efficiency scores against the exogenous variables revealed that a higher proportion of PHC facilities was associated with greater technical efficiency of the district PHC systems. In contrast, a higher Gini coefficient was associated with lower efficiency.
The positive association between a high proportion of PHC facilities and higher technical efficiency might be explained by the fact that a higher proportion of PHC facilities increases access to healthcare. In Ghana, the mean proportion of PHC facilities is 89%, with the highly efficient districts having a range of between 83% and 94%, while the least efficient districts have a range of between 63% and 87%. The positive association might be due to the CHPS initiative implemented in Ghana, which includes the construction of CHPS compounds and the deployment of community health officers and community health volunteers who deliver health services at the doorsteps of the community. The CHPS initiative has been reported to have improved access to and coverage of health services, including antenatal care and skilled deliveries.3946
The Gini coefficient was negatively associated with the technical efficiency of the district PHC systems, signifying that higher income inequalities lead to inefficiency. This finding aligns with other research showing that when wealth is unequally distributed, fewer people can access and benefit from healthcare services.22 Interestingly, we did not find a significant association between efficiency and other factors like insurance coverage, education levels, poverty rates, urbanisation or population density. This contrasts with other studies that reported a significant association between efficiency and population density, urbanisation and literacy levels.22 36 The lack of association with health insurance coverage is of particular interest as it has close linkages with healthcare utilisation and delivery. The lack of significant association in Ghana may be attributed to the numerous implementation challenges facing the national health insurance scheme, reducing its effectiveness in improving healthcare service delivery.10 47 48
The current discussions call for relevant policies to ensure that health sector resources are used efficiently, particularly at the primary care level.49 50 The study’s findings highlight the need for district health departments to identify ways of improving the efficiency of district PHC systems. For instance, districts with a low proportion of PHC facilities could prioritise increasing their numbers while enhancing the readiness and availability of services in new and existing facilities. To ensure sustainable gains, strategies such as strengthening community health programmes by improving the availability of trained personnel, essential supplies and supportive supervision can enhance service delivery at the frontline. Moreover, optimising resource allocation and strengthening coordination mechanisms between district health management teams and facility leadership could mitigate inefficiencies in budget execution and workforce distribution. There is also a need for the national government, together with all relevant stakeholders, to scale up social protection programmes and policies to reduce poverty and inequality, which undermine the ability to seek healthcare services. Addressing structural issues such as income inequality, identified in our study as significantly associated with inefficiency, requires multisectoral action, including fiscal redistribution, education and employment programmes. Finally, implementing regular district-level efficiency audits and incorporating efficiency metrics into district performance frameworks may help institutionalise accountability and foster continuous improvement.
This study faced some limitations. A key limitation of this study was the use of a service coverage index, which predominantly captures MNCH and infectious disease services, excluding much of the broader PHC scope. This narrow focus does not capture the growing burden of NCDs, which now account for nearly half of all mortality in Ghana. Hence, the efficiency scores largely reflect MNCH performance rather than the full scope of PHC. Future research should expand coverage indicators to include a broader range of PHC services, including NCD care, for a more comprehensive efficiency assessment. Also, there was a lack of data for some output indicators, which may have impacted our estimates. Additionally, in estimating the technical efficiency of the district PHC system, we may not have fully accounted for various structural and organisational factors that influence service coverage that are challenging to quantify, such as political influence, facility locations and supervision capacity. These limitations underscore the importance of mixed methods approaches in evaluating efficiency, allowing for documentation of influential factors that may not be captured quantitatively. Finally, the study included data from only a year (2021), limiting our ability to analyse efficiency trends or technological changes over time. Future studies could benefit from covering additional years to better assess these trends.
Conclusion
This study found that while PHC systems at the district level in Ghana are performing relatively well, there is still room to improve how efficiently resources are used. These differences suggest that some districts can deliver services more efficiently than others, though the underlying drivers may be complex and context specific. To enhance PHC performance in Ghana, focused efforts are needed to help less efficient districts to catch up. Policymakers aiming to strengthen the efficiency of PHC service provision in Ghana may wish to explore the factors associated with higher efficiency, such as increasing the proportion of PHC facilities and addressing within-district economic inequality. Strengthening efficiency across all districts could contribute to a fair and impactful use of health resources.
Supplementary material
10.1136/bmjgh-2024-018847online supplemental file 1
10.1136/bmjgh-2024-018847online supplemental file 2
10.1136/bmjgh-2024-018847online supplemental file 3
The reference list from the paper itself. Each links out to its DOI / PubMed record.
- 1Ministry of Health Ghana’s roadmap for attaining universal health coverage 2020-2030 Accra, Ghana 2020
- 2World Health Organization Global health expenditure database 2019
- 3Couttolenc BF Decentralization and Governance in the Ghana Health Sector World Bank Publications 2012
- 4Kwamie A van Dijk H Ansah EK et al The path dependence of district manager decision-space in Ghana Health Policy Plan 2016313566610.1093/heapol/czv 06926318537 PMC 4779147 · doi ↗ · pubmed ↗
- 5Saleh K The Health Sector in Ghana: A Comprehensive Assessment World Bank Publications 2013
- 6Bossert T Analyzing the decentralization of health systems in developing countries: decision space, innovation and performance Social Science & Medicine 19984715132710.1016/S 0277-9536(98)00234-29823047 · doi ↗ · pubmed ↗
- 7Mills A Vaughan JP Smith DL et al Health system decentralization: concepts, issues and country experience: World Health Organization 1990
- 8Mayhew SH The impact of decentralisation on sexual and reproductive health services in Ghana Reprod Health Matters 200311748710.1016/s 0968-8080(03)02171-212800705 · doi ↗ · pubmed ↗