Metagenomic analysis of fecal microbiomes reveals genetic potential for diverse hydrogen management strategies in marsupials
Kate L. Bowerman, Yang Lu, Harley McRae, James G. Volmer, Julian Zaugg, Phillip B. Pope, Philip Hugenholtz, Chris Greening, Mark Morrison, Rochelle M. Soo, Paul N. Evans

TL;DR
The study finds that marsupial gut microbiomes have diverse hydrogen management strategies, which may explain their lower methane emissions compared to ruminants.
Contribution
This is the first systematic characterization of hydrogen-cycling genetic potential in marsupial gut microbiomes.
Findings
Marsupial gut microbiomes show heterogeneous hydrogen management strategies, including elevated methanogenesis genes and alternative hydrogen sinks.
Variation in hydrogen management occurs both between and within marsupial families and gut types.
Some marsupials harbor genes for nitrate/nitrite and sulfite reduction, suggesting alternative electron acceptor pathways.
Abstract
Methane is an end product of plant biomass digestion by gut microbiota, though the amount produced and/or released varies between hosts. On a per-unit-of-feed basis, macropodid marsupials (e.g., kangaroos) have been reported to emit less methane than ruminant livestock, despite a similar diet, although measurements exist for only a subset of macropodid species. Competition for hydrogen within the gut microbiome, particularly through alternative hydrogen sinks to methanogenesis, influences methane production; therefore, characterizing hydrogen management strategies within a host system can provide insights into methane emission profiles. In this study, we analyzed 33 fecal microbiomes of 14 marsupial species (predominantly captive animals) to provide the first systematic characterization of methanogen types and hydrogen-cycling genetic capacity across marsupial gut microbiomes. We…
Genes, proteins, chemicals, diseases, species, mutations and cell lines named across the full text — each resolved to its canonical identifier and authoritative record.
Click any figure to enlarge with its caption.
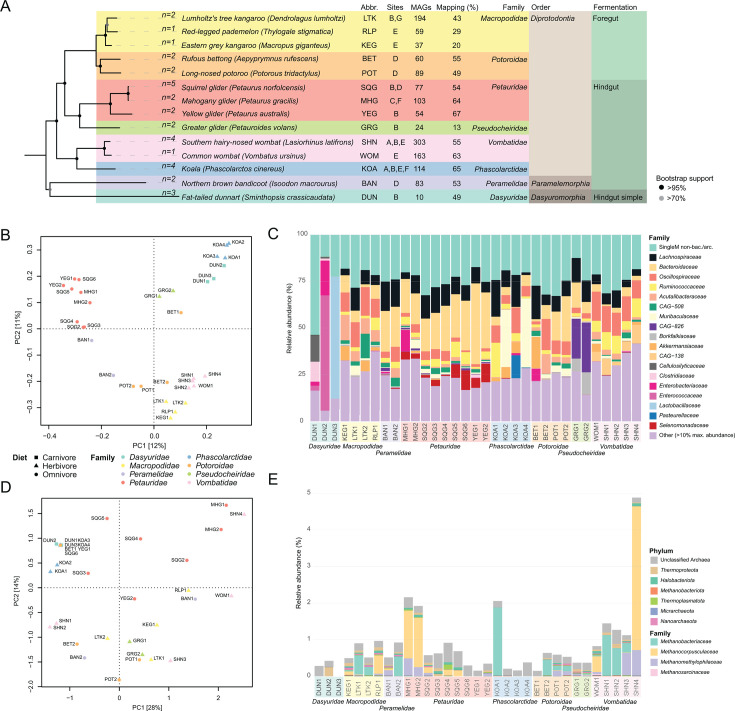 Fig 1
Fig 1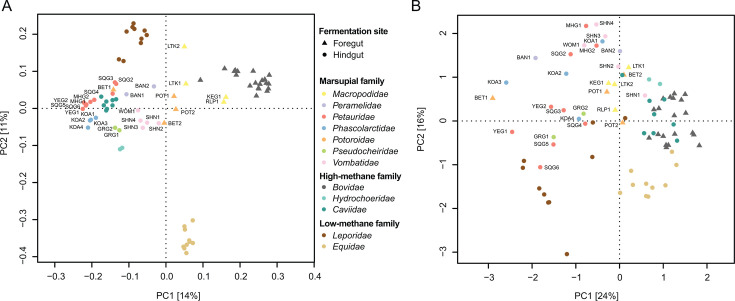 Fig 2
Fig 2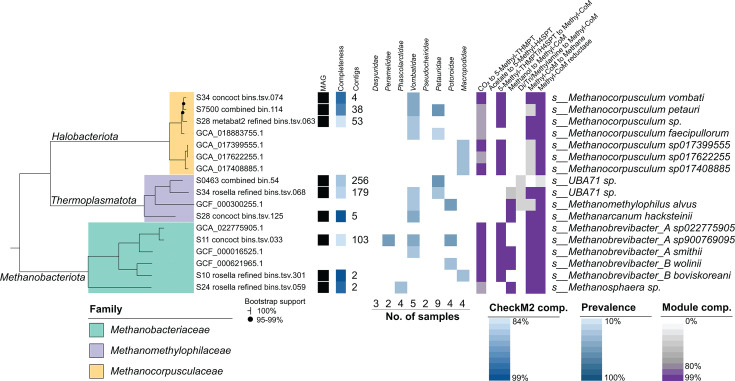 Fig 3
Fig 3| Sample | Species | Common name | Location |
|---|---|---|---|
| DUN1 |
| Fat-tailed dunnart | Currumbin Wildlife Sanctuary |
| DUN2 |
| Fat-tailed dunnart | Currumbin Wildlife Sanctuary |
| DUN3 |
| Fat-tailed dunnart | Currumbin Wildlife Sanctuary |
| LTK1 |
| Lumholtz’s tree kangaroo | Currumbin Wildlife Sanctuary |
| LTK2 |
| Lumholtz’s tree kangaroo | Wongabel State Forest (wild) |
| KEG1 |
| Eastern-gray kangaroo | Lone Pine Koala Sanctuary |
| RLP1 |
| Red-legged pademelon | Lone Pine Koala Sanctuary |
| BAN1 |
| Northern brown bandicoot | Hidden Vale Research Station |
| BAN2 |
| Northern brown bandicoot | Hidden Vale Research Station |
| YEG1 |
| Yellow glider | Currumbin Wildlife Sanctuary |
| YEG2 |
| Yellow glider | Currumbin Wildlife Sanctuary |
| MHG1 |
| Mahogany glider | Wildlife Habitat |
| MHG2 |
| Mahogany glider | David Fleay Wildlife Park |
| SQG2 |
| Squirrel glider | Currumbin Wildlife Sanctuary |
| SQG3 |
| Squirrel glider | Currumbin Wildlife Sanctuary |
| SQG4 |
| Squirrel glider | Hidden Vale Research Station |
| SQG5 |
| Squirrel glider | Hidden Vale Research Station |
| SQG6 |
| Squirrel glider | Hidden Vale Research Station |
| KOA1 |
| Koala | Currumbin Wildlife Sanctuary |
| KOA2 |
| Koala | Lone Pine Koala Sanctuary |
| KOA3 |
| Koala | Wildlife Habitat |
| KOA4 |
| Koala | Cairns Tropical Zoo |
| BET1 |
| Rufous bettong | Hidden Vale Research Station |
| BET2 |
| Rufous bettong | Hidden Vale Research Station |
| POT1 |
| Long-nosed potaroo | Hidden Vale Research Station |
| POT2 |
| Long-nosed potaroo | Hidden Vale Research Station |
| GRG1 |
| Greater glider | Currumbin Wildlife Sanctuary |
| GRG2 |
| Greater glider | Currumbin Wildlife Sanctuary |
| SHN1 |
| Southern hairy-nosed wombat | Currumbin Wildlife Sanctuary |
| SHN2 |
| Southern hairy-nosed wombat | Currumbin Wildlife Sanctuary |
| SHN3 |
| Southern hairy-nosed wombat | Cairns Tropical Zoo |
| SHN4 |
| Southern hairy-nosed wombat | Lone Pine Koala Sanctuary |
| WOM1 |
| Common wombat | Lone Pine Koala Sanctuary |
- —Department of Education and Training | Australian Research Council (ARC)
- —Department of Education and Training | Australian Research Council (ARC)
- —Department of Education and Training | Australian Research Council (ARC)
- —Australian Government (Federal Government)
- —Meat and Livestock Australiahttp://dx.doi.org/10.13039/501100001054
- —University of Queenslandhttp://dx.doi.org/10.13039/501100001794
Peer Reviews
No public reviews on file for this paper yet. If you reviewed it on a platform where reviews are public (OpenReview, ICLR, NeurIPS, ICML), you can paste yours below so the community can read it here.
Videos
No videos yet. Explain this paper in a talk, walkthrough, or lecture? Add one.
Taxonomy
TopicsAnaerobic Digestion and Biogas Production · Gut microbiota and health · Hydrogen's biological and therapeutic effects
INTRODUCTION
Hydrogen management is a key component shaping gut microbiome community structures (1). Gut bacteria produce hydrogen during fermentation of plant biomass, requiring the activity of hydrogen-consuming organisms to maintain the low hydrogen partial pressure necessary for fermentation to be energetically favorable (2). While methanogenic archaea represent one major hydrogen sink, coupled to their production of methane, alternative pathways such as reductive acetogenesis, sulfate reduction, and nitrate ammonification compete with methanogenesis for available hydrogen (3, 4). The balance between these pathways and methane production varies substantially across different species, influenced by differences in gut physiology and diet; however, many hosts remain uncharacterized (5, 6).
Marsupials display diverse digestive physiology, including foregut-fermenting species, such as kangaroos and wallabies (macropodids), and hindgut fermenters including wombats and koalas (7). Quantitative measurements from four macropodid species revealed these animals emit 4- to 10-fold lower methane compared to foregut-fermenting ruminant livestock per unit of equivalent feed (6, 8–11). This apparent low-methane phenotype has been attributed to the shorter gastrointestinal tract and lower retention time of digesta relative to ruminants, resulting in decreased hydrogen levels that limit methane production (9, 12). However, increased abundance of fermentative bacteria that produce succinate and/or propionate as an electron sink without producing hydrogen may also play a role, for example, the large populations of Succinivibrionaceae associated with reduced methane emissions in the Tammar wallaby (13). While methanogenic archaea have been detected in both the macropodid foregut and in fecal samples from hindgut-fermenting marsupials at low abundance (14–17), their metabolic capabilities and substrate preferences are unclear, as is the extent to which alternative hydrogen-consuming bacteria compete with methanogens across different marsupial lineages.
Recent genome-resolved metagenomic studies of ruminants have revealed that microbial community differences in hydrogen management capacity provide a genetic basis for variation in methane production levels between high- and low-methane animals (3, 18). Low-methane cattle show enrichment of bacterial genes encoding membrane-bound hydrogen-uptake hydrogenases for hydrogenotrophic respiration, reductant disposal pathways including propionate and butyrate production, and terminal reductases for nitrate and sulfate reduction, while high-methane cattle show greater abundance of fermentative hydrogen-producing hydrogenases and methanogenesis genes (18). Similar shifts toward succinate, lactate, and propionate production have been associated with low-methane-emitting cattle and sheep (19–23). Conversely, reduced methane production can also reflect the increased activity of hydrogen-consuming bacteria that reduce the electron pool available for methanogens. Indeed, recent studies have suggested ruminants harbor novel lineages of acetogenic bacteria and various hydrogenotrophic respiratory microbes that use electron acceptors such as fumarate, nitrate, and sulfate (3, 23–26). These findings suggest that characterizing the genetic complement of hydrogen-cycling genes can reveal the mechanistic basis for alternative hydrogen management strategies, even when active metabolic rates cannot be directly measured.
Here, we use genome-resolved metagenomic analyses of 33 fecal microbiomes of 14 marsupial species, from predominantly captive animals, to investigate the key pathways and mediators of hydrogen cycling and methane formation in these animals. We employ comparative analysis against fecal microbiomes of high- and low-methane-emitting mammals of varied gut types to identify differentially enriched hydrogen-metabolizing genes and pathways. Through recovery of 1,394 metagenome-assembled genomes (MAGs) and functional annotation of methanogens and hydrogen-cycling genes, including hydrogenases, terminal reductases, and enzymes for alternative fermentation products, we provide the first characterization of genetic hydrogen management capacity across marsupial fecal microbiomes and extend the framework for understanding microbial contributions to methane production diversity in herbivorous mammals.
MATERIALS AND METHODS
Sample collection
Fecal samples were collected from 14 species of marsupial from predominantly captive environments in Queensland, Australia (Table 1; Table S1). Species included were the fat-tailed dunnart (Sminthopsis crassicaudata, n = 3), Lumholtz’s tree kangaroo (Dendrolagus lumholtzi, n = 2), eastern gray kangaroo (Macropus giganteus, n = 1), red-legged pademelon (Thylogale stigmatica, n = 1), northern brown bandicoot (Isoodon macrourus, n = 2), yellow glider (Petaurus australis, n = 2), mahogany glider (Petaurus gracilis, n = 2), squirrel glider (Petaurus norfolcensis, n = 5), koala (Phascolarctos cinereus, n = 4), rufous bettong (Aepyprymnus rufescens, n = 2), long-nosed potaroo (Potorous tridactylus, n = 2), greater glider (Petauroides volans, n = 2), southern hairy-nosed wombat (Lasiorhinus latifrons, n = 4), and common wombat (Vombatus ursinus, n = 1). Fecal samples were stored at −80°C as soon as possible following collection. Public data sets incorporated into this study are available under NCBI BioProjects PRJEB50625 (27), PRJNA752224 (28), PRJNA987743 (29), PRJNA1102860 (30), SRP012966 (31), and PRJNA340521 (32). Only fecal samples were included (Table S2).
Sample preparation and metagenomic sequencing
Total genomic DNA was extracted from approximately 60 mg–200 mg of fecal material. Samples were homogenized at 2,000 rpm for 5 min using the MoBio PowerLyzer24 in a MoBio bead tube containing 0.1 mm diameter zirconia/silica beads and 750 µL of TLA buffer (Promega, WI, USA). The supernatant was recovered via centrifugation at 10,000 g for 30 s. DNA was extracted from 150 µL of supernatant using the Maxwell 16 robotic system and the corresponding Tissue DNA kit (Promega, WI, USA) following the manufacturer’s instructions.
Illumina sequencing libraries were prepared using the Nextera DNA Library Preparation kit (Illumina, CA, USA). Samples were sequenced on the NovaSeq 6000 platform, with some samples supplemented with data generated using the HiSeq 2000 platform, producing ~7 Gb of 150 bp paired-end reads per sample.
Oxford Nanopore sequencing was performed on a PromethION instrument using an R10.4.1 flow cell following sample preparation with the Ligation Sequencing Kit SQK-NBD114-24 (Oxford Nanopore, UK). Samples were multiplexed using native barcoding and run using adaptive sampling, generating ~5 Gb per sample with an average read length of 800 bp. Five archaeal MAGs were used as a positive filter for adaptive sampling using MinKNOW v.23.07.5. Enrichment of archaeal populations was estimated by comparison of their relative abundance between Illumina and Nanopore sequencing runs (Table S3). Guppy v.7.0.9 was used for initial base-calling in high-accuracy mode. Subsequent recalling to super-high accuracy was undertaken using Dorado v.0.5.2 (https://github.com/nanoporetech/dorado) following pod5 conversion with pod5 v.0.3.10 (https://github.com/nanoporetech/pod5-file-format).
Data assembly
Illumina data were quality trimmed and cleaned of adapters using Trimmomatic v.0.39 (33). Read counts pre- and post-trimming for all data were generated using SeqKit v.2.4.0 (34). The trimmed reads were then assembled with MEGAHIT v.1.2.9 (35). Reads were mapped to assembled contigs using BamM (https://github.com/Ecogenomics/BamM) and binned using MetaBAT2 v.2.15 (36).
Sequence barcodes were removed from Nanopore sequence data using Porechop v.0.2.4 (https://github.com/rrwick/Porechop), and reads with mid-strand barcodes were also removed. Hybrid assembly of Nanopore and Illumina data from the same samples was undertaken using Aviary v.0.8.3 (https://github.com/rhysnewell/aviary) with default parameters. Binning was performed by Aviary v.0.8.3 employing Rosella v.0.5.3 (https://github.com/rhysnewell/rosella), MetaBAT1 and MetaBAT2 v.2.15 (36), and CONCOCT v.1.1.0 (37) based on read mapping of all five Nanopore-targeted samples to each assembly. DAS Tool v.1.1.6 (38) was used to determine a non-redundant MAG set.
All MAGs were quality assessed using CheckM v.1.2.2 (39) and CheckM2 v.1.0.2 (40), and classified using GTDB-Tk v.2.3.0 (41) against GTDB releases 08-RS214 and 09-RS220 (42, 43). Nanopore- and Illumina-based MAGs exceeding 50% completeness with ≤5% contamination according to either CheckM or CheckM2 were combined and dereplicated at 99% average nucleotide identity (80% alignment fraction) using CoverM v.0.7.0 (44) applying the “Parks2020_reduced” quality formula.
Genome database
Public genomes to be included in the final genome database were selected from those within GTDB release 08-RS214 (42, 43) based on relative abundance and coverage values generated using CoverM v.0.7.0 (44). Genomes were included that achieved a relative abundance of >0.05% and >0.1× coverage in at least one sample. Selected genomes were combined with the dereplicated sample MAGs (≥50% complete with ≤5% contamination), and the combined set was dereplicated at 95% average nucleotide identity (60% alignment fraction) using CoverM v.0.7.0, applying the “Parks2020_reduced” quality formula. Community profiling was undertaken using relative abundance values generated from mapping short-read data to this database using CoverM v.0.7.0 “genome.” BWA (45), implemented within CoverM, was used for Illumina read mapping with the parameter “-k 31,” while Minimap2 (46) option “-p minimap2-hifi” was used for Nanopore data (used for host DNA estimation and evaluation of adaptive sequencing only). Read alignments were filtered for those achieving ≥95% identity across ≥90% of the read length. Genomes were functionally annotated using DRAM v.1.5.0 (47) with the KOfam (48), Pfam (49), and dbCAN (50) databases, accessed 21 February 2024. Contigs not recruited into MAGs were compiled for assessment of the taxonomic composition of unmapped reads using MMseqs2 v.15-6f452 (51) “easy-taxonomy” against the NCBI NR protein database (52) for taxonomic inference.
Host tree
The marsupial host phylogenetic tree was inferred using three nuclear (IRBP, BRCA1, vWF) and two mitochondrial genes (CYTB, ND2), which were selected based on sequence availability (Table S4). Sequences were aligned using MAFFT v.7.490 (53) and trimmed of gaps present in >10% of sequences using trimAl v.1.4.1 (54). Maximum-likelihood trees were inferred using IQ-TREE v.2.2.2.3 (55), using ModelFinder for model selection with gene and codon partitioning. Bootstrap support was generated from 100 replicates.
Host DNA estimation
An estimate of host DNA contamination was created using available marsupial genomes in combination with a set of exon capture sequences (56) (Table S5). Due to the absence of full-length genomes for all hosts, this analysis is considered to provide only a minimum estimate of host DNA contamination. Read mapping was undertaken using BWA (45), as above. Estimated host DNA was calculated based on read numbers aligning with ≥95% identity across ≥90% of the read length, determined using CoverM v.0.7.0.
Marker gene-based community profiling
SingleM v.0.16.0 (57) was used for marker gene-based community profiling using the GTDB release 08-RS214 metapackage, with the “condense” function used to summarize data across markers, and SingleM microbial_fraction used to estimate the bacterial and archaeal community fraction (58).
Protein database creation and functional annotation
The gene database was created from proteins within assembled contigs from marsupial and ruminant samples annotated using Prodigal v.2.6.3 (59). Proteins were clustered at 90% identity across 80% of protein length using MMseqs2 v.14-7e284 (51). Representative protein sequences were functionally annotated using DRAM v.1.5.0 (47) with the KOfam (48), Pfam (49), and dbCAN (50) databases accessed 21 February 2024.
Protein abundance within samples was calculated based on read alignment using DIAMOND v.2.1.0 (60) to the protein database, filtering for sample reads ≥140 bp with Seqkit v.2.4.0 (34) (excepting public data set PRJNA987743, where read length was 120 bp). Alignments were filtered using settings evalue 0.00001, min-score 40, query-cover 80, id 70, max-hsps 1, and max-target-seqs 1. Alignment of reads to the single-copy marker genes included within the SingleM GTDB release 08-RS214 metapackage (57) was undertaken using the same settings. Reads per kilobase per million mapped reads (RPKM) values were calculated for both the protein database and SingleM marker genes, with the mean RPKM value across all SingleM markers used to normalize protein database values on a per-sample basis. Normalized RPKM values per protein were summed across equivalent functional annotations (e.g., KEGG orthologs or hydrogenase groups) and log_2_-transformed for PCA and differential abundance analysis.
Hydrogenase classification
Pfam annotations from DRAM were used to collate a set of hydrogenase proteins present in the protein database or in MAGs based on hydrogenases listed in Greening et al. (3) (Table S6). Collated protein sequences from the protein database were clustered at 50% identity, and representatives were submitted to HydDB for classification (61). The taxonomic origin of hydrogenases (and KOs of interest) was inferred using MMseqs2 v.15-6f452 (51) “easy-taxonomy” on the containing contigs (database: GTDB 08-RS214).
Methanogenesis pathway analysis
Archaeal genomes were annotated using DRAM v.1.5.0 (47). KEGG module presence was determined using EnrichM v.0.6.1 (https://github.com/geronimp/enrichM) with custom modules describing sub-components of methanogenesis pathways (Table S7). Candidate missing enzymes were identified using BLAST (62) with characterized reference sequences from UniProt (63).
Statistical analyses and figure generation
PCA was conducted using vegan v.2.6-4 (R v.4.3.2) (64) using Hellinger-transformed data following filtering for taxa present in ≥2 samples. Contributing variables were filtered and plotted using factoextra v.1.0.7 (R v.4.3.2) (65). All other R-based analyses were conducted using R v.4.4.0. Redundancy analysis was conducted using the “rda” function within vegan v.2.6-6.1, with significance determined using “anova.cca” (64). For PCA and redundancy analysis incorporating public data sets, a maximum of 10 samples per host species were included.
Differential abundance analysis was undertaken using sPLS-DA implemented within mixOmics v.6.28.0 (66) based on centered-log ratio transformed relative abundance values (community profiles) or log_2_-transformed RPKM values (gene profiles). Community profile data were filtered for taxa present in ≥2 samples. sPLS-DA was run using 5-fold (community profiles and marsupial-only gene profiles) or 10-fold (comparison species gene profiles) cross-validation with 50 repeats, using the “tune” function to select the number of taxa to include. Training set samples for the prediction model are listed in Table S2. The “predict” function was used to provide methane group predictions for the test samples using the Mahalanobis distance option.
Boxplots and barcharts were created using ggplot2 v.3.5.1 (67). Heatmaps were created using pheatmap v.1.1.12 (68). Phylogenetic tree figures were created using iTOL (69).
RESULTS AND DISCUSSION
Marsupial species harbor diverse and distinct microbial fecal communities
The bacterial and archaeal communities of 14 Australian marsupial species from eight marsupial families were profiled through metagenomic sequencing of 33 fecal samples (Fig. 1A and Table 1; Table S1). In addition to short-read sequencing of all samples, long-read sequencing was completed on a subset of five, selected for their identified carriage of archaeal species of interest and sequenced using adaptive sampling intended to enrich for target species. The data set produced 1,394 MAGs ≥50% complete with ≤5% contamination, 1,105 of these solely from short-read data and 289 from the hybrid assembly of short- and long-read data (Table S8). These MAGs, in addition to 1,100 public genomes estimated to represent taxa in our samples, were incorporated into a dereplicated genome database of 1,584 sequences (95% average nucleotide identity) (Fig. S1). Mapping of metagenomic sequence data to this database recruited an average of ~54% of sample reads (min. 11%, max. 82%), indicating that the sequencing and assembly effort captured a large proportion of the community, though some species were underrepresented (e.g., greater glider), resulting in poor discrimination between some hosts using principal component analysis (Table S1; Fig. S2). Up to 78% of the unrecruited sample reads (range 17%–78%, average 51%) could be aligned to contigs not included in the 1,394 MAGs obtained in the present study (Fig. S3). Bacterial species lacking genome representation comprise a substantial fraction of the unclassified data in some hosts, including the greater glider, where ~60% of unclassified reads mapped to bacterial contigs (Fig. S3). Non-prokaryote DNA was estimated to account for between 22% and 54% of total sample DNA based on marker gene assessment (Table S1), suggesting enrichment of viruses and eukaryotic microbes in some samples; however, we found limited representation of this fraction within the assembled data (Fig. S3).
Marsupial host tree and marker gene-based community profiles. (A) Maximum-likelihood tree of marsupial hosts included in the data set based on alignment of two mitochondrial (CYTB, ND2) and three nuclear (IRBP, BRCA1, vWF) genes. Bootstrap support generated from 100 replicates. Sample numbers per host indicated at tips. Abbr: abbreviated host names used throughout. Site: sites sampled, (A) Cairns Tropical Zoo, (B) Currumbin Wildlife Sanctuary, (C) David Fleay Wildlife Park, (D) Hidden Vale Research Station, (E) Lone Pine Koala Sanctuary, (F) Wildlife Habitat, (G) Wongabel State Forest (wild). MAGs: number of metagenome-assembled genomes per host. Twenty-four genomes were recovered from fecal samples of two co-inhabiting species and are not included in host-level totals. Mapping (%): average percentage of sample reads mapping to the dereplicated genome database per host. (B) PCA of fecal bacterial community. (C) Bacterial and archaeal fecal community relative abundance at family level based on marker gene-based profiles. (D) PCA of fecal archaeal community. (E) Archaeal community family-level relative abundance based on marker gene-based profiles.
Due to the incomplete representation of the fecal prokaryote community in some hosts using the combined reference genome database, the marsupial microbial communities were compared using SingleM (57). These data support a diet-associated distinction of the bacterial community, with arboreal omnivores separated from terrestrial omnivores, herbivores, and more specialized feeders (Fig. 1B), driven by the genera Prevotella, Candidatus Faecousia, and Muribaculaceae CAG-873, respectively (Fig. S4). The only carnivorous species in the data set, the fat-tailed dunnarts, carry distinct communities, both in comparison to other marsupials and to each other (Fig. 1C). Similarly, koala samples were also notably distinct from other marsupials and from each other (Fig. 1C). By contrast, the archaeal community varied between individual animals, and no clear separation in association with sample metadata was seen (Fig. 1D and E), as seen in marsupial fecal fungal communities (70). The bacterial dominance in driving microbial variation was also evident when considering species incidence (Fig. S5). Redundancy analysis supported the interrelated variables of host species (R^2^: 39%) and family (37%), gut anatomy (foregut/hindgut/simple hindgut) (9%), diet (omnivore/herbivore/carnivore) (12%), and location (5%) as contributing significantly to bacterial community-based sample divergence when each was considered in isolation (location P = 0.03, others P < 0.001). No significant variables were identified for the archaeal community profiles.
Hydrogen management strategies in marsupials vary between and within species
To interpret marsupial hydrogen management capacity in the context of known methane emission phenotypes, we incorporated publicly available metagenomic data from mammals with characterized emissions and varying gut types: cattle (high-methane, foregut fermentation, n = 20), capybara (high, hindgut, n = 2), guinea pig (high, hindgut, n = 8), horse (low, hindgut, n = 29), and rabbit (low, hindgut, n = 30) (Table S2) (6, 27–32). While this comparison uses fecal communities from all hosts (rather than rumen for foregut fermenters), we note that rumen and fecal communities show interdependence (71), and the fecal community remains relevant to understanding the hydrogen balance of the entire system (26). As observed in marsupials, host family was the primary driver of fecal prokaryotic community composition across these hosts (R^2^: 55%, P = 0.001). Visible separation was also apparent between foregut and hindgut fermenting species (Fig. 2A), although contributing less to overall community variation (R^2^: 11%, P = 0.001). Among host families with available methane production estimates (i.e., macropodid and potoroid marsupials plus non-marsupial hosts), both gut type (marginal R^2^: 14%) and methane level (marginal R^2^: 7.5%) independently contributed to community structure (P = 0.001 for both).
Comparison of fecal prokaryotic communities and hydrogen-cycling functions across marsupials and comparison mammals. (A) PCA of marker gene-based fecal prokaryotic community profiles of marsupials and high- and low-methane-producing comparison species. (B) PCA of hydrogen metabolism gene RPKM abundances. Public data sets include a maximum of 10 samples per host species. Data sets included are listed in Table S2.
To profile hydrogen management strategies within these fecal microbiomes, we compared the abundance of a recognized set of hydrogen-metabolizing and reductant disposal genes (3, 18) across all samples to investigate hydrogen flow and the presence of alternative hydrogen sinks. Principal component analysis of this gene set revealed high-methane-producing species (Bovidae, Caviidae, Hydrochoeridae) clustered together despite their phylogenetic and physiological distinctions, suggesting convergent hydrogen management strategies associated with high methanogenic capacity (Fig. 2B). By contrast, low-methane producers were more dispersed, indicating that reduced methane production may be achieved through diverse metabolic pathways. Differential abundance comparison between marsupials and high-methane mammals identified increased abundances of methanogen-specific genes (mcrA) and associated hydrogenases (groups 3a, 3c, and 4h [NiFe]-hydrogenases) in the high-methane group, consistent with increased methanogenic capacity (Table S9; Fig. S6A). Marsupials, in contrast, showed increased abundance of bacterial membrane-bound group 1b [NiFe] and hydB hydrogenases, which are associated with bacterial H_2_ uptake, suggesting alternative hydrogen disposal pathways to methanogenesis. We also observed a subset of marsupial samples with intermediate profiles, suggesting heterogeneity in hydrogen management strategies among marsupials (Fig. S6A). To investigate this, we used an sPLS-DA model trained on the comparison set of mammalian hosts (non-marsupials) to classify individual marsupial samples as having “high” or “low” methane-producing potential, as well as test samples from the comparison species (Fig. S6B). This analysis identified a group of marsupials classified as “high” methane producers, including all foregut fermenter samples (excepting one bettong, BET1), plus samples from hindgut-fermenting wombats (SHN1 and 3), gliders (MHG2 and SQG2), and a bandicoot (BAN2) (Table S10). Comparison of high- and low-methane marsupial groups supported enrichment of methanogenesis-associated genes within the high-methane group (Table S11; Fig. S6C), consistent with the enrichment profile observed in high-methane-producing mammals (Table S9). Of note, our data suggest possible within-species diversity of hydrogen management, as is seen in other mammals (23, 72). The low-methane group displayed a higher abundance of oxygen-tolerant (group 1d) and sensitive (groups 1b and 1i) H_2_-uptake hydrogenases that can support anaerobic respiration (73–75), as well as genes suggesting use of alternative electron acceptors within nitrate/nitrite reduction (napA, nrfA), nitrogen fixation (nifH), and sulfite reduction (asrA) (Table S10). Enrichment of these alternative hydrogen sinks in some marsupials supports reduced availability of substrates for methanogenesis in these animals (18, 76–78). These findings mirror those comparing the rumen microbiome of low- to high-methane-emitting cattle, which identified enrichment of butyrate, glutamate, and nitrate ammonification genes in low-methane-producing cattle (18).
Marsupial methanogens are predicted to use multiple electron acceptors and carbon sources
On average, Archaea were estimated to account for <1% of the marsupial fecal prokaryotic community based on marker gene-based profiling (Table S1; Fig. 1E). The highest relative abundance (~5%) was observed in one southern hairy-nosed wombat (SHN4; Fig. 1E), dominated by Methanocorpusculum vombati at 3% of the total community (Table S12). Larger archaeal communities were also present in both mahogany gliders (dominant species Methanocorpusculum petauri) and one koala (dominant Methanosphaera species). Animals with high archaeal abundance typically had communities dominated by either Methanocorpusculum spp. or Methanobacteriaceae spp. (typically Methanobrevibacter spp.) suggestive of competition between these lineages, as previously noted (17). The most prevalent archaeal species was Methanocorpusculum petauri, present in 21% of samples, the majority of which originated from namesake Petauridae hosts (17), followed by Methanocatella sp900769095 (15%, previously Methanobrevibacter_A sp900769095 [79]), Methanocorpusculum sp001940805 (12%), and a novel species belonging to the family Methanomethylophilaceae (UBA71 sp., Candidatus Methanoprimaticola [80]). Most methanogenic archaea were identified in one or two host families, with only Methanocatella sp900769095 found in three, suggestive of host specificity, as previously observed in other animal gut microbiomes (81). Vombatidae hosts carry the highest diversity of methanogens, followed by members of the families Petauridae and Macropodidae. However, we note that the diversity of identified species per host in this study differs from previous analyses. For example, we did not identify Methanobrevibacter or Methanocorpusculum species in koala, in contrast to previous studies (16, 17). The limited sample size and observed high variability between individual animals may contribute to these differences.
To gain a better understanding of the metabolic capabilities of marsupial methanogens, we reconstructed 38 MAGs supported by targeted long-read sequencing and metabolically annotated them. This revealed genus-level specialization in substrate preference as previously described (82–85) (Fig. 3; Fig. S7). The hydrogenotrophic methanogenesis pathway was largely complete in Methanobrevibacter, Methanosphaera, and Methanocorpusculum spp., although conservation varied between genomes, particularly for Methanocorpusculum representatives (Fig. S7). The methanol-based methylotrophic methanogenesis pathway was identified in Methanosphaera spp. and Methanarcanum hacksteinii, human-derived representatives of the latter previously noted for their lack of complete methanogenesis pathways (80). The Ca. Methanoprimaticola genus MAGs also encoded complete methylotrophic methanogenesis pathways using methanol and di/tri/methylamine, although with non-canonical methyltransferases. There was evidence for ethanol-based methanogenesis in Methanobrevibacter_B boviskoreani MAGs (86), with additional alcohol and aldehyde dehydrogenases identified in most genomes. Formate use was also predicted for Methanocorpusculum and Methanobrevibacter spp. Altogether, these findings suggest that small but taxonomically and metabolically diverse populations of methanogens inhabit marsupials and use both hydrogen and one-carbon substrates to drive methane production.
Archaeal genome tree. Maximum-likelihood phylogenetic tree inferred from alignment of 53 GTDB single-copy marker genes (43). Includes genomes from the dereplicated database, plus species-representative genomes for SingleM-identified species not represented in genome database. Presence in each marsupial host family indicated by colored boxes and determined based on sample read mapping to genome database, with presence cutoffs of >0.05% relative abundance plus >10% genome coverage. Methanogenesis pathway module completeness indicated for the representative genome of each species based on KEGG database annotation.
Diverse hydrogenotrophic respiratory and acetogenic bacteria inhabit marsupials
Finally, we used the compiled genome database to profile the identities and functions of the putative hydrogenotrophic bacteria inhabiting marsupials. Thirty-three species encode membrane-bound H_2_-uptake hydrogenases (groups 1a–d, 1f, 1i [NiFe]-hydrogenases) that input electrons into the respiratory chain (Table S13). As expected, these species include Desulfobacterota (e.g., Bilophila, Desulfovibrio, group 1a) encoding the pathway for dissimilatory sulfate reduction (i.e., Apr and Dsr enzymes), with hydrogenotrophic nitrate-reducing Campylobacter_D also detected (group 1b). Also present were 11 species predicted to mediate hydrogenotrophic dissimilatory nitrate reduction to ammonium (DNRA, via Nar and Nrf enzymes [87]), including Actinomycetota species Eggerthella lenta and Raoultibacter massiliensis, and Desulfobacterota species Bilophila wadsworthia and Desulfovibrio piger. Other inferred hydrogenotrophs include Parabacteroides, Megamonas, Parasutterella, Akkermansia, and the uncultivated Planctomycetota genus RUG369. Culture-based experiments are needed to confirm the role of hydrogen uptake in each of these genera.
While acetate production has been confirmed as a primary output of macropod foregut communities (88, 89) and is considered the dominant H_2_ disposal mechanism in these animals (90), little is known about potential acetogenic populations across other marsupials. This trait appears to be widespread, with 70 species from 23 genera encoding both the acsB and cooS genes, the key determinants for acetogenesis, the acetyl-CoA synthase/carbon monoxide dehydrogenase complex (Table S13). Most marsupial hosts harbored multiple putative acetogenic genera, except for the greater glider, which was underrepresented in the genome database, and the macropods, carrying solely Ca. Faecousia species. Proposed association of acetogens with epithelial-attached biofilms in the macropodid forestomach (90) may limit their recovery via fecal sampling. All predicted acetogens affiliated with five families of Clostridia, except for the putative flagellate-associated acetogen Candidatus Adiutrix from the phylum Desulfobacterota (91). MAGs were obtained for the well-characterized acetogenic genus Blautia as well as numerous uncultivated lineages, most notably multiple MAGs of Ca. Faecousia and CAG-170 that was previously shown to become enriched in ruminants following inhibition of methanogenesis, indicating a shift toward H_2_ disposal via acetogenesis with this treatment (25). Almost all (90%) of the 70 species encode [FeFe]-hydrogenases from group A (29 species) and/or B (57 species), suggesting that they can use H_2_ to reduce CO_2_ to acetate. It is unclear how acetogens co-exist and potentially outcompete methanogens in marsupials given their higher H_2_ threshold and lower energy yield (92). One possibility is that these acetogens adopt a mixotrophic metabolism, using a combination of organic and inorganic substrates, including direct formate assimilation rather than using the hydrogen-dependent CO_2_ reductase reaction, as recently described (25). It is also possible that the spatial organization of marsupial guts provides a range of niches that enable co-existence of acetogens and methanogens.
Conclusion
This study provides the first functional characterization of hydrogen management across marsupial gut microbiomes, revealing diversity in predicted methanogenic capacity across both species and gut types. Our analysis indicates that marsupials span a functional spectrum: some harbor methanogen-rich communities with elevated methanogenesis genes, while others show enrichment of competing bacterial processes, including hydrogenotrophic respiration and reductive metabolism. This functional heterogeneity provides a mechanistic basis for understanding variation in methane production potential across marsupial lineages, providing hypotheses to be validated through activity-based measurements.
The reference list from the paper itself. Each links out to its DOI / PubMed record.
- 1Hylemon PB, Harris SC, Ridlon JM. 2018. Metabolism of hydrogen gases and bile acids in the gut microbiome. FEBS Lett 592:2070–2082. doi:10.1002/1873-3468.1306429683480 · doi ↗ · pubmed ↗
- 2Stams AJM, Plugge CM. 2009. Electron transfer in syntrophic communities of anaerobic bacteria and archaea. Nat Rev Microbiol 7:568–577. doi:10.1038/nrmicro 216619609258 · doi ↗ · pubmed ↗
- 3Greening C, Geier R, Wang C, Woods LC, Morales SE, Mc Donald MJ, Rushton-Green R, Morgan XC, Koike S, Leahy SC, Kelly WJ, Cann I, Attwood GT, Cook GM, Mackie RI. 2019. Diverse hydrogen production and consumption pathways influence methane production in ruminants. ISME J 13:2617–2632. doi:10.1038/s 41396-019-0464-231243332 PMC 6776011 · doi ↗ · pubmed ↗
- 4Mizrahi I, Wallace RJ, Moraïs S. 2021. The rumen microbiome: balancing food security and environmental impacts. Nat Rev Microbiol 19:553–566. doi:10.1038/s 41579-021-00543-633981031 · doi ↗ · pubmed ↗
- 5Mi L, Yang B, Hu X, Luo Y, Liu J, Yu Z, Wang J. 2018. Comparative analysis of the microbiota between sheep rumen and rabbit cecum provides new insight into their differential methane production. Front Microbiol 9:575. doi:10.3389/fmicb.2018.0057529662480 PMC 5890152 · doi ↗ · pubmed ↗
- 6Clauss M, Dittmann MT, Vendl C, Hagen KB, Frei S, Ortmann S, Müller DWH, Hammer S, Munn AJ, Schwarm A, Kreuzer M. 2020. Comparative methane production in mammalian herbivores. Animal 14:s 113–s 123. doi:10.1017/S 175173111900316132024568 · doi ↗ · pubmed ↗
- 7Stevens CE, Hume ID. 1995. Comparative physiology of the vertebrate digestive system. 2nd ed. Cambridge University Press, New York.
- 8von Engelhardt W, Wolter S, Lawrenz H, Hemsley JA. 1978. Production of methane in two non-ruminant herbivores. Comp Biochem Physiol A Physiol 60:309–311. doi:10.1016/0300-9629(78)90254-2 · doi ↗