The value of 3D contrast-enhanced CT radiomics in predicting response to neoadjuvant chemotherapy for adenocarcinoma of the esophagogastric junction: a two-center study
Chenglong Luo, Jing Li, Wanling Mu, Mengchen Yuan, Pengchao Zhan, Yiyang Liu, Yue Zhou, Liming Li, Changmao Ding, Xuejun Chen, Jianbo Gao

TL;DR
This study shows that 3D CT radiomics can help predict how well patients with esophagogastric junction cancer will respond to chemotherapy, potentially improving treatment decisions.
Contribution
A nomogram combining 3D contrast-enhanced CT radiomics and clinical features is developed to predict neoadjuvant chemotherapy response in AEG patients.
Findings
The combined model of radiomics and clinical features achieved an AUC of 0.894 in predicting chemotherapy response.
The nomogram showed good calibration and clinical applicability across training and validation cohorts.
The model included tumor thickness, lymph node diameter, and radiomics score as key predictors.
Abstract
To investigate the feasibility of 3D contrast-enhanced CT radiomics features to predict response to neoadjuvant chemotherapy (NAC) for adenocarcinoma of the esophagogastric junction (AEG) and to develop and validate a nomogram to assist in clinical decision-making. The clinical, pathological, and CT data of 239 patients with locally advanced AEG who underwent NAC and radical resection were retrospectively collected between March 2016 and June 2023 from two independent Chinese medical centers. They were randomly assigned to a training cohort, an internal verification cohort, or an external verification cohort. Based on the CT radiomics features after dimension reduction, the radiomics model was constructed using linear discriminant analysis as the classifier to obtain the radiomics score. Clinical characteristics were screened, and multivariable logistic regression was applied to…
Genes, proteins, chemicals, diseases, species, mutations and cell lines named across the full text — each resolved to its canonical identifier and authoritative record.
Click any figure to enlarge with its caption.
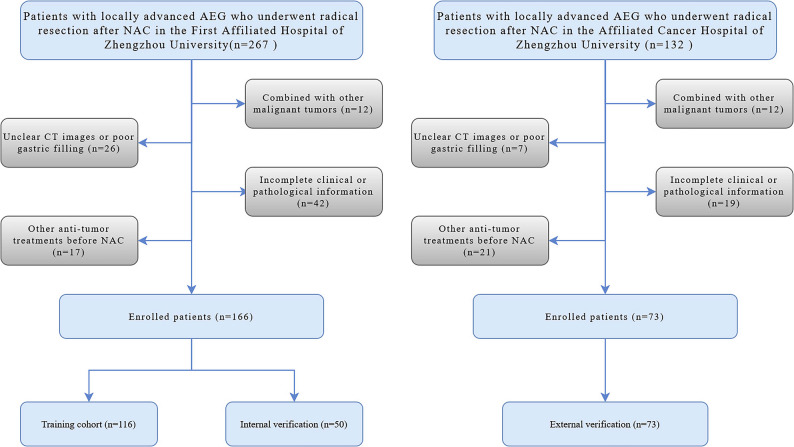 Figure 1
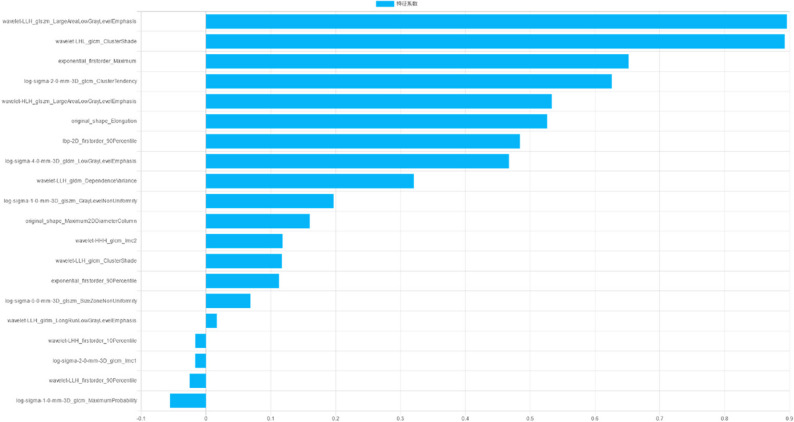 Figure 2
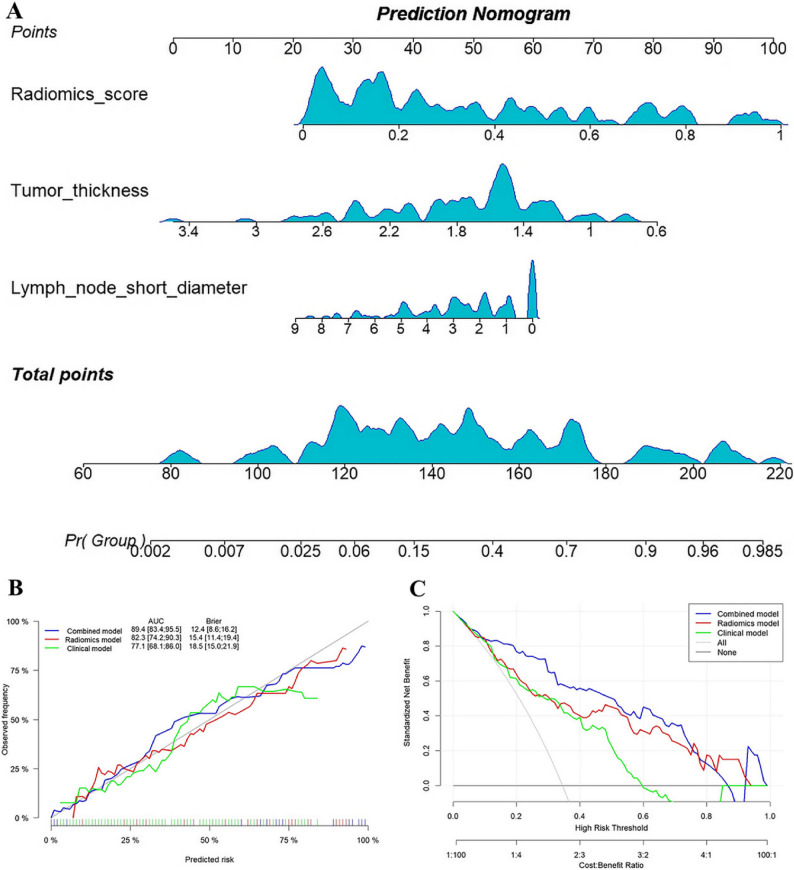 Figure 3
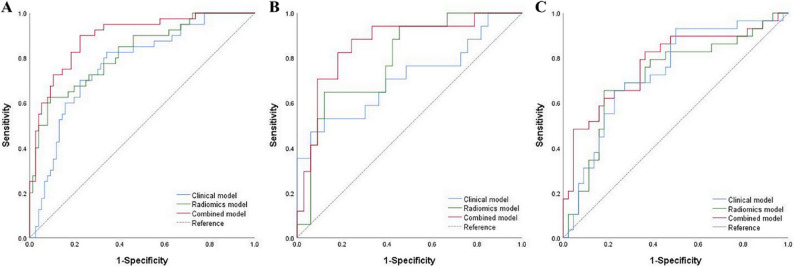 Figure 4
- —National Natural Science Foundation of China
- —Special Funding of Henan Health Science and Technology Innovation Talent Project
- —Science and Technology Development Foundation of Henan Province
- —Basic Research and Applied Basic Research Project of Zhengzhou Science and Technology Bureau
- —Henan Association for Science and Technology Youth Talent Support Program
Peer Reviews
No public reviews on file for this paper yet. If you reviewed it on a platform where reviews are public (OpenReview, ICLR, NeurIPS, ICML), you can paste yours below so the community can read it here.
Videos
No videos yet. Explain this paper in a talk, walkthrough, or lecture? Add one.
Taxonomy
TopicsEsophageal Cancer Research and Treatment · Radiomics and Machine Learning in Medical Imaging · Gastric Cancer Management and Outcomes
Background
Although the incidence of gastric cancer has progressively decreased over the past 40 years, the morbidity and mortality rates of adenocarcinoma of the esophagogastric junction (AEG) remain high [1–3]. An analysis of global gastric cancer and esophageal cancer registration data in 2018 revealed that new cardiac cancers in East Asia accounted for 67.1% of the world’s total, a significant increase compared with 2012 data [2, 4]. Notably, the overall prognosis of AEG is poorer than distal gastric cancer due to its unique biological characteristics. Siewert et al. [5] reported that in Western countries, over 80% of AEGs are progressive, with a 5-year overall survival rate below 30%. The results of previous studies have concluded that compared with surgery alone, neoadjuvant chemotherapy (NAC) for locally advanced esophagogastric junction cancer can aid in achieving local tumor control and prolonging patient survival [6–8]. Thus, the combination of NAC with surgical resection has gradually emerged as the standard treatment for locally advanced AEG [9]. However, not all AEG patients benefit from NAC due to tumor heterogeneity [10, 11]. Some patients respond poorly to NAC and experience toxic side effects, leading to delayed surgery, tumor progression, and poor prognosis [8, 12]. Therefore, there is a pressing need to predict the pathological response of AEG to NAC.
With advances in AEG comprehensive treatments and the promotion of multidisciplinary diagnosis and treatment modalities, the demand for individualized diagnosis and treatment for accurate imaging evaluation is increasing. Multi-slice spiral CT examination is currently one of the main approaches for baseline examination prior to NAC and post-treatment evaluation of AEG. However, due to the special anatomical location of AEG, the response evaluation criteria in solid tumors do not adequately meet clinical needs. Radiomics, as a non-invasive image analysis method, extracts and integrates the massive information contained in tumor images, from basic morphology to texture features to complex high-dimensional features, and subsequently constructs a decision model to assist in clinical evaluation through dimension reduction and modeling [13]. Earlier studies have identified that some radiomics features are significantly related to chemotherapy response, and models based on radiomics features show potential and advantages in baseline prediction of NAC efficacy in digestive tract cancer [14–16].
Early identification of the therapeutic response of AEG to NAC is key for limiting chemotherapy toxicity and guiding individualized treatment strategies. However, relevant radiomics studies specifically targeting AEG are scarce. Therefore, this study aimed to summarize the clinical and pathological characteristics of locally advanced AEG, integrate 3D contrast-enhanced CT radiomics features to construct a model and analyze and evaluate the predictive value of the model for NAC response.
Materials and methods
The whole study was performed by the World Medical Association guidelines and Declaration of Helsinki, revised in 2024. This retrospective study was approved by the Institutional Review Board of the the First Affiliated Hospital of Zhengzhou University, and the requirement for informed consent was waived.
Patient enrollment
The clinical information of patients with locally advanced AEG who underwent NAC and radical surgical resection in the First Affiliated Hospital of Zhengzhou University (center 1) and the Affiliated Cancer Hospital of Zhengzhou University (center 2) from March 2016 to June 2023 were retrospectively collected. The inclusion criteria were as follows: (a) Histopathologic confirmation of locally advanced AEG (clinical stage T2-4aNxM0) prior to NAC initiation. (b) Contrast-enhanced CT performed within one week prior to initiating NAC. (c) Receipt of 2–4 cycles of NAC before surgical resection. (d) Radical resection performed after NAC. The exclusion criteria were as follows: (a) Presence of other malignant tumors. (b) Unclear CT images or poor gastric filling. (c) Other anti-tumor treatments before NAC. (d) Incomplete clinical or pathological information. The patient inclusion process is illustrated in Fig. 1. A total of 166 patients with AEG from the center 1 were randomly divided into a training cohort (n = 116) and an internal verification cohort (n = 50) in a 7:3 ratio, while 73 AEG patients from the center 2 were included in the external verification cohort (n = 73).
Fig. 1. Patient flowchart for this study
Clinical and pathological data
This retrospective study analyzed clinical and pathological data from 239 patients with AEG. Collected variables included age, sex, smoking, alcohol drinking, Siewert classification, Lauren classification, tumor differentiation grade, clinical TNM stage, serum levels of carcinoembryonic antigen (CEA; normal: 0–5 ng/mL), carbohydrate antigen 199 (CA199; normal: 0.01–27 U/mL), and carbohydrate antigen 125 (CA125; normal: 0.01–35 U/mL). Additional data comprised NAC regimen, total NAC cycles, tumor morphological features (necrosis, serosal invasion, tumor thickness, longest diameter, surface area, volume, and surface area/volume), and lymph node short diameter. Clinical TNM stages were assessed according to the 8th edition of the American Joint Committee on Cancer (AJCC) criteria. Tumor morphological parameters were measured on the 3D Slicer (version 5.6.2; https://www.slicer.org/) software, wherein the tumor thickness and longest diameter were defined as the maximum values measured at the two-dimensional level, and the tumor surface area and volume were evaluated and calculated at the three-dimensional level. Lymph node stations 1–12, 19–20, and 110–111 were assessed. Lymph nodes with a short diameter ≥ 8 mm were considered measurable [17]. The lymph node short diameter was calculated as the sum of the short diameters of the five largest measurable lymph nodes, or of all measurable nodes in cases with fewer than five. All CT-based qualitative and quantitative parameters were initially assessed by a junior radiologist (W.L.M.), and then reviewed and corrected by a senior radiologist (Y.Z.). Any discrepancies were resolved through discussion to reach a final consensus, thereby ensuring the reliability of the measurements.
NAC regimens included oxaliplatin + S-1 (SOX), capecitabine + oxaliplatin (XELOX), and 5-fluorouracil + leucovorin + oxaliplatin + docetaxel (FLOT). Tumor regression was evaluated in postoperative pathological specimens according to the Becker grading system [18]. Briefly, grade 1a was defined as the absence of residual tumor cells; grade 1b was defined as < 10% residual tumor cells; grade 2 was defined as 10–50% residual tumor cells; and grade 3 was defined as > 50% residual tumor cells. According to the grading results, the response to NAC was categorized into two groups: grades 1a and 1b were classified as the good response (GR) group, whereas grades 2 and 3 were classified as the poor response (PR) group [19].
CT image acquisition
The CT image acquisition parameters are provided in Supplementary A1.
Tumor segmentation and radiomics feature extraction
Venous phase images of AEG patients with a layer thickness of 5 mm were uploaded to the Deepwise Multimodal Research Platform (version 2.5.1; https://keyan.deepwise.com, Hangzhou Deepwise & League of PHD Tecfvhnology Co., Ltd, Hangzhou, Zhejiang, China.). The specific operation details and tumor segmentation examples are shown in Supplementary A2 and Figure S1, respectively.
Radiomics feature selection
Z-normalized scaling of the extracted features was performed using the following formula: z = (x - mean)/std. Intraclass correlation coefficient analysis (ICC) was carried out, and radiomics features with ICC < 0.80 were excluded to guarantee the selection of features with high repeatability for the ensuing analyses. Next, feature correlation analysis was performed, and the threshold of the correlation coefficient was set to 0.65 to minimize the redundancy between features. Finally, the F-test was used for feature selection to retain features with significant differences between groups.
Model construction and evaluation
In the training cohort, multivariable logistic regression was performed on clinical characteristics with statistically significant differences to construct the clinical model. Based on the screened radiomics features, linear discriminant analysis (LDA) was used as the classifier to construct the radiomics model, and the radiomics score was calculated. The combined model was generated using multivariable logistic regression by incorporating key clinical characteristics and radiomics scores, which was then used to develop a nomogram. Receiver operating characteristic (ROC) curves were plotted to analyze the efficacy of each model in predicting NAC response, which was evaluated in the internal and external verification cohorts. The Hosmer-Lemeshow test was used to evaluate the goodness of fit of the model, with P > 0.05 considered a good model fit. The area under the curve (AUC) of each model was compared using the DeLong test. Calibration curves were drawn to evaluate the calibration performance of each model. Decision curve analysis (DCA) was conducted to evaluate the clinical usefulness of the models.
Statistical analysis
Statistical analysis were performed using SPSS 25.0 and Medcalc 20.015 statistical analysis software. Continuous variables that conformed to the normal distribution were expressed as mean ± standard deviation and compared using the independent sample t-test; continuous variables that were not normally distributed were expressed as the median (interquartile range) and compared using the Mann-Whitney U test. Categorical variables were compared using the χ² test or Fisher exact test. R software (version 4.4.0) was used for model construction and performance evaluation. A two-tailed p-value of < 0.05 was considered statistically significant.
Results
Clinical characteristics
A total of 239 patients with locally advanced AEG were included in this study according to inclusion and exclusion criteria, of whom 86 (36.0%) demonstrated a favorable response to NAC. The clinical characteristics of all patients are summarized in Table 1. In the training cohort, significant differences were noted in tumor thickness and lymph node short diameter between the PR and GR groups (P < 0.05), whereas the remaining clinical characteristics were comparable between the groups (P > 0.05). The results of multivariable logistic regression analysis identified tumor thickness (odds ratio [OR] 0.155, 95% confidence interval [CI] 0.052–0.460, P = 0.001) and lymph node short diameter (OR 0.754, 95% CI 0.595–0.955, p = 0.019) as independent predictors of the response to NAC for AEG patients, and the clinical model was constructed accordingly.
Table 1. Baseline characteristics of patients with adenocarcinoma of esophagogastric junctionCharacteristicTraining cohort (n = 116)Internal verification (n = 50)External verification (n = 73)GR(n = 40)PR(n = 76)p valueGR(n = 17)PR(n = 33)p valueGR(n = 29)PR(n = 44)p valueAge (years)^a^61.730±7.22262.36±8.8850.70061.590±9.16662.270±6.5730.76263.241±9.60964.364±8.6780.606Sex1.0000.0470.919 Men376910292641 Women377433Smoking0.2530.6230.669 No274312211525 Yes13335121419Alcohol drinking0.7561.0000.786 No295313252029 Yes112348915Siewert classification1.0000.8390.566 I591223 II275215271822 III81514919Lauren0.2330.1110.337 Intestinal type253513171015 Mixed type1029213717 Diffuse type512231212Differentiation0.1630.0200.737 Low21506231829 Middle-high192611101115Clinical TNM stage0.1860.0840.709 2110001 315427221623 4a243310111320CEA (Elevated)13280.642990.0737140.478CA199 (Elevated)8190.545371.0006130.399CA125 (Elevated)760.212111.000111.000NAC regimen0.4310.3760.795 SOX325412282033 FLOT3124357 XELOX5101244Total cycles of NAC0.3690.5370.963 218366171016 315208111320 47203568Necrosis0.3030.2420.120 Absent31529232633 Present924810311Serosal invasion0.4610.6160.455 Absent28488181831 Present12289151113Lymph node short diameter(cm) ^b^1.690(2.985)2.710(3.075)0.0071.760 (3.210)2.781 (2.020)0.0351.380 (2.020)2.316 (3.062)0.008Tumor thickness(cm) ^b^1.486(0.379)1.773(0.672)<0.0011.421(0.776)1.712(0.436)0.0341.365(0.275)1.679(0.467)0.004Longest diameter(cm) ^b^5.919(2.853)5.968(3.49)0.8896.261(1.431)6.117(2.179)0.8467.494(2.882)7.141(2.448)0.861Surface area(cm^2^) ^b^71.095(34.186)72.901(28.158)0.86676.754(32.970)70.009(30.611)0.69077.610(54.610)78.948(39.239)0.973Volume(cm^3^) ^b^22.958(13.701)23.628(13.783)0.63426.667(12.911)22.598(15.256)0.39520.171(14.606)24.457(12.565)0.478Surface area/volume ^b^3.193(0.861)3.025(0.921)0.3712.845(0.745)3.141(1.000)0.4303.530(0.786)3.321(0.775)0.223Radiomics score ^b^0.567(0.495)0.168(0.269)<0.0010.604(0.592)0.164(0.350)<0.0010.627(0.344)0.266(0.281)0.002^a^ Data are mean ± standard deviation, ^b^ Data are median (interquartile range)GR Good response, PR Poor response, CEA Carcinoembryonic antigen, CA125 Carbohydrate antigen 125, CA199 Carbohydrate antigen 199, NAC Neoadjuvant chemotherapy
Radiomics feature extraction and selection
A total of 1874 radiomics features were extracted from the volume of interest of each AEG patient. ICC analysis led to the exclusion of 779 poorly reproducible features (ICC < 0.80). Feature correlation analysis and F-test were performed on the remaining stable radiomics features, and 33 radiomics features were finally retained, as presented in Supplementary Table S1 and Fig. 2. Based on the selected radiomics features, LDA was used as a classifier to construct the radiomics model and calculate the radiomics score.
Fig. 2. The top twenty feature information and corresponding feature weights of radiomics model in the training cohort
Model construction and evaluation
Multivariable logistic regression was employed to construct a combined model by integrating tumor thickness, lymph node short diameter, and radiomics scores, as listed in Table S2. In the training cohort, the AUC values of the clinical model, radiomics model, and combined model for predicting NAC response were 0.771 (95% CI, 0.682–0.860), 0.823 (95% CI, 0.742–0.903) and 0.894 (95% CI, 0.834–0.954), respectively. Moreover, the DeLong test indicated that the predictive performance of the combined model was superior to that of the clinical and radiomics models (P < 0.05), whereas no significant difference was noted in the predictive performance between the clinical model and the radiomics model (P = 0.410). The nomogram, calibration curve, and decision curve were generated for the combined model, as depicted in Fig. 3. The calibration and decision curves for the combined model delineated that the model-predicted chemotherapy responses were well-calibrated with actual observations, providing a greater net benefit than the other models. Furthermore, the combined model also exhibited satisfactory predictive performance in the internal and external verification cohorts, with AUC values of 0.859 and 0.775, respectively, as detailed in Table 2; Fig. 4. The calibration curves for the three cohorts unveiled that the predicted values were in good agreement with the actual observed values, and the Hosmer-Lemeshow test showed a good fit for all models (P > 0.05). Finally, the decision curves for the two verification cohorts corroborated the clinical utility of the combined model, as shown in Figure S2.
Fig. 3. Nomogram developed based on clinical characteristics and radiomics scores and its performance in the training cohort. A Nomogram provides a scoring system for predicting response to neoadjuvant chemotherapy for AEG. B Calibration curves of radiomics model, clinical model and combined model. C Decision curve analysis for radiomics model, clinical model and combined model
Table 2. Comparative performance of clinical, radiomics, and combined models in training and verification cohortsCohortModelAUC95%CIAccuracySensitivitySpecificityTrainingClinical model0.7710.682–0.8600.7330.8250.658Radiomics model0.8230.742–0.9030.8100.6250.908Combined model0.8940.834–0.9540.8280.9000.776Internal verificationClinical model0.7090.545–0.8740.7800.4710.939Radiomics model0.7910.663–0.9200.7600.6470.879Combined model0.8590.746–0.9720.8200.8240.818External verificationClinical model0.7350.618–0.8520.6990.9310.500Radiomics model0.7170.592–0.8420.6990.6550.818Combined model0.7750.660–0.8900.7120.8280.63695%CI, 95% Confidence interval
Fig. 4. Receiver operating characteristic curves (ROC) for different models in the training, internal verification, and external verification cohorts. A The training cohort; B The internal verification cohort; C The external verification cohort
Discussion
In recent years, numerous studies have established that patients with gastroesophageal cancer can achieve superior outcomes with neoadjuvant therapy. However, a considerable number of patients do not benefit from the treatment but instead experience treatment-related side effects, with a minority of patients progressing to Stage IV during the treatment course of treatment and are no longer eligible for radical resection [20, 21]. A large clinical study from Europe comparing the efficacy of NAC versus surgery alone in patients with gastroesophageal cancer reported the positive effect of neoadjuvant therapy, with the greatest benefit observed in AEG patients [22]. Notwithstanding, due to its unique anatomical location, several studies have not distinguished AEG from esophageal cancer and gastric cancer, and studies specifically targeting AEG are relatively limited. Herein, a combined model for predicting response to neoadjuvant therapy in AEG patients was developed based on 3D contrast-enhanced CT radiomics features and clinical characteristics and subsequently validated. The results of the study identified radiomics scores, lymph node short diameter, and tumor thickness as independent factors in differentiating the PR and GR groups. As anticipated, the combined model showed excellent predictive performance across all cohorts and may potentially assist in individualized treatment decision-making for AEG patients.
At present, while histopathological examination of surgically resected specimens is the gold standard for evaluating the response to NAC for AEG patients, it is limited by a time lag that impedes early detection of changes in tumor therapy and real-time monitoring of treatment effectiveness. Tumor heterogeneity is an integral factor contributing to the failure of neoadjuvant therapy in cancer patients that can be characterized by radiomics features [23–25]. Cui et al. [26] extracted deep learning and radiomics features from the venous phase CT images of patients with locally advanced gastric cancer and established a combined model. They found that the model exhibited superior performance in predicting the response to NAC, with AUCs of 0.829, 0.804, and 0.827 for the internal and two external validation cohorts, respectively. However, radiomics studies specifically investigating the response to NAC for AEG are rare. Huang et al. [27] constructed radiomics models by extracting two-dimensional radiomics features from the maximal level of tumors of 98 patients with advanced AEG to predict pathological complete response after NAC and documented that the AUC values obtained using venous-phase data were higher than those obtained using arterial-phase data (training: 0.751 vs. 0,736; validation: 0.768 vs. 0,750). Herein, 239 patients with locally advanced AEG from two independent medical centers were divided into the GR group and the PR group. Three-dimensional radiomics features were then extracted from venous phase CT images. Noteworthily, the AUCs of the radiomics model for predicting NAC response were 0.823, 0.791, and 0.717 in the training cohort, internal verification cohort, and external verification cohort, respectively. Figure 2 illustrates the contribution of radiomic features in the model, with large area low gray level emphasis demonstrating the highest impact. This gray-level size zone matrix parameter identifies large, uniform low-attenuation regions, which are strongly indicative of extensive intratumoral necrosis and aggressive tumor behavior. Furthermore, this feature has been leveraged to predict tumor-infiltrating lymphocyte enrichment and is significantly correlated with better outcomes on immune checkpoint inhibitors in non-small cell lung cancer, highlighting its promise as a therapy response biomarker [28].
In addition, the differential diagnostic value of clinical characteristics was explored, identifying lymph node short diameter and tumor thickness as independent influencing factors for predicting the response to NAC for AEG. A previous study identified five risk factors significantly associated with response to NAC in patients with advanced gastric cancer, namely smoking history, clinical T stage, clinical N stage, tumor location, and differentiation [29]. Furthermore, a recent study demonstrated that the reduction rate in the sum of the short diameters of lymph nodes, measured before and after NAC, is significantly associated with overall survival in patients with locally advanced gastric cancer [30]. A larger baseline aggregate lymph node short diameter often signifies a more aggressive tumor phenotype. This heightened aggressiveness, which is frequently associated with molecular characteristics such as genomic instability, uncontrolled cell proliferation, and anti-apoptotic signaling, may also contribute to chemotherapy resistance [31, 32]. Consistent with prior evidence, our study found statistically significant differences in tumor thickness across all cohorts, reaffirming its value in predicting poor response to neoadjuvant therapy [33]. This may be attributed to the fact that increased thickness is often associated not only with greater tumor burden and advanced T-stage but also with features linked to treatment resistance, such as tumor hypoxia and stromal fibrosis. It is hypothesized that these features may collectively establish a barrier, potentially resulting in compromised drug delivery and suboptimal treatment outcomes.
The integration of radiomics with clinical data has been shown to enhance predictive performance, as evidenced in prior studies [34, 35]. In line with this, our combined model demonstrated superior discriminatory power in the training cohort and maintained consistent predictive accuracy across both internal and external verification cohorts. This model enables the pre-therapeutic identification of AEG patients at high risk of poor response to NAC. Patients identified as likely responders can appropriately receive standard NAC, while those predicted to be non-responders may be considered for alternative strategies such as modified chemotherapy regimens, immunotherapy integration, chemoradiation, or expedited surgical intervention, thereby reducing unnecessary treatment-related morbidity and optimizing the timing of curative resection.
This study has several limitations. First, despite being a two-center study, its retrospective nature inherently limits the strength of evidence and may introduce selection bias. Therefore, our findings require validation in larger, prospective, multi-institutional cohorts. Second, although the distribution of NAC regimens did not differ significantly between groups, our study lacked the statistical power to perform a robust, regimen-specific analysis due to the limited sample size. Therefore, their potential confounding effect cannot be ruled out. Finally, the radiomics features were derived from CT images acquired with different scanners and protocols, which may affect feature stability and model generalizability, despite our efforts at image resampling and normalization.
Conclusion
In summary, this study developed and validated a combined model integrating 3D contrast-enhanced CT radiomics features with clinical characteristics for predicting treatment response to NAC in AEG patients. The model demonstrated good predictive performance and shows potential as a decision-support tool to aid in individualized treatment planning. Prospective validation in multi-center cohorts is warranted to confirm its clinical utility.
Supplementary Information
Supplementary Material 1.