A novel biostimulant obtained from red wine lees enhances tolerance to ozone-induced abiotic stress in grapevine plants
Emilia Naranjo, Angel Orts, José M. Orts, Luis Martin-Presas, Angélica Castaño, Juan Parrado

TL;DR
A new biostimulant from red wine lees helps grapevines tolerate ozone damage by boosting their stress resistance and metabolic efficiency.
Contribution
A novel biostimulant derived from red wine lees is introduced for enhancing plant tolerance to ozone stress.
Findings
LEE improves grapevine tolerance to ozone by reducing oxidative stress and enhancing photosynthetic efficiency.
LEE activates genes for secondary metabolite synthesis and reduces stress-related gene expression.
The biostimulant optimizes metabolic efficiency and plant health under ozone stress.
Abstract
The main objective of this study was to investigate the ability of a novel plant biostimulant obtained from red wine lees by enzymatic hydrolysis (LEE) to protect against abiotic ozone damage in grapevine plants (Vitis vinifera). Tropospheric ozone at high concentrations is considered a pollutant that harms plants by entering through the leaves via the stomata. Once inside, it decomposes into reactive oxygen species (ROS), causing oxidative stress, reduced photosynthesis, growth alterations, and visible symptoms such as necrotic spots and yellowing. LEE counteracted ozone-induced damage, as evidenced by net photosynthetic rate, electron transport rate, effective quantum yield of Photosystem II, and delayed fluorescence. LEE triggered the overexpression of genes involved in the synthesis of secondary metabolites that reduce oxidative damage and enhance resilience. Additionally, it…
Genes, proteins, chemicals, diseases, species, mutations and cell lines named across the full text — each resolved to its canonical identifier and authoritative record.
Click any figure to enlarge with its caption.
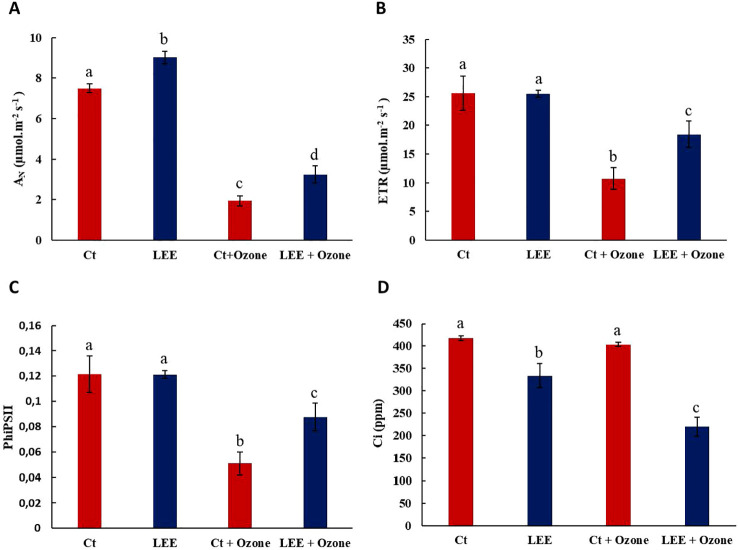 Figure 1
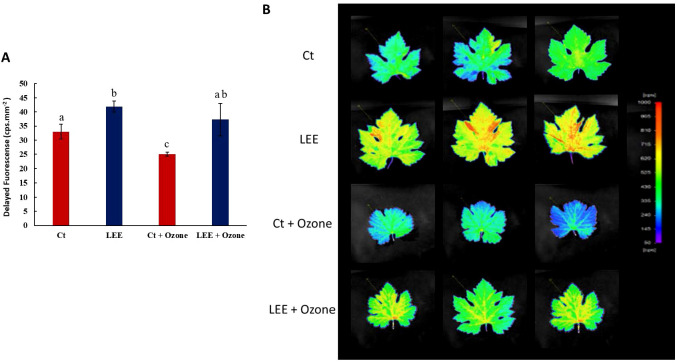 Figure 2
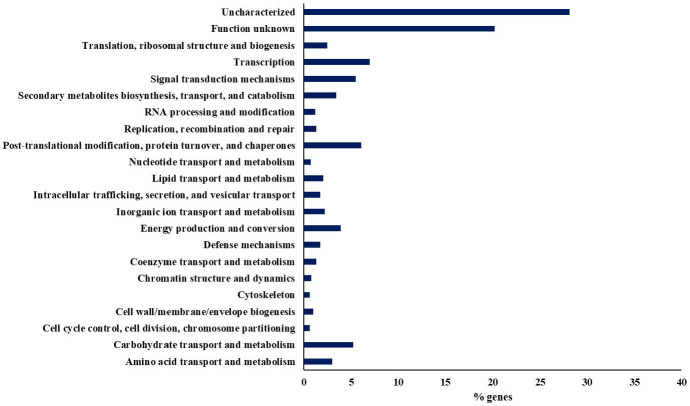 Figure 3
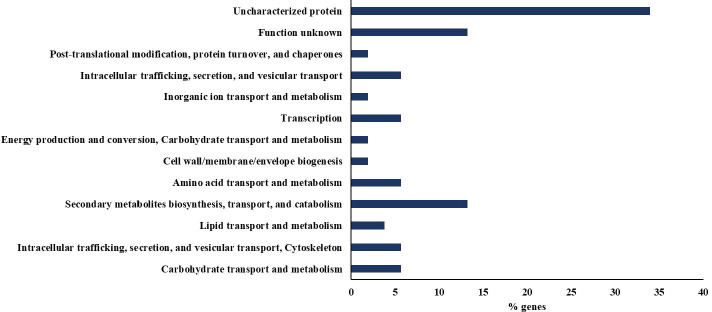 Figure 4
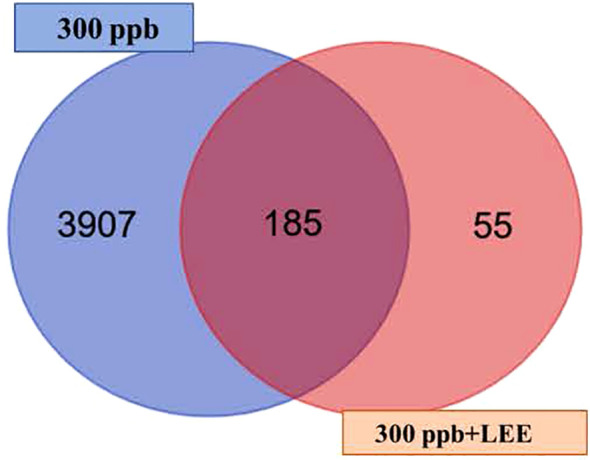 Figure 5
| % PROT (Nx5,75) | FT (mg GAE/g dry matter) | DPPH (µmoles TE/g dry matter) | ABTS (µmoles TE/g dry matter) | |||||
|---|---|---|---|---|---|---|---|---|
| Samples | MEDIA | SD | MEDIA | SD | MEDIA | SD | MEDIA | SD |
| Red lees | 32,34 | 0,98 | 37,88 | 3,49 | 244,53 | 10,01 | 362,84 | 43,60 |
| LEE | 39,73 | 1,54 | 202,87 | 48,51 | 624,11 | 59,52 | 2235,14 | 235,71 |
| Metabolites µg/100 mg | Samples | LEE |
|---|---|---|
| Aminoacids | GABA | 163,31 |
| Alanine | 246,23 | |
| Arginine | 344,97 | |
| Glutamate | 201,09 | |
| Glutamine | 261,23 | |
| Isoleucine | 211,68 | |
| Leucine | 636,96 | |
| Proline | 1489,16 | |
| Threonine | ND | |
| Valine | 219,29 | |
| Organic Acids | Acetate | 404,19 |
| Citrate | 276,54 | |
| Formate | 21,57 | |
| Fumarate | 4,29 | |
| Lactate | 1353,53 | |
| Malate | 216,39 | |
| Succinate | 501,97 | |
| Tartrate | 17361,99 | |
| Sugars | Fructose | 1610,75 |
| Glucose | 943,84 | |
| Sucrose | 440,94 | |
| Other | Glycerol | 4843,46 |
| Genes | Name protein | GO number | Fold-change |
|---|---|---|---|
| VitviT2T_024596 | 30S ribosomal protein 3, chloroplastic | ENOG5037VMA | -3,393389501 |
| VitviT2T_008642 | 30S ribosomal protein S1 | ENOG5037R7F | -2,105180735 |
| VitviT2T_021073 | 30S ribosomal protein S1, chloroplastic | ENOG5037QBM | -2,154929133 |
| VitviT2T_023929 | 30S ribosomal protein S20, chloroplastic | ENOG5037TQK | -2,295679459 |
| VitviT2T_029516 | 30S ribosomal protein S9, chloroplastic | ENOG5037K1X | -2,791590649 |
| VitviT2T_029719 | 40S ribosomal protein S23 | ENOG5037SQP | 2,02644679 |
| VitviT2T_030312 | 50S ribosomal protein L12, chloroplastic | ENOG5037U56 | -2,201922199 |
| VitviT2T_018264 | 50S ribosomal protein L13, chloroplastic | ENOG5037QQI | -2,099333721 |
| VitviT2T_017552 | 50S ribosomal protein L21, chloroplastic | ENOG5037U92 | -2,009040705 |
| VitviT2T_006164 | 50S ribosomal protein L27, chloroplastic | ENOG5037IPF | -2,451874831 |
| VitviT2T_023808 | 50S ribosomal protein L35 | ENOG5037V64 | -2,277315583 |
| VitviT2T_015683 | 50S ribosomal protein L35 | ENOG5037V64 | -2,543510053 |
| VitviT2T_009204 | Large ribosomal subunit protein bL17c | ENOG5037HJC | -2,181319209 |
| VitviT2T_014565 | Large ribosomal subunit protein bL20c | ENOG5037ZW0 | -2,820677406 |
| VitviT2T_013423 | Large ribosomal subunit protein bL28c | ENOG5037VFT | -2,907666835 |
| VitviT2T_017483 | Large ribosomal subunit protein bL9c | ENOG5037IT5 | -2,487487726 |
| VitviT2T_023302 | Large ribosomal subunit protein uL15/eL18 domain-containing protein | ENOG5037P2T | -2,150988538 |
| VitviT2T_011261 | Large ribosomal subunit protein uL15/eL18 domain-containing protein | ENOG5037TS4 | -3,997014902 |
| VitviT2T_000282 | Large ribosomal subunit protein uL29c | ENOG5037UFQ | -2,003220779 |
| VitviT2T_017909 | Large ribosomal subunit protein uL5c | ENOG5037HPD | -2,225018095 |
| VitviT2T_028465 | Large ribosomal subunit protein uL6 alpha-beta domain-containing protein | ENOG5037NEG | -2,393716036 |
| VitviT2T_029364 | Small ribosomal subunit protein bS6c | ENOG5037TV5 | -2,358369369 |
| VitviT2T_007580 | Small ribosomal subunit protein uS17c | ENOG5037UH4 | -2,350610343 |
| VitviT2T_020527 | Small ribosomal subunit protein uS19c | ENOG5037WJH | -3,416313143 |
| VitviT2T_007966 | Small ribosomal subunit protein uS7cz/uS7cy | ENOG5037JZ5 | -2,82476673 |
| Function | ID | FoldChange 300 ppb | FoldChange 300 ppb + LEE | Name protein |
|---|---|---|---|---|
| Energy production and conversion | VitviT2T_014996 | 30,1632005 | 7,133692838 | Chlorophyll a-b binding protein, chloroplastic |
| VitviT2T_016247 | 101,9236827 | 3,142235122 | Chlorophyll a-b binding protein, chloroplastic | |
| VitviT2T_007236 | 10,24617636 | -45,07296606 | Glycosyltransferase | |
| VitviT2T_001779 | 3,792418645 | -4,261955483 | Glycosyltransferase | |
| Post-translational modification, protein turnover, and chaperones | VitviT2T_012202 | 1734,27786 | -4,450647785 | glutathione S-transferase L3 |
| VitviT2T_008238 | 17,51724572 | -9,936281563 | glutathione transferase | |
| VitviT2T_012355 | 16,86216849 | -5,365817131 | glutathione transferase | |
| VitviT2T_030419 | 20,18812354 | -5,56253065 | glutathione transferase | |
| Coenzyme transport and metabolism | VitviT2T_025030 | 61,19453714 | -29,07807299 | Stilbene synthase 3 |
| VitviT2T_025014 | 140,4405506 | -12,13113083 | Stilbene synthase 5 | |
| VitviT2T_025019 | 2,63003141 | -22,87618799 | trihydroxystilbene synthase | |
| VitviT2T_025038 | 55,6265669 | -14,28655465 | trihydroxystilbene synthase | |
| VitviT2T_025033 | 126,0270103 | -14,05213102 | trihydroxystilbene synthase | |
| Transcription | VitviT2T_006696 | -2,411114 | -33,32433559 | ethylene-response factor C3 |
| VitviT2T_025589 | 32,22842737 | -6,427397331 | ethylene-responsive transcription factor ERF113 | |
| VitviT2T_015089 | 18,04645259 | -6,517067766 | transcription factor bHLH162 | |
| VitviT2T_029639 | 286,3906312 | -5,649754386 | Transcription factor MYB102 | |
| VitviT2T_004493 | 13,59187959 | -3,383466533 | transcription factor MYB123 | |
| VitviT2T_025872 | 21,86392555 | -5,663569672 | transcription factor MYB62 | |
| VitviT2T_004497 | 5,420384393 | -20,63127176 | Transcription factor WER | |
| VitviT2T_009629 | 3,1177692 | -2,781755389 | WRKY transcription factor | |
| Carbohydrate transport and metabolism | VitviT2T_029896 | 42,35488504 | -17,49049236 | glucan endo-1,3-beta-D-glucosidase |
| VitviT2T_008906 | 47,30300039 | -3,81969279 | glucan endo-1,3-beta-glucosidase-like | |
| Amino acid transport and metabolism | VitviT2T_026076 | 46,2481922 | -3,189784151 | protein NRT1/PTR FAMILY 2.11 |
| VitviT2T_000875 | 6,031526889 | -2,834455899 | Protein NRT1/PTR family 4.6 | |
| VitviT2T_023196 | 2,908580453 | -6,53022495 | Protein NRT1/PTR family 7.3 |
- —Ministerio de Ciencia e Innovación10.13039/501100004837
Peer Reviews
No public reviews on file for this paper yet. If you reviewed it on a platform where reviews are public (OpenReview, ICLR, NeurIPS, ICML), you can paste yours below so the community can read it here.
Videos
No videos yet. Explain this paper in a talk, walkthrough, or lecture? Add one.
Taxonomy
TopicsPlant responses to elevated CO2 · Plant Growth Enhancement Techniques · Plant Stress Responses and Tolerance
Introduction
1
Ozone, an allotrope of oxygen, forms in the troposphere through complex chemical reactions between nitrogen oxides and volatile organic compounds, triggered by sunlight. This process is particularly pronounced in urban and industrial areas, where increasing human activity leads to a steady rise in tropospheric ozone levels (Wilkinson et al., 2012). Recognized as a major air pollutant, tropospheric ozone has detrimental effects on plant growth and productivity (Betzelberger et al., 2012; Wilkinson et al., 2012). The extent of ozone impact on plants depends on its concentration and the duration of exposure. Long-term exposure to low ozone levels reduces photosynthesis, stunts growth, and accelerates aging, often without visible damage to plant tissues. In contrast, short-term exposure to high ozone concentrations—an event that can occur multiple times during the growing season in various regions—triggers cell death and the formation of visible lesions in ozone-sensitive plants (Agathokleous et al., 2023; Nowroz et al., 2023). The grapevine (Vitis vinifera, L.) are sensitive to ozone, and elevated ozone levels can impair their photosynthetic performance, growth, yield, and fruit quality (Fumagalli et al., 2019).
The introduction of new legislation on recycling and the sustainable use of underutilized local resources in many countries has highlighted the importance of the circular bioeconomy for the manufacturing of high-value products (Spekreijse et al., 2019). Wine is one of the most widely produced alcoholic beverages globally, with an approximate production of 259.9 million hL in 2022. Typical wastes and by-products from wineries include grape pomace (composed of skins and seeds, which represent about 60% of total winemaking by-products, and stems, which account for approximately 14%), as well as grape solids and fermentation (yeast) lees (26%). Each year, an estimated seven million tons of grape pomace and lees are generated worldwide (Bordiga et al., 2019).
In recent years, there is a growing interest in reusing these food wastes not only to reduce their environmental impact by the circular production of by-products but also to entail an economic benefit derived from the reuse of products with added value (Baroi et al., 2022; Dwyer et al., 2014). Given a circular economy approach, some of these wastes can be successfully “recycled”, reused, or recovered, improving both the economic and environmental. These by-products are typically used for animal feeding, composting, industrial biomass, or distillate production (Bordiga et al., 2015). However, grape pomace and lees are high added-value by-products due to its wide variety of compounds. The wine lees are a combination of yeasts, organic acids, insoluble carbohydrates, inorganic salts, lignin, proteins, phenolic compounds, and ethanol (Jara-Palacios, 2019). These compounds are susceptible of extraction or transformation and exploitation with the consequent economic benefit.
Biostimulants are currently regarded as key tools in sustainable agriculture because they enhance specific plant functions that ultimately support crop performance under suboptimal conditions. In functional terms, plant biostimulants are products applied in small amounts that modulate plant physiological and biochemical processes, thereby improving nutrient use efficiency, activating or priming defense pathways, and increasing tolerance to abiotic stresses while contributing to yield and quality improvements (Russo and Berlyn, 1991; Yakhin et al., 2017). Historically, before the term “biostimulant” became widespread, expressions such as “biogenic stimulators” or “biogenic stimulants” were used for compounds produced in plant tissues under non-lethal stress that stimulated vital physiological reactions (Yakhin et al., 2017). The early concept of “organic plant biostimulants” proposed by Russo and Berlyn already emphasized their non-nutritional nature and their ability to enhance productivity and stress resistance in low-input systems (Russo and Berlyn, 1991). In line with recent literature and the current EU Fertilising Products Regulation (European Union, 2019), as well as related regulatory frameworks in other regions, biostimulants are now primarily defined from their agronomical function rather than their composition, focusing on their capacity to improve nutrient use efficiency and to prime plant defense and stress-response pathways, which in turn supports higher resilience and better crop performance.
In our group, we have previously developed microbiological and enzymatic technologies that allows obtaining biostimulants from agro-industrial residues, both of plant origin such as okara (García-Martínez et al., 2010; Orts et al., 2019, 2024) or rice bran (Macias-Benitez et al., 2021), and of animal origin such as chicken feathers (Caballero et al., 2020; Rodríguez-Morgado et al., 2014) or even from sewage sludge (Caballero et al., 2022; Rodríguez-Morgado et al., 2015; Tejada et al., 2013).
Considering the relevance of the wine industry in Mediterranean countries such as Spain, Greece, and Italy, regions with high tropospheric ozone levels, there is an emerging interest in developing protection strategies against ozono-induced oxidative damage (Doche et al., 2014; Wang et al., 2024). Such strategies are particularly valuable when they avoid environmental toxicity, as is the case with plant-derived extracts. In this context, the enzymatic technology developed by our group offers a dual advantage: it converts viticulture wastes into biostimulants aligned with circular economy principles, while simultaneously providing a sustainable tool to enhance plant resilience against ozone stress. This study specifically evaluates the protective role of these biostimulants in mitigating ozone-induced oxidative damage, bridging waste valorization with agroecological protection strategies.
Materials and methods
2
Lees enzymatic extract preparation
2.1
Agro-industrial waste from the wine industry wastes was obtained from the winery “Cooperativa Nuestra Señora del Socorro” (Rociana del Condado, Huelva). The lees (diluted 15% in water) were processed by enzymatic hydrolysis using subtilisin (0.3% v/v) (EC 3.4.21.62), a protease from Bacillus licheniformis (Biocom Española S.A; protease activity 650±5% UB/g, 1.110-1.120 g/ml, as stated in the technical datasheet), as hydrolytic agents in a bioreactor with controlled temperature (55°C) and pH (pH 9), using the pH-stat method (Parrado et al., 2006).
In addition, enzymatic biostimulant production was monitored by studying the performance of the process as a function of the evolution of the extraction of soluble hydrolyzed biomolecules as peptides, carbohydrates and polyphenols.
Chemical characterization of lees enzymatic extract
2.2
The chemical characterization of the products obtained has been carried out. Previously, these products were freeze-dried using the Telstar Cryodos -80°C equipment (Spain).
Analysis of free amino acids using the high-resolution chromatographic system UPLC ACQUITY I-CLASS
2.2.1
The lyophilized samples were extracted following the protocol described in Kıvrak (2015). Briefly, 100 mg were weighed into a 2 mL Eppendorf tube, and 1 mL of MeOH/H_2_O (80:20) (v/v) with 0.1% HCOOH was added. The mixture was sonicated for 5 minutes, vortexed afterwards, and then immediately centrifuged at 4°C at 4,000 rpm for 15 minutes. The supernatant was filtered through a 0.22 µm pore-size PVDF membrane filter. Subsequently, it was injected into the UPLC system equipped with a binary pump and an autosampler for up to 96 vials with cooling. The chromatographic conditions tested were based on previous experiences of the Metabolomics Service of CEBAS-CSIC (Murcia) for this type of analysis.
Analysis of the organic extracts using the high-resolution chromatographic system UPLC coupled to mass spectrometry
2.2.2
The organic extracts were extracted following the protocol described by Maren Müller and Sergi Munné-Bosch (Müller and Munné-Bosch, 2011), and were then injected into the UPLC system equipped with a binary pump and an autosampler for up to 96 wells with cooling. The chromatographic conditions used were based on this protocol This assay was carried out at the Metabolomics Service of CEBAS-CSIC (Murcia).
Extraction of primary (polar/semipolar) metabolites using ¹H-NMR spectroscopy
2.2.3
This assay was carried out at the Metabolomics Service of CEBAS-CSIC (Murcia) following the method previously described (Choi et al., 2004, 2006).
Antioxidant capacity
2.2.4
The evaluation of the antioxidant capacity of the lees enzymatic extract was evaluated using the PPPH (Brand-Williams et al., 1995; Xiao et al., 2020), ABTS assays (Kotha et al., 2022; Re et al., 1999). The phenolics content was determined using the Folin-Ciocalteu methods by reacting the extracts with the homonymous reagent (Simões et al., 2024; Singleton et al., 1974).
Plants treatment
2.3
The selected plants and the treatment applied were carried out according to previous work by the group (Macias-Benitez et al., 2021). Vitis vinifera cv. Syrah plants were cultivated from seedlings purchased from the Barber nursery (L’Olleria, Valencia, Spain) in plastic pots containing an organic commercial substrate (Gramofor GmbH und Co. KG.) and Osmocote^®^ (NPK 15: 9: 12), and grown inside the University of Seville Glasshouse General Services on a phytoclimatic chamber, Fitoclima 18,000 PHL (AralabSpain), with a controlled temperature of 18−22°C, 50% relative humidity, adequate irrigation with tap water and a photoperiod of 16 h light/8 h darkness, with a maximum photosynthetic photon flux density incident on the leaves of 1200 μmol m^−2^ s^−1^.
After eight days of transplantation, 20 plants were selected and divided in 4 groups (5 plants for group): control plants (group Ct), control plants under ozone (group O_3_) exposition (group Ct+ O_3_), plants treated with LEE (group LEE) and plants treated with LEE under O_3_ exposition (LEE+ O_3_). Following protocol previously describe by us (Macias-Benitez et al., 2021), to evaluate the protection capacity of the treatment with LEE, plants were foliar sprayed a total of 4 times at five-day intervals, with an aqueous solution of LEE at 0.1% (groups LEE and LEE+ O_3_) or distilled water (groups Ct and Ct+ O_3_). After 5 days of the last spray treatment, Ct+ O_3_ and LEE+ O_3_ plants were transferred to another phytoclimatic chamber with an ozone generator (ZONOSISTEM GM 5000 O_3_ Generator) attached and exposed to 3 consecutive fumigations with 300 ppb of O_3_ for 6 h (from 10:00 am to 4:00 pm). After ozone fumigation all the test plants were sprayed again with the corresponding solution (LEE 0.1% or distilled water). An acute ozone exposure of 300ppb was selected to induce a clear and reproducible oxidative stress and visible leaf damage in a short time, to evaluate the protective effect of the enzymatic extract. This concentration is higher than typical environmental ozone levels and is used here as a controlled stress test rather than a simulation of chronic air pollution.
Finally, 24 h after the last exposure to ozone, foliar samples were taken from each plant and the analyses described below were carried out.
Plants status after the ozone exposition
2.4
Analyses of photosynthetic parameters
2.4.1
Twenty-four hours after the last ozone treatment, net photosynthetic rate (A_N_), electron transport rate (ETR), effective quantum yield of PSII (PhiPS2) and intercellular CO_2_ concentration (Ci) were determined in plants using an IRGA (LI-6400XT, LI-COR Inc., Nev., EEUU) with a light chamber for the leaf (Li-6400-02B, Li-Cor Inc.) according to Macias-Benitez et al. (2021). Briefly, measurements (n = 20) were performed between 10 a.m. and 2 p.m. hours under a photosynthetic photon flux density of 1500 \upmu mol.m^−2^. s^−1^, a deficit of vapor pressure of 2–3 kPa, a temperature of approximately 25°C, and an ambient CO_2_ concentration of 400 \upmu mol.mol^−1^ air. Each measurement was recorded after gas exchange had stabilized (120 s).
Delayed fluorescence determination
2.4.2
Delayed fluorescence (DF) was recorded at the end of the experiment in a random leaf from each plant. For that, the collected leaves were analyzed using a NightShade LB 985 (Berthold Technologies, Germany) equipped with a deeply cooled CCD camera (López-Jurado et al., 2020). The recorded data were converted to counts per second (cps) and normalized to the leaf area.
Statistical analysis
2.4.3
To assess the physiological state of the plants, the statistical analysis was carried out with SigmaPlot software (version 12.0, Systat Software Inc., San José, CA, USA). Normality and homogeneity of variances were tested, and results were compared using ANOVA followed by Tukey’s test (p<0.05) to determine significant differences among treatments.
Analyze gene expression in plants: RNAseq
2.5
Sample collection
2.5.1
The sample collection was carried out following the protocol provided by the company Corning.
Extraction, purification of samples and library preparation
2.5.2
The extraction and purification of the input RNA was performed by GENEWIZ Multiomics & Synthesis Solutions from Azenta Life Sciences.
Mapping sequence reads to the reference genome
2.5.3
Sequence reads were trimmed to remove possible adapter sequences and nucleotides with poor quality using Trimmomatic v.0.36. The trimmed reads were mapped to the Vitis_vinifera_GCA_030704535.1 reference genome available on ENSEMBL using the STAR aligner v.2.5.2b. The STAR aligner is a splice aligner that detects splice junctions and incorporates them to help align the entire read sequences. BAM files were generated as a result of this step. The raw sequencing data (fastq files) have been deposited in the NCBI Sequence Read Archive and can be accessed under BioProject accession PRJNA1377885.
Extracting gene hit counts
2.5.4
Unique gene hit counts were calculated by using feature Counts from the Subread package v.1.5.2. The hit counts were summarized and reported using the gene_id feature in the annotation file. Only unique reads that fell within exon regions were counted.
Differential gene expression analysis
2.5.5
After extraction of gene hit counts, the gene hit counts table was used for downstream differential expression analysis. Using DESeq2, a comparison of gene expression between the customer-defined groups of samples was performed. The Wald test was used to generate p-values and log2 fold changes. Genes with an adjusted p-value < 0.05 and absolute log2 fold change > 1 were called as differentially expressed genes for each comparison.
Bioinformatics tools for functional analysis
2.5.6
To verify the annotation, and thus the function of the overexpressed genes and proteins, the gene ontology provided by UniprotKB, annotations from NCBI, PATRIC, and Ecogene were consulted, as well as the gene ontology assigned by the JCVI Microbial Resource Center. Additionally, these genes and proteins were sorted according to the orthologous classification provided by KEGG (Kanehisa et al., 2008), incorporating into this classification those genes and proteins reviewed by the various annotations and ontologies mentioned earlier. As the first functional analysis, the different functional categories described in the clusters of orthologous groups (COG) associated with each overexpressed gene or protein were consulted.
Results
3
Extraction and characterization process of the LEE
3.1
The composition of the lees makes it an interesting product to be used as a biostimulant. To fully exploit its properties, it is necessary to modified the insoluble fraction and make it more available. To achieve this goal, enzymatic hydrolysis has been proposed using the enzyme subtilisin. This protease extracts, solubilizes, and hydrolyzes the initial proteins into soluble peptides, and also leads to the solubilization of hydrophobic compounds such as lipids and bioactive metabolites. The enzymatic hydrolysate showed an approximate increase of 13% in the soluble fraction compared to the control without enzymes, reaching up to a 38% total solubilization. The biostimulant´s characterization is shown in Table 1.
As shown in the Table 1, the hydrolyzed product (LEE) showed approximately 19% more protein than the raw material, and about 6 times more total phenols compared to the red lees, which is very important data since phenols are fundamental in plant growth processes and help responses to environmental stress.
Regarding antioxidant capacity, this was measured using two different methods, DPPH and ABTS, with the observation that the antioxidant power is greater in the hydrolyzed product than in the raw material, being 6 times higher in ABTS and 2.5 times higher in DPPH (Table 1).
Next, the metabolites contained in the biostimulant were analyzed using high-resolution UPLC chromatography and ¹H-NMR spectroscopy. As shown in Table 2, the hydrolysate of red lees (LEE) provided the essential amino acids that plants cannot synthesize and therefore must obtain from external sources (Sun et al., 2024), such as threonine, valine, isoleucine, and leucine. Proline stood out as the most abundant amino acid, an important fact because, along with glycine-betaine, it is considered an osmoprotective amino acid against various stresses (Hosseinifard et al., 2022).
The most representative organic acids were tartrate and lactate. These results are completely expected, as the hydrolysate of red wine lees comes from a complete winemaking process (including malolactic fermentation), which can provide beneficial properties to the biostimulant. Regarding sugars, both fructose and glucose are the reducing sugars naturally present in grapes and must; therefore, it is normal for their levels to be much higher than that of sucrose, which is not the primary sugar in grapes.
Physiological status in plants
3.2
The physiological state of the plants was determined through the parameters A_N_, ETR, PhiPSII and Ci. Ozone exposure (300 ppb) significantly affected these parameters (Figures 1A-D), reducing them by 74%, 58%, and 57%, respectively, compared to the control, except for the parameter Ci, which showed no effect. Although the 300 ppb ozone treatment used in this study corresponds to relatively high ambient ozone concentrations, it was chosen as an acute stress test to clearly demonstrate the protective capacity of the enzymatic extract.
Physiological parameters. (A) AN; (B) ETR; (C) PhiPSII and (D) Ci in response to O3 (0 and 300 ppb) under a treatment without and with LEE. Values represent mean ± standard deviation (SD, n = 5). Different letters indicate means that are significantly different from each other (one-way ANOVA, Ozone treatment; HSD test, P<0.05). AN, Net CO2 assimilation rate; ETR, Electron Transport Rate; PhiPSII, Effective quantum yield of Photosystem II and Ci, Intercellular CO2 concentration; Ct, control plants; LEE, Plants treated with biostimulant; Ct+Ozone, plants with ozone and LEE +Ozone, plants treated with ozone and biostimulant.
The treatment with the biostimulant LEE did not change the physiological parameters ETR and PhiPSII compared to the control plants, however, it increased the photosynthetic rate by 20% and reduced the Ci parameter by 19%. Protection against the O_3_-induced decrease was observed in the photosynthetic rate, electron transport rate and effective quantum yield of photosystem II (40% in A_N_; 42% in ETR; 41% in PhiPSII) (Figures 1A–C). Conversely, the intercellular CO_2_ concentration decreased by 45% with the application of LEE compared to the ozone-treated control (Figure 1D).
Next, the delayed fluorescence parameter was studied. This phenomenon is an indicator of the plant’s health since the intensity of delayed fluorescence is an indicator of chlorophyll content and the physiological state of the plant. It also allows for the evaluation of plant responses to stress factors such as drought, salinity, infections, thermal shock, and heavy metal contamination (Goltsev et al., 2009). As could be observed in Figure 2, (graph Figures 2A, 2B), application of LEE increased the delayed fluorescence values by approximately 27% compared to the control. Exposure to ozone significantly decreased fluorescence values (25% compared to the control), and this decrease was completely prevented by LEE.
Delayed fluorescence in leaves of Vitis vinifera plants in response to ozone (O3) (0 and 300 ppb) under a treatment without and with LEE). (A) Counts per second (cps) values for each treatment. Values represent mean ± standard deviation (SD, n = 5). Different letters indicate means that are significantly different from each other (one-way ANOVA, Ozone treatment; HSD test, P<0.05). Ct: control plants; LEE: Plants treated with biostimulant; Ct+Ozone: plants with ozone and LEE +Ozone: plants treated with ozone and biostimulant. (B) photographs taken by the plant imaging system NightShade LB 985. Delayed fluorescence was used as a direct indicator of the chlorophyll content. The color scale reflects the detected counts per second (cps) of delayed fluorescence emission in leaves. Red color indicates high intensities representing high chlorophyll content, blue color indicated low intensities of fluorescence, indicating low amounts of chlorophyll. Ct, control plants; LEE, Plants treated with biostimulant; Ct+Ozone, plants with ozone and LEE +Ozone, plants treated with ozone and biostimulant.
These results suggest that LEE improves photosynthetic activity and the overall physiological state of the plant, and also protects against ozone-induced photosynthetic damage as it maintains the physiological state induced by this stress.
Transcriptional analysis of Vitis vinifera genes in the presence of ozone and LEE
3.3
Effect of ozone (300 ppb) on Vitis vinifera plants
3.3.1
Exposure to high concentrations of ozone causes visible lesions, including spots, chlorosis, and necrosis, among others (Feng et al., 2015; Tiwari and Agrawal, 2018). However, it also induces other less apparent injuries, such as the degradation of palisade mesophyll cells, the accumulation of starch and lipids in leaf tissues, the deposition of callose and phenolic compounds in cell walls, and vacuoles filled with polyphenols and tannins (Agathokleous et al., 2015). From a physiological perspective, O_3_ exposure leads to a decrease in stomatal conductance, photosynthesis, and photochemical efficiency, along with an increase in induced dark respiration (Betzelberger et al., 2010; Biswas et al., 2008; Fiscus et al., 2005). These alterations result in gene deregulation, either upregulation or downregulation, remodeling of protein expression patterns, stimulation of defense pathways, and disruption of metabolic processes (Singh et al., 2023). The results of the statistical analysis are provided in the Supplementary Material (Supplementary Figures S1-S5).
Ozone exposure caused 4,092 differentially expressed genes, of which 1,950 were downregulated and 2,142 were upregulated. First, an initial analysis of the differentially expressed genes was performed using the COG (“Cluster of Orthologous Groups”) classification (Tatusov et al., 2003) (Figure 3). The most representative functional categories were the transcription, post-translational modification, protein turnover, and chaperones, signal transduction mechanisms, carbohydrate metabolism and transport, and the catabolism, transport, and biosynthesis of secondary metabolites.
Distribution of the percentage of differentially expressed genes after exposure to 300 ppb of ozone classified into functional categories assigned by COG.
At the transcriptional level, transcription factors related to phytohormones, which are key in plant growth and development, are differentially expressed. These include AP2-like ethylene-responsive transcription factors, auxin response factors, and ethylene-responsive transcription factors. Additionally, various factors related to responses to abiotic stress were identified, such as BHLH domain-containing proteins (Basic Helix-Loop-Helix), and MYB, WRKY, and NAC transcription factors.
Regarding post-translational modification, protein turnover, and chaperones, a group of proteins known as chloroplastic protein DnaJ (VitviT2T_009334, VitviT2T_008751, VitviT2T_019324, VitviT2T_019456) stood out. These function as molecular chaperones, either alone or in association with heat shock proteins 70 (Hsp70), and participate in essential cellular processes such as protein folding, degradation, and refolding (Hennessy et al., 2005; Zhao et al., 2022). Additionally, they play a crucial role in maintaining photosystem II under cold stress (Kong et al., 2014). Our data have also revealed the overexpression of the enzyme Glutathione S-transferases, enzymes differentially expressed in response to abiotic stress signals (Csiszár et al., 2014; Hernández Estévez and Rodríguez Hernández, 2020).
In grapevine plants exposed to ozone, serine/threonine protein kinases were observed to be overexpressed as part of signal transduction systems. These proteins transmit extracellular signals to cellular responses by phosphorylating target proteins on serine or threonine residues.
Ozone has induced the overexpression of genes involved in the synthesis of biotin and phenolic compounds known as stilbenes, including resveratrol, in plants. These genes are the biotin synthase (VitviT2T_021744), an enzyme that catalyzes the addition of a sulfur atom to dethiobiotin, forming biotin. In addition, genes related to stilbene synthesis have also been found, with several key enzymes standing out, such as stilbene synthases (VitviT2T_025038, VitviT2T_025014, VitviT2T_006858) and trihydroxystilbene synthases (VitviT2T_009682, VitviT2T_011709, VitviT2T_025021, VitviT2T_025030, and VitviT2T_025033).
The high ozone concentration also led to the inhibition of 50S and 30S ribosomal proteins present in chloroplasts and mitochondria (Table 3). These proteins are essential for multiple physiological processes in plants, as their reduction limits the synthesis of essential proteins, thereby affecting photosynthesis, hormonal signaling, and oxidative damage repair. Structural and enzymatic proteins may also be impacted, affecting the growth rate of leaves, stems, and roots. Furthermore, the production of key components for photosystems and the electron transport chain may be disrupted. Finally, a decrease in the synthesis of protective and repair proteins makes plants more susceptible to stress.
Effect of LEE on Vitis vinífera plants
3.3.2
The application of the hydrolysate from red wine lees caused 64 genes to be differentially expressed, of which 41 were repressed and 23 were overexpressed compared to the control plants. The statistical analysis supporting these results is provided in the Supplementary Material (Supplementary Figures S6-S10). As observed in Figure 4, around 34% of the genes were annotated as Uncharacterized protein and 13% as Function unknown. The most representative category by the number of genes was Secondary metabolites biosynthesis, transport, and catabolism with 13%, being overexpressed certain proteins important for plant metabolism, for example, the Fe2OG dioxygenase domain-containing proteins (VitviT2T_027113 and VitviT2T_027883), which are involved in the biosynthesis of flavonoids, and the Phenylalanine ammonia-lyase (VitviT2T_007942), Key enzyme in the phenylpropanoid pathway. These results suggest that the overexpression of these genes induced by the biostimulant may improve the plant’s ability to defend itself, adapt, and produce valuable compounds, although it could also imply a metabolic cost that might affect growth, for example.
Distribution of the percentage of differentially expressed genes after exposure to LEE classified into functional categories assigned by COG.
It’s worth noting that the application of the biostimulant has led to the overexpression of the glutathione transferase (VitviT2T_005150), A key enzyme in the metabolism of Vitis vinifera, as it plays a crucial role in detoxification functions, maintaining redox balance, and responding to abiotic and biotic stress, by catalyzing the conjugation of glutathione with a wide variety of toxic compounds, facilitating their neutralization and elimination (Nianiou-Obeidat et al., 2017).
Effect of LEE on plants stressed with 300 ppb of ozone
3.3.3
Next, the effect of the biostimulant on plants stressed by 300 ppb of ozone was studied. For this purpose, the 4,092 differentially expressed genes produced in the presence of 300 ppb of ozone were compared with the 240 differentially expressed genes in ozone-affected plants to which the biostimulant was applied. The statistical analyses associated with these comparisons are provided in the Supplementary Material (Supplementary Figures S11-S15).
As observed in the Venn diagram (Figure 5), the control plants (300 ppb) and the plants treated with ozone plus LEE shared 185 common genes and 55 genes that are only expressed in the presence of LEE.
Venn diagram showing the differentially expressed genes in plants exposed to 300 ppb of ozone (purple) and the differentially expressed genes in plants exposed to ozone and LEE (orange).
A more detailed study of these 185 genes has shown that, in the presence of ozone, a set of proteins related to the plant’s protection against ozone-induced stress were overexpressed. When the biostimulant was applied, the FoldChange of these genes changed drastically, being less overexpressed (an example is chlorophyll a-b binding proteins) or even leading to gene repression (stilbene synthases) (Table 4).
A set of proteins stood out as being overexpressed when LEE was present compared to the control, where they were repressed (VitviT2T_024155, VitviT2T_018696, VitviT2T_013309). These genes are probable leucine-rich repeat receptor-like protein kinase At1g35710, which play fundamental roles in signal perception and transduction.
It is noteworthy that, of the 55 differentially expressed genes in plants treated with LEE, 5 were found to be repressed while the rest were overexpressed. It was observed that the signal transduction mechanisms in these plants are overstimulated, as several LRR receptor-like serine/threonine-protein kinases were found to be overexpressed. These kinases are essential for regulating growth, adapting to the environment, and defending these plants. Therefore, this could have potential applications in improving grapevine crops to make them more resistant and productive.
Discussion
4
The grapevine plays a fundamental role in the cultural, economic, and ecological aspects of the Mediterranean environment (Moura et al., 2023). Globally, this crop holds great economic importance (Blanco-Ward et al., 2021), and wine production is a key activity that is an integral part of the cultural identity of many countries (Ascenso et al., 2021).
The ability of tropospheric ozone to damage vegetation is widely studied, manifesting in reduced photosynthesis, accelerated cellular aging, increased susceptibility to diseases, decreased growth, and reduced reproductive capacity in plants. In the specific case of Vitis vinifera, it has been observed that it exhibits intermediate sensitivity to ozone (Ascenso et al., 2021).
The present study demonstrates the protective effect of a biostimulant (LEE) derived from red wine lees against ozone-induced damage in grapevine plants. The analysis of LEE composition reveals that it is a potential source of active molecules such as proteins and phenols (Table 1). The use of proteases enables the release of peptides from proteins, converting them into their active form (Justus et al., 2019). The resulting protein hydrolysates exhibit various biological functions, with antioxidant activity being one of the first recognized (Zhu et al., 2022).
Due to these properties, are considered an innovative alternative for stimulating plant growth. Their foliar application can help plants cope with abiotic stress by enhancing their antioxidant capacity (Sitohy et al., 2020). LEE also provides essential amino acids (threonine, valine, isoleucine, and leucine) that plants cannot synthesize and must obtain from the biostimulant (Sun et al., 2024).
The high content of phenolic compounds in the biostimulant further highlights its potential as an effective tool for enhancing plant health, as these compounds play a key role in plant development and defense mechanisms. Their multifaceted action significantly contributes to plant resilience and adaptation to adverse environmental conditions. Moreover, phenolic compounds are involved in the regulation of various signaling pathways associated with stress responses, underscoring their essential function in coordinating plant defense systems (Saini et al., 2024). Additionally, they have other applications in bioremediation and as antioxidants in food additives (Sharma et al., 2019).
The ozone treatment significantly affects the physiological state of the plants, causing a decrease in photosynthetic parameters, including A_N_, ETR, PhiPII, and delayed fluorescence. The biostimulant treatment completely reversed these effects (Figures 1A-C; Figures 2A-B). Therefore, we propose that LEE may exert a biostimulant effect on grapevine plants by improving their overall physiological state.
Ozone-induced damage in living organisms is primarily due to its high oxidizing power. This damage mainly results from the generation of reactive oxygen species (ROS), either through the spontaneous decomposition of O_3_ upon entering the apoplastic space or through direct interactions with various cellular components. These processes trigger oxidative damage to biomolecules, potentially compromising crucial cellular functions (Agathokleous et al., 2015).
Accordingly, the protective effect of LEE in plants exposed to ozone can be largely attributed to the antioxidant capacity of the biostimulant, as demonstrated by the DPPH and ABTS values (Table 1), a particularly relevant aspect to highlight. Another notable characteristic of this product is its osmoprotective ability, which is due to the high amount of the amino acid proline present in the hydrolysate (Table 2). According to Raza et al. (2023), plants accumulate this amino acid in response to various abiotic stresses. In addition to helping maintain osmotic balance, proline preserves cell turgor and indirectly modulates the metabolism of reactive oxygen species (ROS).
Currently, the advancement of omics sciences, driven by the development of genome sequencing technologies and the reduction in their costs, has transformed the understanding and identification of metabolic pathways in plants (Owen et al., 2017). To evaluate the effect of ozone and the biostimulant on plants, a transcriptomic analysis was performed using the RNA-Seq technique, allowing us to analyze global gene expression changes with high precision. The RNA-Seq analysis reveals significant changes in gene expression in response to ozone and the biostimulant treatment.
Compared to control plants, those exposed to ozone exhibit inhibited 50S and 30S ribosomal proteins present in chloroplasts and mitochondria (Table 3). These findings suggest a substantial impairment in the synthesis of proteins essential for key cellular processes such as photosynthesis, respiration, and antioxidant defense, ultimately compromising plant cell health and viability. Consistently, previous studies conducted on Arabidopsis thaliana exposed to elevated ozone concentrations (≥300ppb) reported a significant downregulation of genes encoding chloroplast ribosomal subunits (e.g., tAPX and Cu/Zn SOD, both associated with antioxidant pathways) and mitochondrial components (e.g., Mn SOD), thereby corroborating our results (Li et al., 2006).
Genes related to oxidative stress are differentially expressed, including transcription factors associated with phytohormones, highlighting, for example the ethylene-responsive transcription factors. Ethylene production, which can occur in high amounts following ozone exposure, may lead to cell death; however, ethylene at low concentrations can induce defense genes in Arabidopsis (Tamaoki et al., 2003). Proteins containing the BHLH (Basic Helix-Loop-Helix) domain were also found, as well as MYB, WRKY, and NAC transcription factors. Additionally, there was an overexpression of proteins that function as defense and adaptation mechanisms to minimize damage to proteins and other cellular components (Asthir, 2015; Foyer and Noctor, 2005). These include post-translational modifications, protein turnover, and chaperones, as well as the overexpression of glutathione S-transferases, oxidoreductases. These results align with findings in tomato, wheat, and barley plants (Gallé et al., 2009; Rezaei et al., 2013), where high expression of these enzymes correlated with greater tolerance to abiotic stress. This acclimation could also be due to redox regulations exerted by thioredoxins and glutaredoxins, which were differentially expressed upon ozone application. These two oxidoreductases regulate signal transduction pathways associated with plant growth, defense, and productivity (Jiménez et al., 2024).
The overexpression of pathways involved in the synthesis of biotin and phenolic compounds observed when plants are exposed to ozone provides valuable insights. On one hand, the activation of phenolic pathways (such as phenylpropanoids, stilbenes, and flavonoids) leads to the production of secondary metabolites associated with antioxidant activity, pathogen defense, and environmental stress resistance, as well as the strengthening of the cell wall. On the other hand, biotin is essential for fatty acid metabolism, gluconeogenesis, and abiotic stress responses, acting as a protective molecule (Cataldo et al., 2022; Noronha et al., 2023). These effects have been observed with the use of Ascophyllum nodosum (a brown seaweed) extracts, which stimulate antioxidant enzymes and phenylpropanoid pathways (including resveratrol) in tomato, enhancing defense against pathogens such as Botrytis and Plasmopara (Kanojia et al., 2024). Additionally, in Vitis vinifera, biostimulants have been shown to increase the accumulation of phenolics, biotin, and defense-related enzymes, thereby improving, for instance, drought tolerance (Irani et al., 2021). These pathways are crucial for wine quality and human health (Reinisalo et al., 2015).
The application of the biostimulant in ozone-stressed plants demonstrates that this product could mitigate stress by reducing oxidative damage in these plants while also enhancing resilience, as the plant may be better prepared to defend itself. This is evidenced by the overexpression of flavonoid and phenylpropanoid biosynthesis pathways in the presence of LEE (Bulgakov et al., 2024; Dao et al., 2025).
Another important aspect is resource conservation for the plant, as there is lower energy expenditure on defense due to the reduced activation of emergency stress responses. As shown in Table 4, the FoldChange of stress-related genes is less overexpressed or even repressed. Additionally, differentially expressed genes were found which play fundamental roles in signal perception and transduction. Studies have shown that the overexpression of these genes in Vitis vinífera model plants improves drought tolerance, indicating their potential for genetic improvement of crops under adverse conditions (Liu et al., 2024).
Therefore, the biostimulant alleviates the impact of ozone, optimizing metabolic efficiency and plant health.
Conclusion
5
In this study, we have analyzed the protective effect of a biostimulant obtained from red wine lees against abiotic stress induced by ozone in Vitis vinifera plants. Ozone has negative effects on both the growth and overall health of grapevines, which can lead to a decrease in productivity and wine quality. This is particularly concerning in areas where ozone concentrations are high due to atmospheric pollution.
The application of LEE effectively reversed the negative effects of ozone on plant physiology, improving photosynthetic activity and overall plant health. The antioxidant and osmoprotective properties of the biostimulant, along with its ability to influence key metabolic pathways, provide significant resilience against oxidative stress. In addition, the biostimulant optimizes resource use in plants by reducing the activation of emergency stress responses, thus supporting their growth and productivity. These results indicate that LEE may represent a valuable strategy to obtain a functional biostimulant from viticulture by-products, contributing to the circular use of grape-derived residues.
A limitation of this study is that all experiments were conducted under controlled greenhouse conditions on potted Vitis vinifera cv. Syrah plants, rather than in commercial vineyards. Consequently, the responses observed here may not fully represent the performance of grapevines grown under open-field conditions, and further trials in commercial vineyards will be necessary to validate the effectiveness and agronomic relevance of this biostimulant.
The reference list from the paper itself. Each links out to its DOI / PubMed record.
- 1Agathokleous E. Feng Z. Saitanis C. J. (2023). Effects of ozone on forests. Handb. Air Qual. Climate Change. 821–848. doi: 10.1007/978-981-15-2760-9_24 · doi ↗
- 2Agathokleous E. Saitanis C. J. Koike T. (2015). Tropospheric O 3, the nightmare of wild plants: A review study. J. Agric. Meteorology. 71, 142–152. doi: 10.2480/agrmet.D-14-00008 · doi ↗
- 3Ascenso A. Gama C. Blanco-Ward D. Monteiro A. Silveira C. Viceto C. . (2021). Assessing douro vineyards exposure to tropospheric ozone. Atmosphere. 12, 1–17. doi: 10.3390/atmos 12020200 · doi ↗
- 4Asthir B. (2015). Mechanisms of heat tolerance in crop plants. Biol. Plantarum 59, 620–628. doi: 10.1007/s 10535-015-0539-5 · doi ↗
- 5Baroi A. M. Popitiu M. Fierascu I. Sărdărescu I. D. Fierascu R. C. (2022). Grapevine wastes: A rich source of antioxidants and other biologically active compounds. Antioxidants 11, 393. doi: 10.3390/antiox 11020393, PMID: 35204275 PMC 8869687 · doi ↗ · pubmed ↗
- 6Betzelberger A. M. Gillespie K. M. Mcgrath J. M. Koester R. P. Nelson R. L. Ainsworth E. A. (2010). Effects of chronic elevated ozone concentration on antioxidant capacity, photosynthesis and seed yield of 10 soybean cultivars. Plant Cell Environ. 33, 1569–1581. doi: 10.1111/j.1365-3040.2010.02165.x, PMID: 20444212 · doi ↗ · pubmed ↗
- 7Betzelberger A. M. Yendrek C. R. Sun J. Leisner C. P. Nelson R. L. Ort D. R. . (2012). Ozone exposure response for U.S. soybean cultivars: Linear reductions in photosynthetic potential, biomass, and yield. Plant Physiol. 160, 1827–1839. doi: 10.1104/pp.112.205591, PMID: 23037504 PMC 3510113 · doi ↗ · pubmed ↗
- 8Biswas D. K. Xu H. Li Y. G. Sun J. Z. Wang X. Z. Han X. G. . (2008). Genotypic differences in leaf biochemical, physiological and growth responses to ozone in 20 winter wheat cultivars released over the past 60 years. Global Change Biol. 14, 46–59. doi: 10.1111/j.1365-2486.2007.01477.x · doi ↗