Correction: Metabolic interactions between bacterial co-isolates from catheter-associated urinary tract infections
Dmytro Sokol, Olena Rzhepishevska, Iryna Marynova, Tor Monsen, Henrik Antti, Madeleine Ramstedt

Abstract
Genes, proteins, chemicals, diseases, species, mutations and cell lines named across the full text — each resolved to its canonical identifier and authoritative record.
Click any figure to enlarge with its caption.
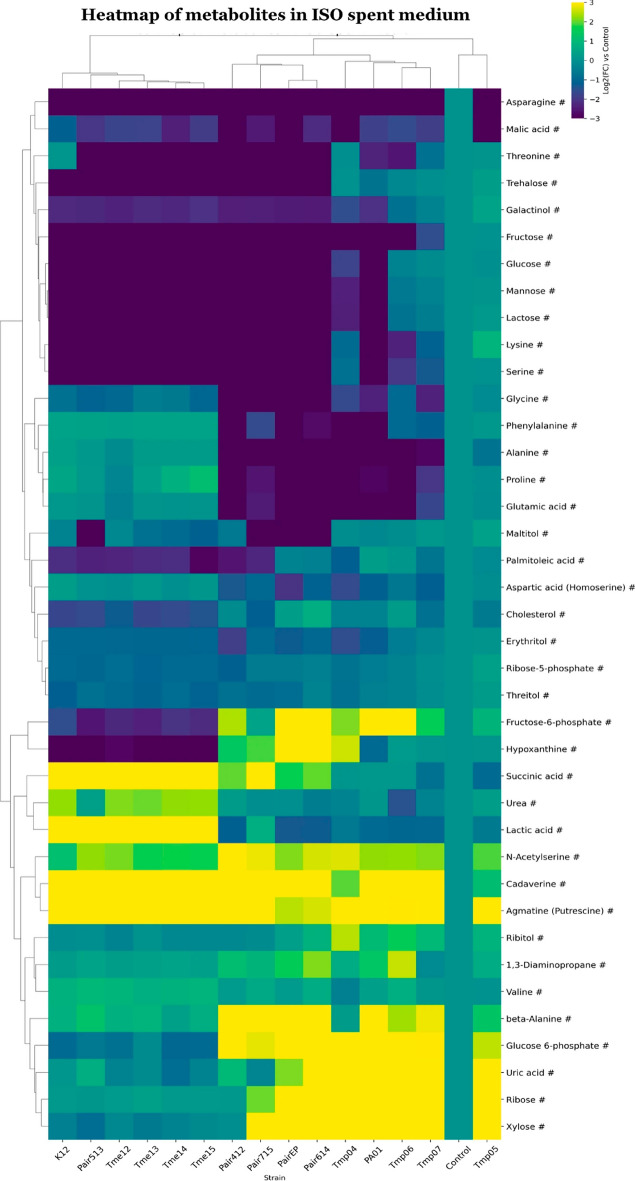 Figure 1
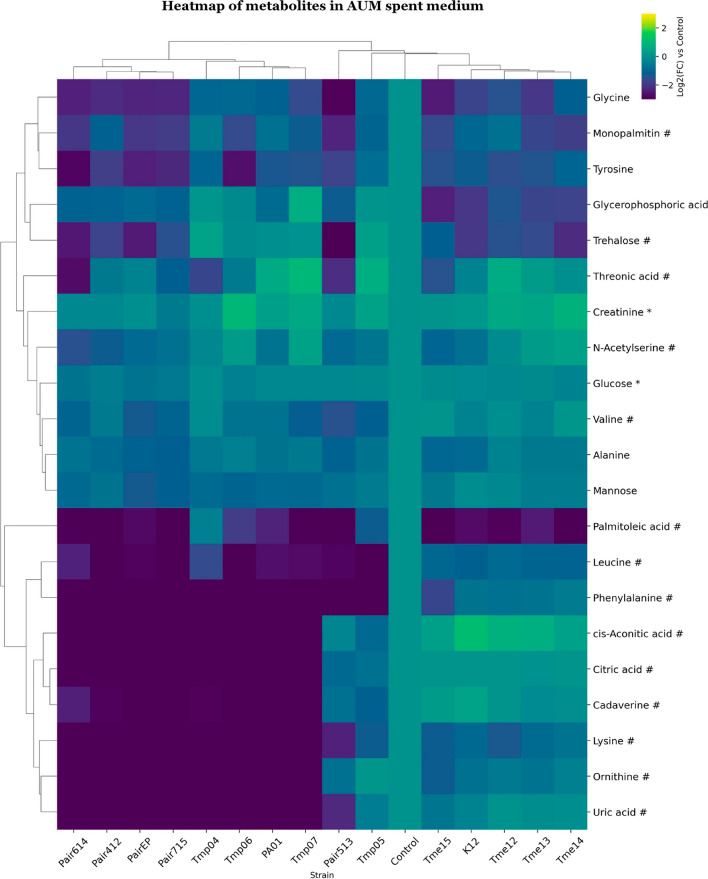 Figure 2
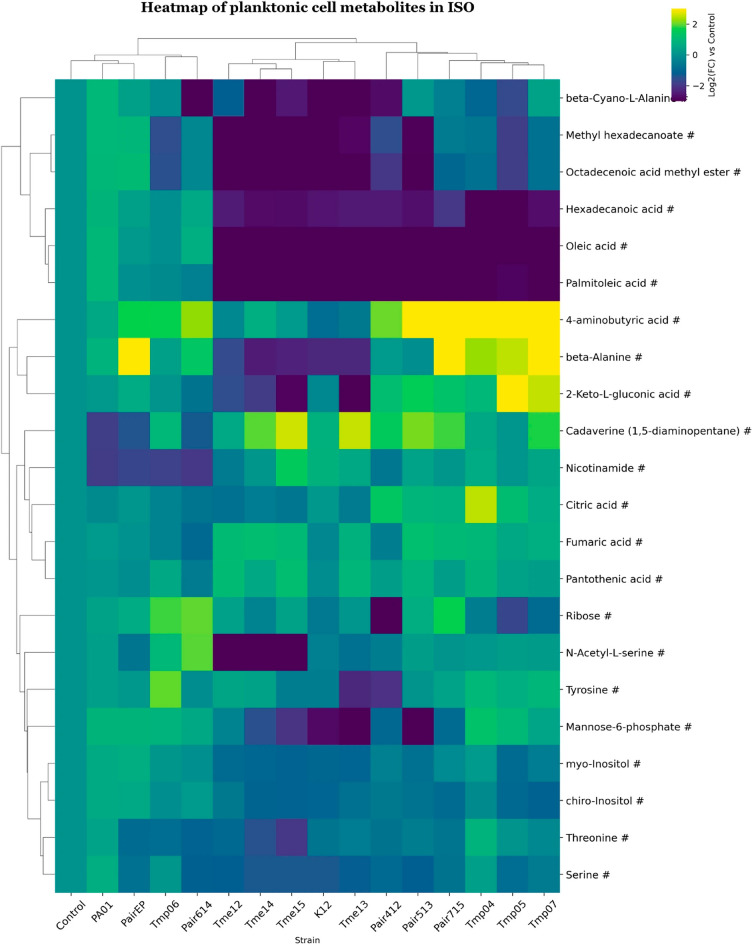 Figure 3
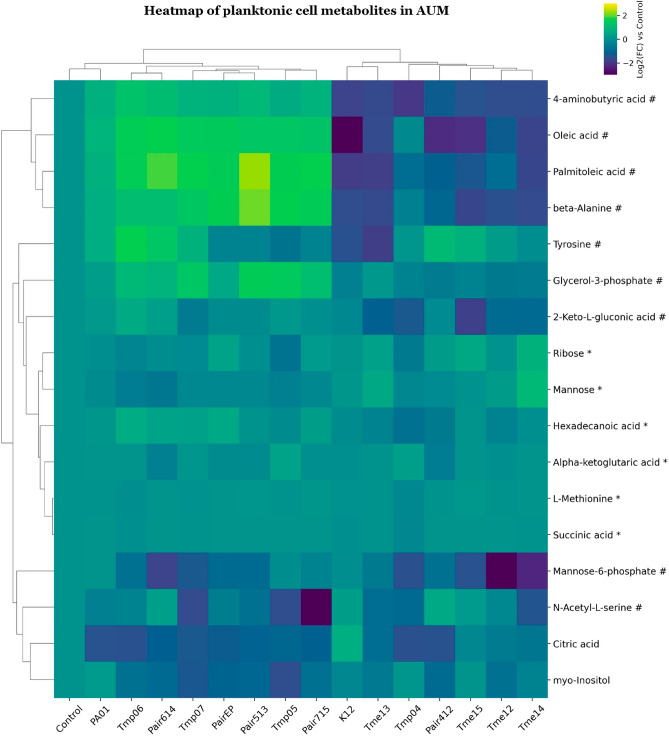 Figure 4
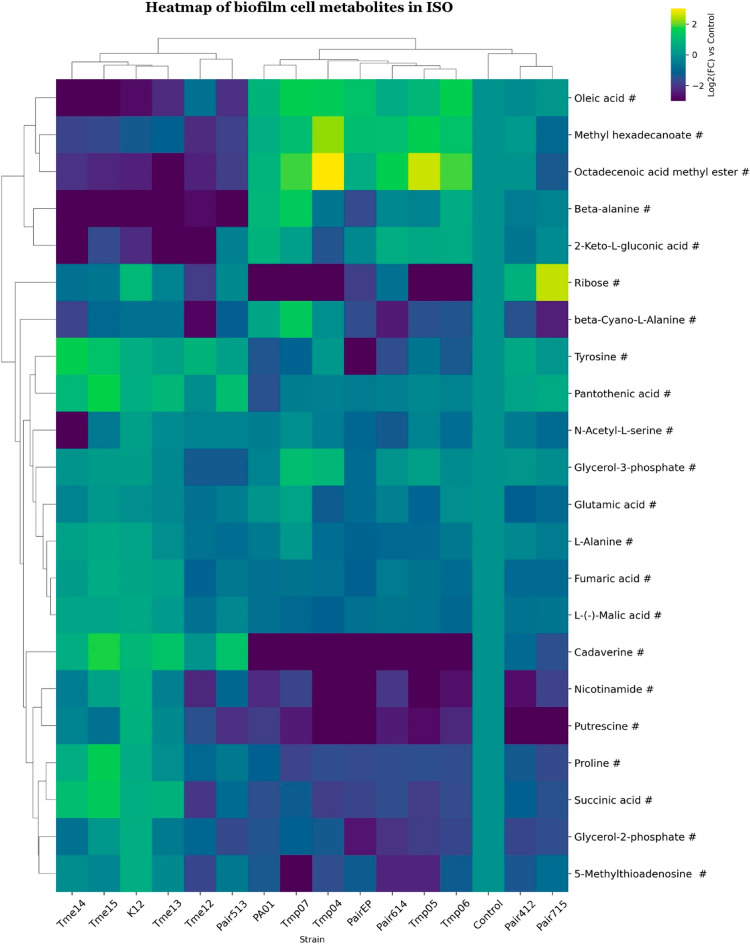 Figure 5
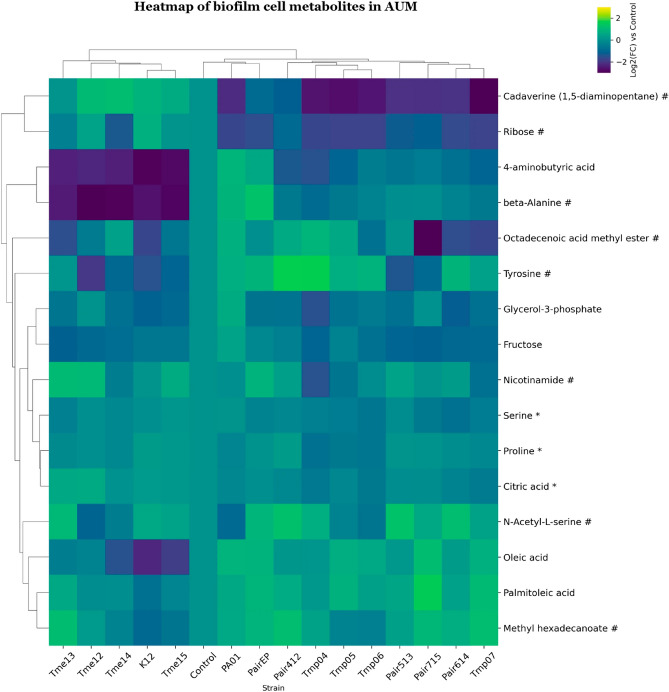 Figure 6
Peer Reviews
No public reviews on file for this paper yet. If you reviewed it on a platform where reviews are public (OpenReview, ICLR, NeurIPS, ICML), you can paste yours below so the community can read it here.
Videos
No videos yet. Explain this paper in a talk, walkthrough, or lecture? Add one.
Taxonomy
TopicsUrinary Tract Infections Management · Infectious Disease Case Reports and Treatments · Escherichia coli research studies
Correction to : Scientific Reports 10.1038/s41598-025-33855-1, published online 14 January 2026
The original version of this Article contained errors in the legend of Figure 4, 5, 6, 7, 8 and 9 where the following sentence was omitted: “(p-value < 0.05 after FDR correction) are marked with an asterisk (*), while those with a significant fold-change (absolute log2FC > 0.75)”. As a result, the legends of the figures have been corrected as follows:
“Figure 4. Clustered heatmap of significant metabolites in ISO spent medium.
Clustered heatmap of significant metabolites in ISO spent medium. Metabolites are marked based on their significance: those that are statistically significant (p-value 0.75) are marked with a hashtag (#). Metabolites that meet both criteria are left unmarked. The FC for each metabolite in bacterial samples was calculated relative to its peak area in the medium control sample. Heatmap was generated using Cowtea v1.0.0 (repository link https://github.com/sokoljator/CAUTI-metabolomics).”
now reads:
“Figure 4. Clustered heatmap of significant metabolites in ISO spent medium.
Metabolites are marked based on their significance: those that are statistically significant (p-value < 0.05 after FDR correction) are marked with an asterisk (*), while those with a significant fold-change (absolute log2FC > 0.75) are marked with a hashtag (#). Metabolites that meet both criteria are left unmarked. The FC for each metabolite in bacterial samples was calculated relative to its peak area in the medium control sample. Heatmap was generated using Cowtea v1.0.0 (repository link https://github.com/sokoljator/CAUTI-metabolomics)”.
“Figure 5. Clustered heatmap of significant metabolites in AUM spent medium.
Clustered heatmap of significant metabolites in AUM spent medium. Metabolites are marked based on their significance: those that are statistically significant (p value 0.75) are marked with a hashtag (#). Metabolites that meet both criteria are left unmarked. The FC for each metabolite in bacterial samples was calculated relative to its peak area in the medium control sample. Heatmap was generated using Cowtea v1.0.0 (repository link https://github.com/sokoljator/CAUTI-metabolomics)”.
now reads:
“Figure 5. Clustered heatmap of significant metabolites in AUM spent medium.
Metabolites are marked based on their significance: those that are statistically significant (p value < 0.05 after FDR correction) are marked with an asterisk (*), while those with a significant fold-change (absolute log2FC > 0.75) are marked with a hashtag (#). Metabolites that meet both criteria are left unmarked. The FC for each metabolite in bacterial samples was calculated relative to its peak area in the medium control sample. Heatmap was generated using Cowtea v1.0.0 (repository link https://github.com/sokoljator/CAUTI-metabolomics )”.
“Figure 6. Clustered heatmap of significant metabolites in mono- and co-cultures of planktonic cell samples in ISO.
Clustered heatmap of significant metabolites in mono- and co-cultures of planktonic cell samples in ISO. Metabolites are marked based on their significance: those that are statistically significant (p-value 0.75) are marked with a hashtag (#). Metabolites that meet both criteria are left unmarked. The FC for each metabolite in bacterial samples was calculated relative to its peak area in the control (average metabolite composition of K12 and PA01). Heatmap was generated using Cowtea v1.0.0 (repository link https://github.com/sokoljator/CAUTI-metabolomics)”.
now reads:
“Figure 6. Clustered heatmap of significant metabolites in mono- and co-cultures of planktonic cell samples in ISO.
Metabolites are marked based on their significance: those that are statistically significant (p-value < 0.05 after FDR correction) are marked with an asterisk (*), while those with a significant fold-change (absolute log2FC > 0.75) are marked with a hashtag (#). Metabolites that meet both criteria are left unmarked. The FC for each metabolite in bacterial samples was calculated relative to its peak area in the control (average metabolite composition of K12 and PA01). Heatmap was generated using Cowtea v1.0.0 (repository link https://github.com/sokoljator/CAUTI-metabolomics)”.
“Figure 7. Clustered heatmap of significant metabolites in mono- and co-cultures of planktonic cell samples in AUM.
Clustered heatmap of significant metabolites in mono- and co-cultures of planktonic cell samples in AUM. Metabolites are marked based on their significance: those that are statistically significant (p-value 0.75) are marked with a hashtag (#). Metabolites that meet both criteria are left unmarked. The FC for each metabolite in bacterial samples was calculated relative to its peak area in the control (average metabolite composition of K12 and PA01). Heatmap was generated using Cowtea v1.0.0 (repository link https://github.com/sokoljator/CAUTI-metabolomics)”.
now reads:
“Figure 7. Clustered heatmap of significant metabolites in mono- and co-cultures of planktonic cell samples in AUM.
Metabolites are marked based on their significance: those that are statistically significant (p-value < 0.05 after FDR correction) are marked with an asterisk (*), while those with a significant fold-change (absolute log2FC > 0.75) are marked with a hashtag (#). Metabolites that meet both criteria are left unmarked. The FC for each metabolite in bacterial samples was calculated relative to its peak area in the control (average metabolite composition of K12 and PA01). Heatmap was generated using Cowtea v1.0.0 (repository link https://github.com/sokoljator/CAUTI-metabolomics)”.
“Figure 8. Clustered heatmap of significant metabolites in mono- and co-cultures of biofilm cell samples in ISO.
Clustered heatmap of significant metabolites in mono- and co-cultures of biofilm cell samples in ISO. Metabolites are marked based on their significance: those that are statistically significant (p-value 0.75) are marked with a hashtag (#). Metabolites that meet both criteria are left unmarked. The FC for each metabolite in bacterial samples was calculated relative to its peak area in the control (average metabolite composition of K12 and PA01). Heatmap was generated using Cowtea v1.0.0 (repository link https://github.com/sokoljator/CAUTI-metabolomics)”.
now reads:
“Figure 8. Clustered heatmap of significant metabolites in mono- and co-cultures of biofilm cell samples in ISO.
Metabolites are marked based on their significance: those that are statistically significant (p-value < 0.05 after FDR correction) are marked with an asterisk (*), while those with a significant fold-change (absolute log2FC > 0.75) are marked with a hashtag (#). Metabolites that meet both criteria are left unmarked. The FC for each metabolite in bacterial samples was calculated relative to its peak area in the control (average metabolite composition of K12 and PA01). Heatmap was generated using Cowtea v1.0.0 (repository link https://github.com/sokoljator/CAUTI-metabolomics)”.
“Figure 9. Clustered heatmap of significant metabolites in mono- and co-cultures of biofilm cell samples in AUM.
Clustered heatmap of significant metabolites in mono- and co-cultures of biofilm cell samples in ISO. Metabolites are marked based on their significance: those that are statistically significant (p-value 0.75) are marked with a hashtag (#). Metabolites that meet both criteria are left unmarked. The FC for each metabolite in bacterial samples was calculated relative to its peak area in the control (average metabolite composition of K12 and PA01). Heatmap was generated using Cowtea v1.0.0 (repository link https://github.com/sokoljator/CAUTI-metabolomics) ”.
now reads:
“Figure 9. Clustered heatmap of significant metabolites in mono- and co-cultures of biofilm cell samples in AUM.
Metabolites are marked based on their significance: those that are statistically significant (p-value < 0.05 after FDR correction) are marked with an asterisk (*), while those with a significant fold-change (absolute log2FC > 0.75) are marked with a hashtag (#). Metabolites that meet both criteria are left unmarked. The FC for each metabolite in bacterial samples was calculated relative to its peak area in the control (average metabolite composition of K12 and PA01). Heatmap was generated using Cowtea v1.0.0 (repository link https://github.com/sokoljator/CAUTI-metabolomics)”.
The original Article has been corrected.