Perfect collinearity not created equal: measuring and visualizing the severity of multi-collinearity of modern omics data
Wei Q. Deng, Radu V. Craiu, Lei Sun

TL;DR
This paper introduces new methods to measure and visualize multi-collinearity in high-dimensional data, such as genomics, to better understand data redundancy and its impact on statistical analysis.
Contribution
The paper proposes individualized and global measures to assess and visualize multi-collinearity in high-dimensional omics data.
Findings
New measures can visualize patterns of perfect collinearity in high-dimensional data.
The measures reveal differences in linkage disequilibrium between sexes on the human X chromosome.
The methods highlight gene regions with excessive multi-collinearity.
Abstract
Multi-collinearity frequently occurs in modern statistical applications and when ignored, can negatively impact model selection and statistical inference. Though perfect collinearity is always present in “n < p” data, we demonstrate that perfect collinearity arises differently, from diverse data redundancy patterns and/or data dimensions. Classic tools and measures that were developed for “n > p” data cannot be used to distinguish or visualize these patterns in the high-dimensional regime. Here we propose 1) new individualized measures that can be used to visualize patterns of perfect collinearity, and subsequently 2) global measures to assess the overall burden of multi-collinearity irrespective of data dimensions. We applied these measures to the human X chromosome data to understand similarity and differences in linkage disequilibrium structure due to sex and genetic features. The…
Genes, proteins, chemicals, diseases, species, mutations and cell lines named across the full text — each resolved to its canonical identifier and authoritative record.
Click any figure to enlarge with its caption.
 Figure 1
 Figure 2
 Figure 3
 Figure 4
 Figure 5
 Figure 6
 Figure 7
 Figure 8
 Figure 9
 Figure 10
 Figure 11
 Figure 12
 Figure 13
 Figure 14
 Figure 15
 Figure 16
 Figure 17
 Figure 18
 Figure 19
 Figure 20
 Figure 21
 Figure 22
 Figure 23
 Figure 1
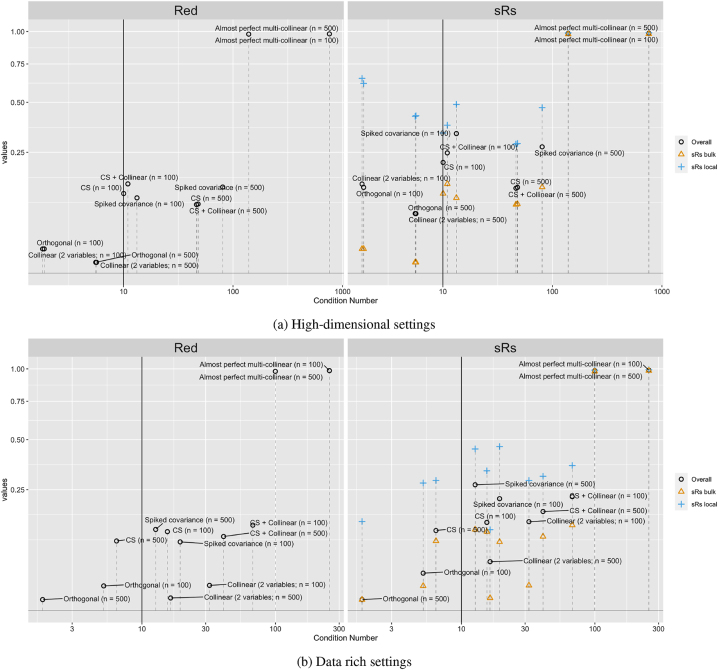 Figure 2
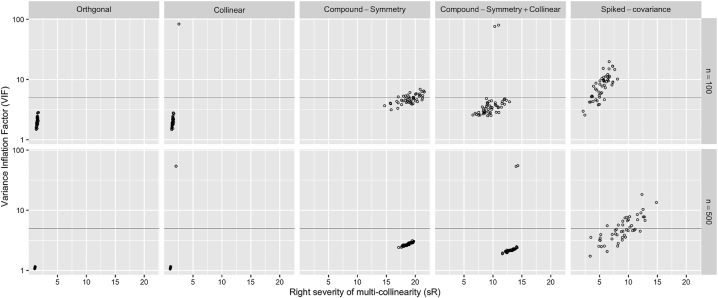 Figure 3
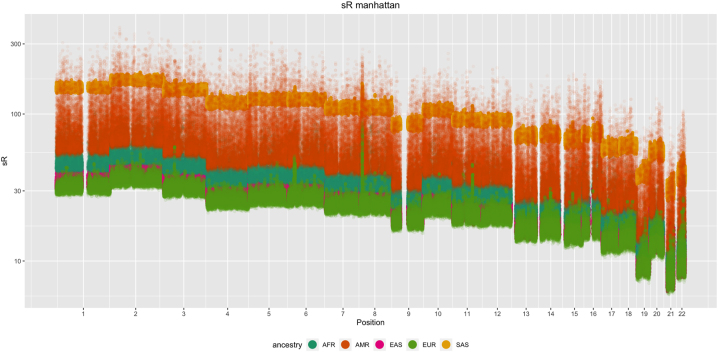 Figure 4
 Figure 28
 Figure 29
 Figure 30
 Figure 31
 Figure 32
 Figure 33
 Figure 34
 Figure 35
 Figure 36
 Figure 37
 Figure 38
 Figure 39
 Figure 40
 Figure 41
 Figure 42
 Figure 43
 Figure 44
 Figure 45
 Figure 46
 Figure 47
 Figure 48
 Figure 49
 Figure 50
Peer Reviews
No public reviews on file for this paper yet. If you reviewed it on a platform where reviews are public (OpenReview, ICLR, NeurIPS, ICML), you can paste yours below so the community can read it here.
Videos
No videos yet. Explain this paper in a talk, walkthrough, or lecture? Add one.
Taxonomy
TopicsBioinformatics and Genomic Networks · Statistical Methods and Inference · Genetic Associations and Epidemiology