Disability and Relapse Risk in Late-Onset Myelin Oligodendrocyte Glycoprotein Antibody–Associated Disease
Hyunjin Ju, Ki Hoon Kim, Sook Young Woo, Yeon Hak Chung, Ho Jin Kim, Hyunjin Kim, Eun-Jae Lee, Young-Min Lim, Woohee Ju, Sung-Min Kim, Young Nam Kwon, Seung Woo Kim, Ha Young Shin, In Soo Joo, Sohyeon Kim, Hung Youl Seok, Jeong Bin Bong, Byeol-A. Yoon, Jong Kuk Kim, You-Ri Kang

TL;DR
This study finds that late-onset MOGAD is not linked to higher relapse risk but is associated with greater disability compared to adult-onset cases.
Contribution
The study identifies a novel association between late-onset MOGAD and increased moderate disability risk, independent of relapse patterns.
Findings
Late-onset MOGAD was not significantly associated with time to first relapse.
Late-onset MOGAD was independently associated with a higher risk of moderate disability at last follow-up.
Late-onset patients had lower brain involvement but more monophasic disease course compared to adult-onset patients.
Abstract
This cohort study compares characteristics of adult-onset vs late-onset myelin oligodendrocyte glycoprotein (MOG) antibody–associated disease and examines associations with risk of relapse and moderate disability. Is late-onset myelin oligodendrocyte glycoprotein antibody–associated disease (MOGAD) associated with a higher risk of time to first relapse or disability compared with adult-onset MOGAD? In this cohort study of 350 adult patients with MOGAD in South Korea, late onset was not uncommon, accounting for 35% of patients. Late onset was not associated with time to first relapse but was independently associated with a higher risk of moderate disability at last follow-up. These findings suggest that patients with late-onset MOGAD may require closer monitoring and early disability-focused interventions. The impact of late onset in myelin oligodendrocyte glycoprotein…
Genes, proteins, chemicals, diseases, species, mutations and cell lines named across the full text — each resolved to its canonical identifier and authoritative record.
Click any figure to enlarge with its caption.
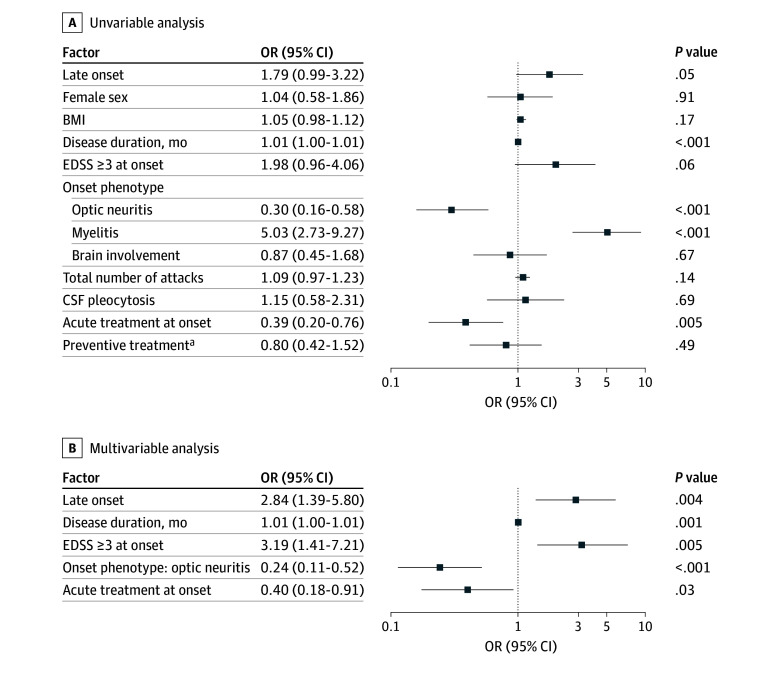 Figure 1
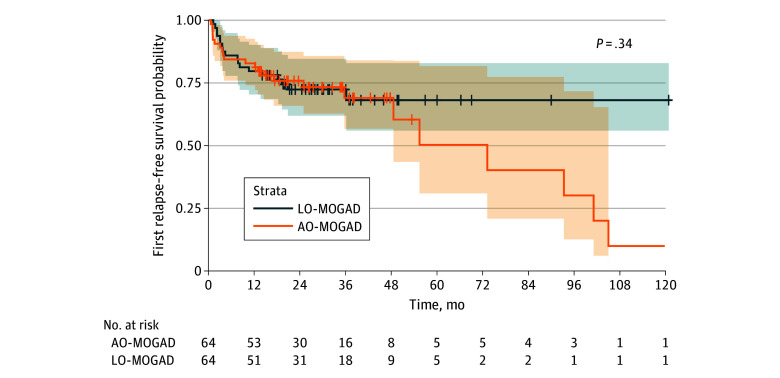 Figure 2
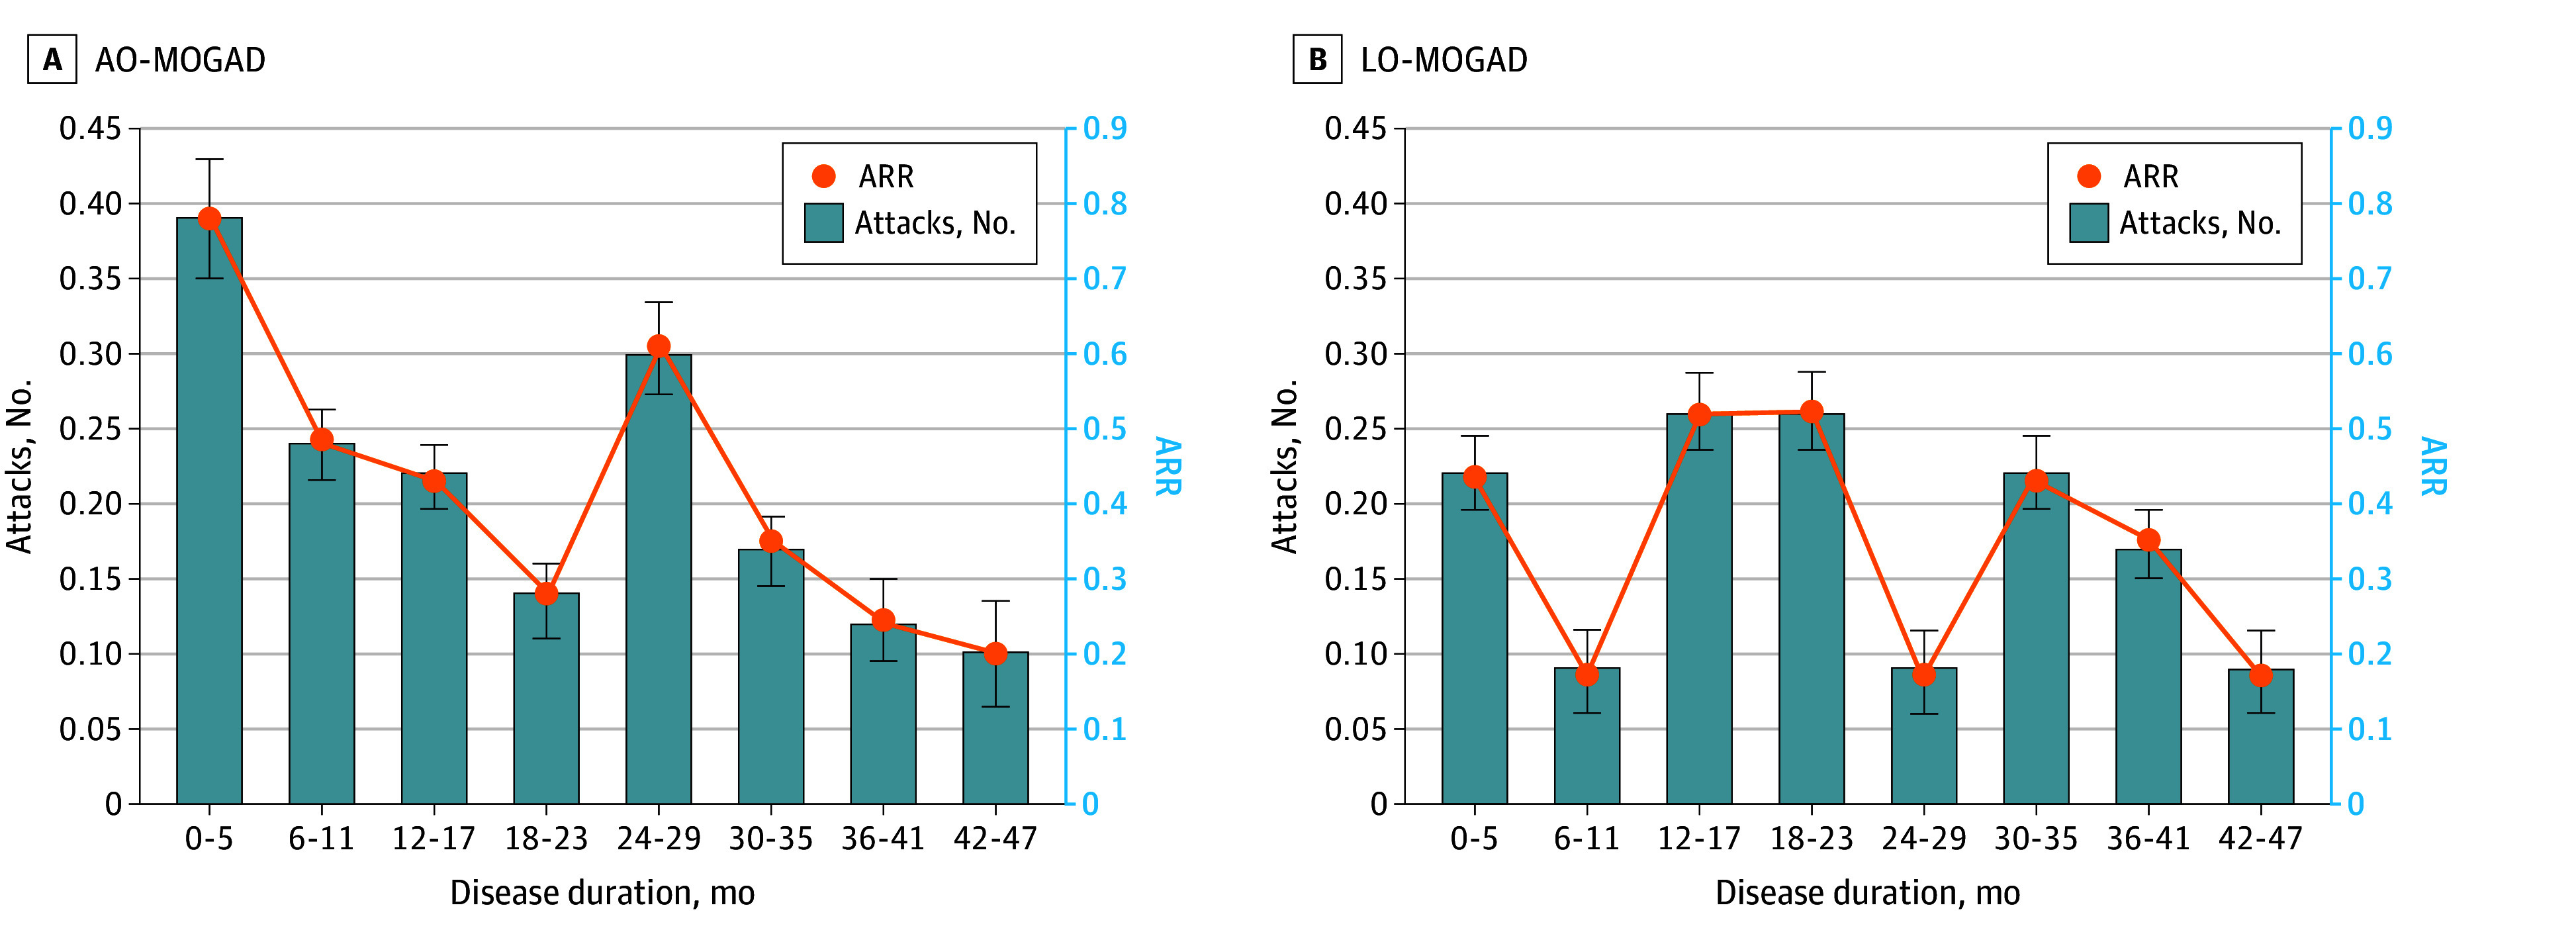 Figure 3
| Characteristic | Participants, No./total No. (%) | |||
|---|---|---|---|---|
| Late-onset MOGAD (n = 124) | Adult-onset MOGAD (n = 226) | All MOGAD (N = 350) | ||
| Age at onset, mean (SD), y | 60.1 (7.1) | 34.0 (8.7) | 43.2 (15.0) | <.001 |
| Sex | ||||
| Female | 75/124 (60.5) | 114/226 (50.4) | 189/350 (54.0) | .07 |
| Male | 49/124 (39.5) | 112/226 (49.5) | 161/350 (46.0) | |
| Body mass index, mean (SD) | 24.2 (3.3) | 24.2 (4.6) | 24.2 (4.2) | .91 |
| Disease duration, median (IQR), mo | 26.5 (9.4-44.1) | 35.1 (14.9-82.2) | 29.9 (13.1-63.1) | <.001 |
| Attack type at onset | ||||
| Optic neuritis | 67/124 (54.0) | 116/226 (51.3) | 183/350 (52.3) | .63 |
| Myelitis | 35/124 (28.2) | 61/226 (27.0) | 96/350 (27.4) | .80 |
| Brain | 26/124 (21.0) | 75/226 (33.2) | 101/350 (28.9) | .02 |
| Attack type during the course | ||||
| Optic neuritis | 70/124 (56.5) | 143/226 (63.3) | 213/350 (60.9) | .21 |
| Myelitis | 40/124 (32.3) | 85/226 (37.6) | 125/350 (35.7) | .32 |
| Brain | 28/124 (22.6) | 95/226 (42.0) | 123/350 (35.1) | <.001 |
| Relapse data | ||||
| Monophasic course | 55/95 (57.9) | 75/188 (39.9) | 130/283 (45.9) | .004 |
| Total No. of attacks, median (IQR) | 1.0 (1.0-2.0) | 1.5 (1.0-3.0) | 1.0 (1.0-3.0) | <.001 |
| Annualized relapse rate, median (IQR) | 0.00 (0.00-0.38) | 0.14 (0.00-0.39) | 0.05 (0.00-0.38) | .02 |
| Disease disability, EDSS score | ||||
| At onset, median (IQR) | 3.0 (2.0-4.0) | 3.0 (2.0-4.0) | 3.0 (2.0-4.0) | .94 |
| At last visit | ||||
| Median (IQR) | 2.0 (1.0-2.0) | 1.0 (0.0-2.0) | 1.0 (0.0-2.0) | <.001 |
| EDSS score ≥3 | 25/124 (20.2) | 28/226 (12.4) | 53/350 (15.1) | .05 |
| EDSS score ≥6 | 4/124 (3.2) | 3/226 (1.3) | 7/350 (2.0) | .23 |
| Visual disability, visual functional system score, median (IQR) | ||||
| At onset | 2.5 (0.0-5.0) | 2.0 (0.0-5.0) | 2.0 (0.0-5.0) | .45 |
| At last follow-up | 1.0 (0.0-2.0) | 0.0 (0.0-1.0) | 0.0 (0.0-1.0) | .03 |
| MOG-IgG | ||||
| Low-positive MOG-IgG | 18/124 (14.5) | 18/226 (8.0) | 36/350 (10.3) | .05 |
| Seronegative conversion | 21/80 (26.3) | 42/141 (29.8) | 63/221 (28.5) | .58 |
| Cerebrospinal fluid analysis | ||||
| White blood cell count, median (IQR), cells/μL | 3 (1-8) | 5 (1-40) | 5 (1-23) | .003 |
| Pleocytosis | 21/94 (22.3) | 73/177 (41.2) | 94/271 (34.7) | .002 |
| Protein, median (IQR), mg/dL | 43.5 (32.5-59.8) | 40.5 (30.0-57.8) | 42.0 (31.0-58.0) | .38 |
| Oligoclonal band positive | 4/87 (4.6) | 17/163 (10.4) | 21/250 (8.4) | .11 |
| IgG index, median (IQR) | 0.55 (0.49-0.63) | 0.57 (0.49-0.68) | 0.56 (0.49-0.66) | .28 |
| Magnetic resonance imaging findings | ||||
| Optic nerve | ||||
| Bilateral involvement | 28/124 (22.6) | 49/226 (21.7) | 77/350 (22.0) | .85 |
| Longitudinal optic nerve involvement | 44/124 (35.5) | 67/226 (29.6) | 111/350 (31.7) | .26 |
| Perineural optic sheath enhancement | 42/124 (33.9) | 62/226 (27.4) | 104/350 (29.7) | .21 |
| Optic disc edema | 34/124 (27.4) | 56/226 (24.8) | 90/350 (25.7) | .59 |
| Spinal cord | ||||
| Longitudinally extensive myelitis | 20/124 (16.1) | 38/226 (16.8) | 58/350 (16.6) | .87 |
| Central cord lesion or H-sign | 16/124 (12.9) | 45/226 (19.9) | 61/350 (17.4) | .10 |
| Conus lesion | 4/124 (3.2) | 15/226 (6.6) | 19/350 (5.4) | .18 |
| Brain | ||||
| Multiple ill-defined T2 hyperintensity lesion in supratentorial and often infratentorial white matter | 21/124 (16.9) | 68/226 (30.1) | 89/350 (25.4) | .007 |
| Deep gray matter involvement | 12/124 (9.7) | 36/226 (15.9) | 48/350 (13.7) | .10 |
| Ill-defined T2-hyperintensity involving pons, middle cerebellar peduncle, or medulla | 17/124 (13.7) | 63/226 (27.9) | 80/350 (22.9) | .003 |
| Cortical lesion with or without lesional and overlying meningeal enhancement | 6/124 (4.8) | 30/226 (13.3) | 36/350 (10.3) | .01 |
| Acute treatment at onset | ||||
| Any treatment | 102/123 (82.9) | 182/224 (81.3) | 284/347 (81.8) | .70 |
| IV steroid | 102/123 (82.9) | 181/224 (80.8) | 283/347 (81.6) | .63 |
| IV steroid followed by IVIG or PLEX | 5/123 (4.1) | 19/224 (8.5) | 24/347 (6.9) | .12 |
| IV steroid and IVIG | 2/123 (1.6) | 11/224 (4.9) | 13/347 (3.7) | .15 |
| IV steroid and PLEX | 3/123 (2.4) | 10/224 (4.5) | 13/347 (3.7) | .40 |
| IVIG only | 0 | 1/224 (0.4) | 1/347 (0.3) | >.99 |
| Preventive treatment | ||||
| IS use | 83/124 (66.9) | 174/225 (77.3) | 257/349 (73.6) | .04 |
| Oral steroids use | 24/124 (19.4) | 33/226 (14.6) | 57/350 (16.3) | .25 |
| Nonsteroid IS use | ||||
| Any | 66/124 (53.2) | 151/225 (67.1) | 217/349 (62.2) | .01 |
| Azathioprine or mycophenolate | 64/124 (51.6) | 133/225 (59.1) | 197/349 (56.4) | .18 |
| Rituximab | 4/124 (3.2) | 22/226 (9.7) | 26/350 (7.4) | .03 |
| Satralizumab or tocilizumab | 0 | 7/226 (3.1) | 7/350 (2.0) | .05 |
| IVIG | 2/124 (1.6) | 19/226 (8.4) | 21/350 (6.0) | .01 |
| Preventive treatment before relapse | 59/124 (47.6) | 85/226 (37.6) | 144/350 (41.1) | .07 |
| Treatment-duration ratio of IS, median (IQR) | 0.67(0.06-0.94) | 0.71(0.20-0.92) | 0.70 (0.17-0.93) | .98 |
| Treatment-duration ratio of nonsteroid IS, median (IQR) | 0.43 (0.00-0.90) | 0.56 (0.02-0.88) | 0.50 (0.00-0.89) | .16 |
| Variable | Risk of relapse | |||||
|---|---|---|---|---|---|---|
| Unadjusted HR (95% CI) | Model 1, adjusted HR (95% CI) | Model 2, adjusted HR (95% CI) | ||||
| Female sex | 0.76 (0.54-1.07) | .12 | NA | NA | NA | NA |
| Late-onset | 0.63 (0.42-0.94) | .02 | 0.64 (0.43-0.95) | .03 | 0.72 (0.48-1.08) | .11 |
| Body mass index | 1.05 (1.00-1.11) | .05 | NA | NA | NA | NA |
| Onset phenotype | ||||||
| Optic neuritis | 1.50 (1.06-2.11) | .02 | 1.48 (1.05-2.09) | .03 | 1.45 (1.03-2.05) | .04 |
| Myelitis | 0.52 (0.34-0.79) | .002 | NA | NA | NA | NA |
| Brain | 1.16 (0.79-1.70) | .44 | NA | NA | NA | NA |
| EDSS score ≥3 at onset | 0.77 (0.52-1.14) | .19 | NA | NA | NA | NA |
| Acute treatment at onset | 1.02 (0.66-1.57) | .94 | NA | NA | NA | NA |
| Preventive treatment before relapse | 0.18 (0.10-0.31) | <.001 | NA | NA | 0.19 (0.11-0.33) | <.001 |
Peer Reviews
No public reviews on file for this paper yet. If you reviewed it on a platform where reviews are public (OpenReview, ICLR, NeurIPS, ICML), you can paste yours below so the community can read it here.
Videos
No videos yet. Explain this paper in a talk, walkthrough, or lecture? Add one.
Taxonomy
TopicsMultiple Sclerosis Research Studies · Neurogenesis and neuroplasticity mechanisms · Peripheral Neuropathies and Disorders
Introduction
Myelin oligodendrocyte glycoprotein antibody–associated disease (MOGAD) is an acquired central nervous system inflammatory demyelinating disease that affects the optic nerve, spinal cord, and/or brain and is characterized by the presence of myelin oligodendrocyte glycoprotein (MOG) immunoglobulin G antibodies. Unlike other central nervous system demyelinating diseases such as multiple sclerosis (MS) or neuromyelitis optica spectrum disorder (NMOSD), MOGAD is more prevalent in children, with distinct clinical phenotypes observed in pediatric and adult patients.^1,2,3^ However, MOGAD can occur at any age with reported range of 1 to 85 years.^1,4,5,6^ As antibody testing becomes widespread and the elderly population grows globally, understanding MOGAD in older patients and establishing management strategies are crucial.
Late-onset MOGAD (LO-MOGAD) have been less explored compared with late-onset MS and NMOSD.^7,8,9^ A recent study reported that LO-MOGAD exhibited different clinical and radiological features compared with pediatric and young adult–onset patients.^10^ However, studies on long-term outcomes such as relapse and disability are still scarce and inconclusive in MOGAD.^11,12^ This is likely attributable to the rarity of MOGAD, with reported annual incidence of 3.4 to 4.8 per million and prevalence of 1.3 to 2.5 per 100 000, and to its relatively recent recognition as a distinct clinical entity compared with MS and NMOSD.^2,4^ In this study, we compared the characteristics of patients with LO-MOGAD and adult-onset MOGAD (AO-MOGAD) using a nationwide, multicenter registry in Korea and investigated the association of late onset with the risk of relapse and moderate disability.
Methods
Study Populations
In this nationwide, multicenter retrospective cohort study, we enrolled adult patients with MOGAD with detailed medical records between August 2018 and September 2024 from 28 secondary or tertiary hospitals in South Korea. Inclusion criteria were as follows: (1) diagnosis of MOGAD according to the 2023 international MOGAD diagnostic criteria and (2) patients with Expanded Disability Status Scale (EDSS) score assessed at least 4 weeks after a recent relapse.^4^ Patients with onset before 18 years of age (34 individuals), with anti-aquaporin-4 antibody (3 individuals), and without last EDSS data (11 individuals) were excluded. Duplicate records were merged (17 individuals). Patients were categorized by age at onset into AO-MOGAD (18-49 years) and LO-MOGAD (≥50 years) groups (eFigure 1 in Supplement 1). This study followed the Strengthening the Reporting of Observational Studies in Epidemiology (STROBE) reporting guideline and was approved by the institutional review board of the Samsung Medical Center. Written informed consent was obtained from all participants.
Data Collection
Demographics, dates, and clinical phenotype of MOGAD onset and relapses, laboratory findings, including MOG immunoglobulin G serostatus and cerebrospinal fluid (CSF) analysis, magnetic resonance imaging (MRI) features, EDSS and visual functional system scores at onset (at the nadir) and at the last follow-up, and treatment data, including acute and preventive immunotherapies were obtained by reviewing the medical records. MRI scans of the orbit, brain, and spinal cord throughout the disease course were reviewed based on supportive criteria.^4^ Monophasic course was defined as no relapse in patients with disease duration over 12 months. The annualized relapse rate (ARR) was calculated using the total number of relapses excluding the index event.
Serum MOG immunoglobulin G assays were performed by the previously described live cell-based flow cytometry assay or the live cell-based assay, using full-length human MOG.^13,14,15^ CSF data included white blood cell count, protein levels, Immunoglobulin G index, and oligoclonal bands; pleocytosis was defined as more than10 white blood cells per microliter. Treatment history included acute treatment at onset and immunosuppressant (IS) use as a preventive treatment, including the dates of initiation and discontinuation. IS included oral steroid and nonsteroid IS, such as azathioprine, mycophenolate mofetil, rituximab, satralizumab, tocilizumab, and intravenous immunoglobulin (IVIG). Preventive treatment was defined as IS use for 3 or more months. Patients with IS for 3 or more months before the first relapse or the last follow-up (if relapse-free) were classified as preventive IS use before relapse. Treatment-duration ratio was calculated as treatment duration/overall disease duration.
Definitions of Time to First Relapse and Moderate Disability
Relapse was defined as a new clinical attack occurring more than 30 days following onset of the previous attack.^4^ Each relapse was confirmed by the treating neurologist, with MRI support when available. Time to first relapse was defined as the interval from disease onset to the first relapse. Moderate disability at the last follow-up was defined as greater than or equal to an EDSS score of 3 at the last visit, indicating moderate disability in 1 functional system or mild disability in 3 to 4 functional systems.^16^
Statistical Analysis
Categorical variables are reported as frequencies (percentages) and were analyzed using the χ^2^ or Fisher exact test. Continuous variables are presented as the mean (SD) or median (IQR) and were compared using the independent t test or Mann-Whitney U test, 1-way analysis of variance, or Kruskal-Wallis test. After comparing clinical characteristics of LO-MOGAD and AO-MOGAD, exploratory sensitivity analysis was performed by stratifying age into 18 to 39 years, 40 to 59 years, and 60 years or older to further examine the distribution of very late-onset cases (≥60 years). For pairwise group comparisons, P values were adjusted using the Bonferroni method owing to multiple comparisons.
Cox proportional hazards regression analysis identified factors associated with the time to first relapse in patients with a disease duration of 12 or more months. Covariate for preventive treatment was considered as a time dependent variable. Binary logistic regression identified factors associated with moderate disability at last follow-up. Variables with P < .10 in univariable analyses were included into multivariable models after assessing multicollinearity if their variance inflation factor was less than 3. The proportional hazards assumption was verified by inspecting the Schoenfeld residual plots for covariates. Variables with minimal missingness (1-2 cases) were analyzed using complete case analysis. Body mass index (BMI; calculated as weight in kilograms divided by height in meters squared), which had a substantial proportion of missing values, was excluded from the multivariable models to avoid excessive loss of sample size. Multiple imputation was not performed.
A 1:1 propensity score matching (PSM) was conducted with a caliper of 0.1, using the nearest neighbor method to balance the covariate between the LO-MOGAD and AO-MOGAD groups. Covariate balance was confirmed using standardized mean differences less than 0.2 (eFigure 2 in Supplement 1).^17,18^ Time to first relapse was analyzed in patients with a disease duration of 12 or more months and the propensity scores were estimated using logistic regression, with covariates including sex, BMI, onset phenotype (optic neuritis, myelitis, and brain), EDSS score at onset, acute treatment at onset, and preventive treatment before relapse. For disability risk analysis, the propensity score was estimated with covariates including sex, BMI, disease duration, onset phenotype (optic neuritis, myelitis, and brain), EDSS score at onset, and acute treatment at onset. To account for the matched design, a Cox proportional hazards model with a robust variance estimator was used to assess the association of LO-MOGAD with time to first relapse and a generalized estimating equation was used to compare moderate disability between the groups. The relapse-free survival curve was estimated using the Kaplan-Meier method.
In 115 patients with disease duration of 48 months or longer, ARR and total number of attacks were plotted at 6-month intervals. A generalized estimating equation with a negative binomial distribution was used to account for repeated measures and overdispersion in the number of attacks. P < .05 was considered statistically significant. All statistical analyses were performed using R software version 4.3.1 (R Project for Statistical Computing) and SPSS Statistics version 29.0. (SPSS Inc).
Results
Clinical and Demographic Data
A total of 350 patients (mean [SD] age at onset, 43.2 [15.0] years; 189 female [54.0%]; 50 [14.2%] developing MOGAD at ≥60 years) with a median (IQR) baseline EDSS of 3.0 (2.0-4.0) were included, with 124 patients (35.4%) in the LO-MOGAD group and 226 patients (64.6%) in the AO-MOGAD group (Table 1). The sex ratio and BMI were not significantly different between the 2 groups. Optic neuritis was the most common phenotype in both groups, followed by myelitis. Brain involvement was less frequent in the LO-MOGAD group at onset (26 patients [21.0%] vs 75 patients [33.2%]; P = .02) and during the entire disease course (28 patients [22.6%] vs 95 patients [42.0%]; P < .001). Compared with the AO-MOGAD group, the LO-MOGAD group showed more frequent monophasic course (55 of 95 patients [57.9%] vs 75 of 188 patients [39.9%]; P = .004), fewer total attacks (median [IQR], 1.0 [1.0-2.0] vs 1.5 [1.0-3.0]; P < .001), lower ARR (median [IQR], 0.00 [0.00-0.38] vs 0.14 [0.00-0.39]; P = .02), and shorter disease duration (median [IQR], 26.5 [9.4-44.1] vs 35.1 [14.9-82.2] months; P < .001). Patients with LO-MOGAD had higher EDSS (median [IQR], 2.0 [1.0-2.0] vs 1.0 [0.0-2.0]; P < .001) and visual functional system (median [IQR], 1.0 [0.0-2.0] vs 0.0 [0.0-1.0]; P = .03) scores at last follow-up than patients with AO-MOGAD, although EDSS and visual functional system scores at onset were not different between the 2 groups. Overall, 53 patients (15.1%) reached moderate disability (EDSS ≥3) at last follow-up. CSF pleocytosis was less frequent in the LO-MOGAD group (21 of 94 patients [22.3%] vs 73 of 177 patients [41.2%]; P = .002). Characteristic brain MRI findings for MOGAD, such as multiple ill-defined T2 lesions in supratentorial and infratentorial white matter; ill-defined T2 lesions involving pons, middle cerebellar peduncle or medulla; and cortical lesions with or without lesional and overlying meningeal enhancement, were significantly less frequent in the LO-MOGAD than in the AO-MOGAD group (Table 1). Acute treatment at onset did not differ between the LO-MOGAD and AO-MOGAD groups; more than 80% of the patients received IV steroids (284 patients [81.8%]) with or without additional IVIG or plasmapheresis. Preventive treatment was less frequent in the LO-MOGAD group than in the AO-MOGAD group; nonsteroid IS use was less frequent in the LO-MOGAD group than in the AO-MOGAD group (66 of 124 patients [53.2%] vs 151 of 225 patients [67.1%]; P = .01), whereas there was no significant difference in the treatment with oral steroids. Particularly, rituximab (4 patients [3.2%] vs 22 patients [9.7%]; P = .03) and IVIG (2 patients [1.6%] vs 19 patients [8.4%]; P = .01) use were significantly more frequently observed in AO-MOGAD group. No one in LO-MOGAD group was treated with satralizumab or tocilizumab. However, the treatment-duration ratio of IS and nonsteroid IS did not differ between the 2 groups. Regarding adverse effects of nonsteroid IS, no significant differences in adverse effect frequencies were observed between the LO-MOGAD and AO-MOGAD across all studied nonsteroid ISs. Details are provided in eTable 1 in Supplement 1.
Sensitivity analysis demonstrated that patients with very late onset (≥60 years), who accounted for 14.2% of the cohort (50 of 350 patients), showed similar differences in clinical characteristics compared with the other age groups (eTable 2 in Supplement 1). A comparison of baseline characteristics of LO-MOGAD and AO-MOGAD in patients with a disease duration of 12 or more months is presented in eTable 3 in Supplement 1.
Factors Associated With Time to First Relapse
In univariable analysis, late onset, myelitis at onset, and preventive treatment before relapse were associated with lower risk of time to first relapse, while optic neuritis at onset was associated with higher risk of time to first relapse. In multivariable analysis adjusting for optic neuritis at onset and preventive treatment before relapse, late onset was not significantly associated with time to first relapse (adjusted hazard ratio [aHR], 0.72; 95% CI, 0.48-1.08; P = .11), while preventive treatment remained protective (aHR, 0.19; 95% CI, 0.11-0.33; P < .001) (Table 2). These findings remained consistent even when myelitis at onset was used as a covariate instead of optic neuritis (eTable 4 in Supplement 1).
Factors Associated With Moderate Disability at Last Follow-Up
In univariable analysis, late onset, longer disease duration, and myelitis at onset were associated with higher risk of moderate disability at the last follow-up, while optic neuritis onset and acute treatment at onset were protective. After adjusting for disease duration, EDSS score of 3 or greater at onset, optic neuritis at onset, and acute treatment at onset, patients with LO-MOGAD demonstrated a 2.8-fold higher risk of moderate disability compared with patients with AO-MOGAD (adjusted odds ratio [aOR], 2.84; 95% CI, 1.39-5.80; P = .004) (Figure 1). Late onset was consistently associated with a higher risk of moderate disability when myelitis at onset was included as a covariate instead of optic neuritis (eTable 5 in Supplement 1).
Binary Logistic Regression Analysis for Factors Associated With Moderate Disability at Last Follow-UpUnadjusted odds ratios (ORs) for univariable analysis and adjusted ORs for multivariable analysis are presented. There were 35 missing values for Expanded Disability Status Scale (EDSS) score of 3 or greater at onset and 3 missing values for acute treatments at onset. BMI indicates body mass index; CSF, cerebrospinal fluid.aPreventive treatment was defined as treatment with immunosuppressant for 3 months or longer.
PSM
In the analysis of time to first relapse in patients with a disease duration 12 or more months (64 patients in each group), frequency of monophasic course, total number of attacks, and ARR were comparable between LO-MOGAD and AO-MOGAD (eTable 6 in Supplement 1). There was no significant difference in time to first relapse between the LO-MOGAD and AO-MOGAD groups (aHR, 0.99; 95% CI, 0.96-1.02, P = .34) (Figure 2). For moderate disability, 101 patients were included in each group after PSM. Patients with LO-MOGAD had a higher risk of moderate disability at the last follow-up (aOR, 2.53; 95% CI, 1.09-5.88; P = .03). This finding was consistent after additional adjustment for covariates with standardized mean differences greater than 0.1, including sex, BMI, and EDSS score at onset for relapse risk (aHR, 0.79; 95% CI, 0.45-1.37; P = .40) and disease duration, and EDSS score at onset for disability risk (aOR, 2.57; 95% CI, 1.14-5.80; P = .02).
Time to First Relapse in Patients With Myelin Oligodendrocyte Glycoprotein Antibody–Associated Disease (MOGAD) After Propensity Score MatchingThe first relapse-free survival probability was estimated using the Kaplan-Meier method based on matched samples (64 individuals in each group). Propensity score matching was performed to balance relevant baseline characteristics between the groups. The shaded areas represent 95% CIs. The number of patients at risk at each time point is shown below. To account for the matched design, the association of late-onset disease with relapse-free survival was assessed using a Cox proportional hazards model with a robust variance estimator. AO-MOGAD indicates adult-onset MOGAD; LO-MOGAD, late-onset MOGAD.
ARR
We analyzed 115 patients with a disease duration of at least 4 years, including 92 patients with AO-MOGAD and 23 patients with LO-MOGAD, and calculated the ARR at 6-month intervals over a 4-year period (Figure 3). There was no significant difference in the longitudinal ARR changes between the 2 groups. Overall, the ARR remained less than 1.0 in both the LO-MOGAD and AO-MOGAD groups throughout the 4-year study period.
Longitudinal Patterns of Relapse Activity Over 48 Months Among Those With Adult-Onset (AO) and Late-Onset (LO) Myelin Oligodendrocyte Glycoprotein Antibody–Associated Disease (MOGAD)The number of attacks and annualized relapse rate (ARR) were assessed at 6-month intervals among patients with disease duration of 48 months or longer. The number of attacks and ARR are shown for each interval as the mean and standard deviation (error bar). A generalized estimating equation with a negative binomial distribution was used to account for repeated measures and overdispersion. The longitudinal ARR patterns over time did not differ significantly between the 2 groups (P = .25).
Discussion
Our nationwide cohort study in South Korea demonstrated that LO-MOGAD is not uncommon and has several distinct features compared with AO-MOGAD. While late onset was not associated with a risk of relapse, it was independently associated with a higher risk of disability.
One-third of patients in our adult MOGAD registry was classified as LO-MOGAD, a higher proportion than in prior reports, even when comparing only adult patients.^1,10,11^ Notably, 14.2% (50 of 350 adult patients) developed MOGAD at age 60 years or older, which surpasses the 6.0% (16 of 268 adult patients) reported in a French MOGAD cohort.^19^ These proportions are comparable to late-onset NMOSD, where late onset cases (age ≥50 years) represent 29% to 45%,^20,21,22^ but are higher than MS, in which only 5% to 12% are late-onset.^23,24^ In MS, the age at onset has increased in recent decades, and this may be attributable to the aging of the population, improved diagnostic methods, or changes in diagnostic criteria.^25,26^ More widespread and feasible antibody testing, increased awareness of disease, and population aging in South Korea may account for the higher LO-MOGAD proportion in our cohort.
LO-MOGAD was associated with less frequent brain involvement and less CSF pleocytosis, which may reflect a less inflammatory disease course in older patients. In MS, aging shifts the disease activity from a relapsing inflammatory course toward progressive neurodegeneration with fewer active demyelinating lesions observed in older patients and in those with longer disease duration.^7,27,28^ In NMOSD, older age at onset correlates with lower ARR.^21,29^ In our cohort, the monophasic course was more frequent and ARR was lower in LO-MOGAD compared with AO-MOGAD. However, these differences were no longer significant after PSM, indicating that a reduced inflammatory activity was largely attributable to other baseline differences rather than age at onset in MOGAD. This finding was supported by the multivariable Cox and PSM analyses showing that late onset was not associated with time to first relapse. Consistently, a French cohort found that only maintenance treatment after onset was associated with relapse, while other clinical factors including age were not.^30^ Recently, in the comparison of patients with early and late adult–onset MOGAD, there was no difference in relapse risk, although this was not confirmed after PSM.^12^ By contrast, a Chinese study suggested lower relapse risk in patients with LO-MOGAD, but they had much lower maintenance therapy rates compared with ours (33% vs 67%).^11^ In our study, the association of late onset with relapse disappeared after adjusting for preventive treatment, underscoring the dominant effect of treatment emphasized in prior studies.^11,30,31,32^
Another notable finding in our cohort was that patients with LO-MOGAD were less likely to receive IS, particularly, monoclonals compared with AO-MOGAD. Moreover, oral nonsteroid IS was most frequently used regardless of age group, despite emerging evidences supporting the benefits of immunotherapies such as IVIG or tocilizumab.^33,34^ This may be attributed to high costs due to the lack of reimbursement in Korea and as well as the fact that our cohort data encompasses a period prior to recommendations of these treatments. Still, prospective clinical trials are essential to establish standardized guidelines for relapse prevention in patients with LO-MOGAD and AO-MOGAD, considering the retrospective design in previous studies.
Overall, 15% of our patients reached moderate disability (EDSS score ≥3) at the last follow-up. Notably, patients with LO-MOGAD showed higher residual disability despite similar baseline EDSS score and shorter disease duration. These findings align with previous studies reporting increased disability risks in late onset patients with MOGAD and NMOSD.^11,35^ While another study found no difference in last EDSS scores between early-onset MOGAD and LO-MOGAD, this study did not conduct PSM analysis and the authors acknowledged that residual disability defined as EDSS of 2 or greater could be confounded by neurologic abnormalities normally observed with aging.^12^
Although the discrepancy between fewer relapses and higher disability in LO-MOGAD could raise the question of progression independent of relapse activity, recent studies have consistently shown that progression independent of relapse activity is rare in MOGAD and that disability is primarily relapse-associated.^36,37^ The greater disability burden observed in LO-MOGAD is therefore likely multifactorial, reflecting incomplete recovery from the first attack in the context of biological aging processes—such as reduced neuroplasticity and remyelination capacity—as well as age-related factors including frailty and comorbidities. With aging, neuroplasticity and regenerative capacity decline, especially the central nervous system ability to remyelinate after demyelinating attacks.^28,38,39^ Similarly in MS, older age is associated with limited recovery from relapses, and late-onset disease shows faster disability accumulation.^23,40^ Late-onset NMOSD also often shows worse prognosis, characterized by more severe motor disability as well as age-related comorbidities.^9,41^ Their outcomes are particularly poor in patients aged 70 years or older, with longer cord lesions and reduced resilience to relapses contributing to disability accumulation.^22,42^
Limitations
Our study had several limitations. First, missing data were unavoidable due to the retrospective design; however, potential confounding was mitigated through PSM. Second, the shorter disease duration in LO-MOGAD may have underestimated the long-term disease burden. Third, late onset was defined using an arbitrary cutoff of 50 years, although this cutoff has been widely used in MS and NMOSD, and a prior MOGAD study found no difference between patients aged 50 to 59 years and 60 years or older.^12^ Fourth, the retrospective design precluded a detailed assessment of complex regimens, including concomitant corticosteroid use with nonsteroid IS (eg, as bridging therapy); exact overlap durations and dosages could not be quantified. Fifth, baseline frailty and comorbidities, potential confounders of disability outcomes, were not systematically evaluated.
Conclusions
In this cohort study of MOGAD, late onset was associated with a higher risk of moderate disability but was not associated with the risk of relapse, which was mainly attributable to preventive treatment and onset phenotypes. Prospective studies with longer follow-up are warranted to validate these findings and to guide treatment in late-onset patients.
The reference list from the paper itself. Each links out to its DOI / PubMed record.
- 1Brill L, Ganelin-Cohen E, Dabby R, . Age-related clinical presentation of MOG-Ig G seropositivity in Israel. Front Neurol. 2021;11:612304. doi:10.3389/fneur.2020.61230433584514 PMC 7874097 · doi ↗ · pubmed ↗
- 2Hor JY, Fujihara K. Epidemiology of myelin oligodendrocyte glycoprotein antibody-associated disease: a review of prevalence and incidence worldwide. Front Neurol. 2023;14:1260358. doi:10.3389/fneur.2023.126035837789888 PMC 10542411 · doi ↗ · pubmed ↗
- 3Sechi E, Cacciaguerra L, Chen JJ, . Myelin oligodendrocyte glycoprotein antibody-associated disease (MOGAD): a review of clinical and MRI features, diagnosis, and management. Front Neurol. 2022;13:885218. doi:10.3389/fneur.2022.88521835785363 PMC 9247462 · doi ↗ · pubmed ↗
- 4Banwell B, Bennett JL, Marignier R, . Diagnosis of myelin oligodendrocyte glycoprotein antibody-associated disease: international MOGAD panel proposed criteria. Lancet Neurol. 2023;22(3):268-282. doi:10.1016/S 1474-4422(22)00431-836706773 · doi ↗ · pubmed ↗
- 5Jurynczyk M, Messina S, Woodhall MR, . Clinical presentation and prognosis in MOG-antibody disease: a UK study. Brain. 2017;140(12):3128-3138. doi:10.1093/brain/awx 27629136091 · doi ↗ · pubmed ↗
- 6Kaneko K, Sato D, Takahashi T, . Clinical, MRI and laboratory features of myelin oligodendrocyte glycoprotein (MOG)-antibody-associated neurologic disease: a study of 259 cases. Mult Scler J. 2017;23(3)(suppl_3):286. doi:10.1177/1352458517731404 · doi ↗
- 7Knowles S, Middleton R, Cooze B, ; UK MS Register Research Group. Comparing the pathology, clinical, and demographic characteristics of younger and older-onset multiple sclerosis. Ann Neurol. 2024;95(3):471-486. doi:10.1002/ana.2684338061895 · doi ↗ · pubmed ↗
- 8Buscarinu MC, Reniè R, Morena E, . Late-onset MS: disease course and safety-efficacy of DMTS. Front Neurol. 2022;13:829331. doi:10.3389/fneur.2022.82933135356454 PMC 8960027 · doi ↗ · pubmed ↗