Phylogenetic Analysis of Tanypodinae (Chironomidae, Diptera) Infered From Whole Mitochondrial Genomes
Wen‐Bin Liu, Jia‐Xin Nie, Ya‐Ning Tang, Zi‐Ming Shao, Cheng‐Yan Wang, Chun‐Cai Yan

TL;DR
This study uses complete mitochondrial genomes to better understand the evolutionary relationships within the Tanypodinae subfamily of non-biting midges.
Contribution
The study presents the first full mitogenomic sequences for 22 Tanypodinae taxa and provides new phylogenetic insights.
Findings
Tanypodinae mitogenomes show a conserved gene arrangement similar to typical insect patterns.
Phylogenetic analyses confirm the monophyly of Pentaneurini and the sister relationship between Procladiini and Tanypodini.
The study expands the mitogenomic data available for Chironomidae and allied genera.
Abstract
The family Chironomidae, particularly the subfamily Tanypodinae, represents a significant component of freshwater ecosystems. This investigation sought to clarify the evolutionary affinities within Tanypodinae by leveraging whole‐mitochondrial genome data. We generated the inaugural full mitogenomic sequences for 22 Tanypodinae taxa, added the mitochondrial genome sequence of another individual of Thienemannimyia tripunctata, merged these novel records with previously released chironomid mitochondrial genomes, and performed an integrated comparative mitogenomic survey encompassing 55 Tanypodinae species together with nine outgroup representatives from allied genera. The mitogenomes were characterized through de novo assembly, annotation, and comparative analysis. Our results demonstrated that the mitogenomes of Tanypodinae species exhibit a conserved structural organization, with the…
Genes, proteins, chemicals, diseases, species, mutations and cell lines named across the full text — each resolved to its canonical identifier and authoritative record.
Click any figure to enlarge with its caption.
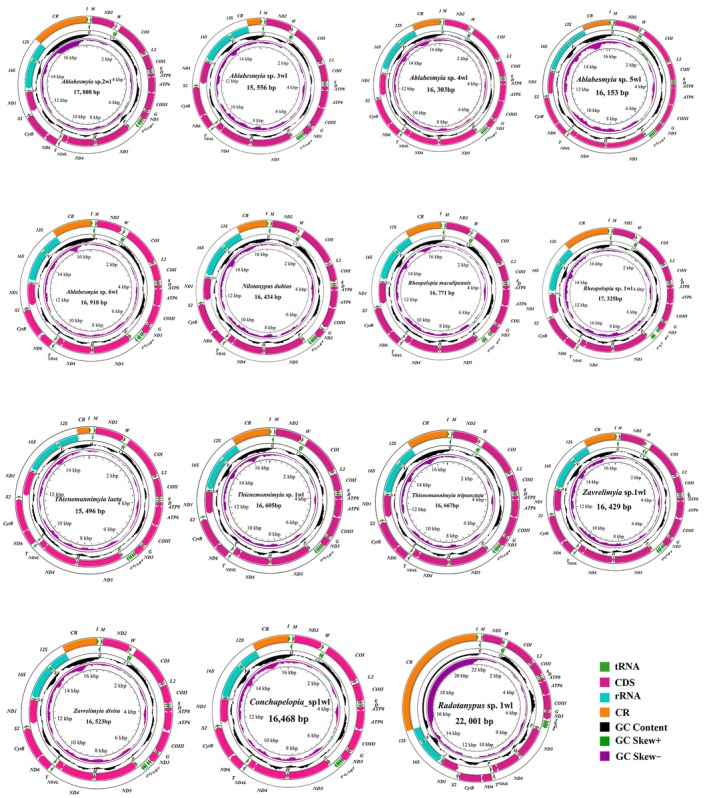 FIGURE 1
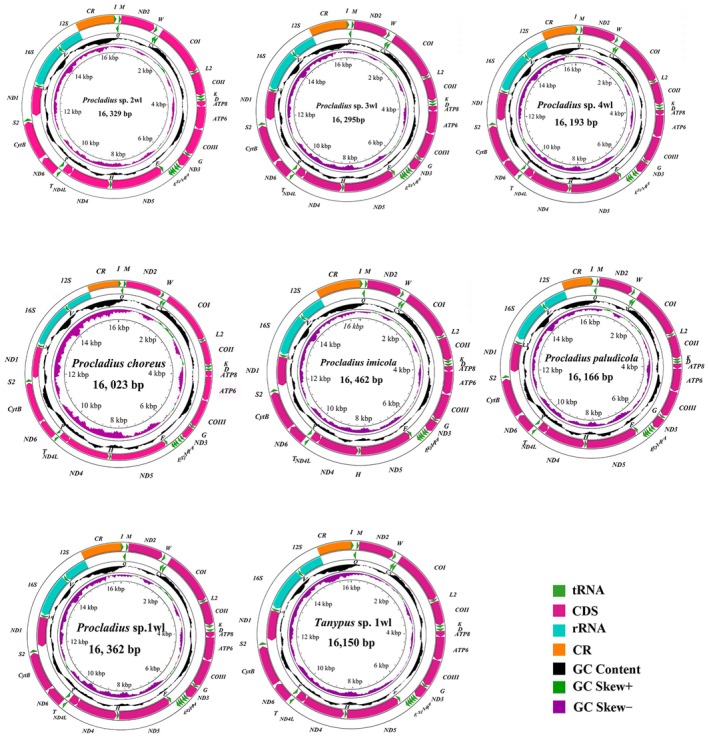 FIGURE 2
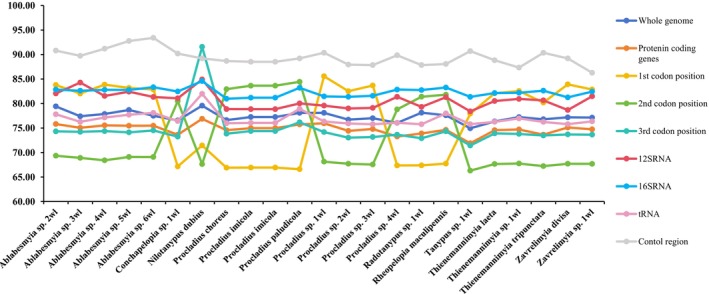 FIGURE 3
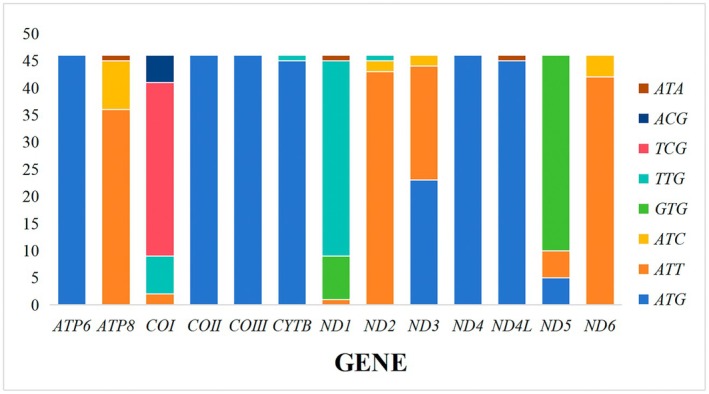 FIGURE 4
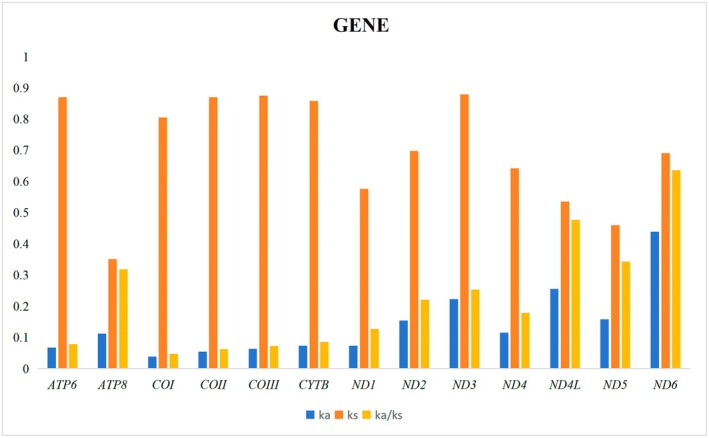 FIGURE 5
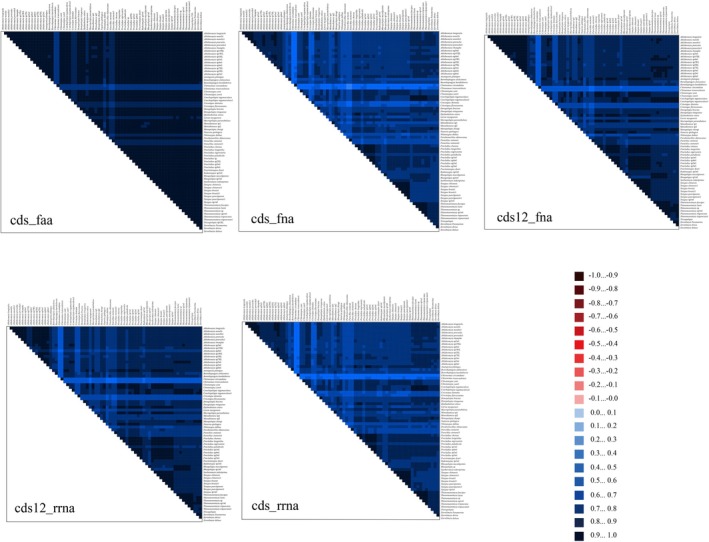 FIGURE 6
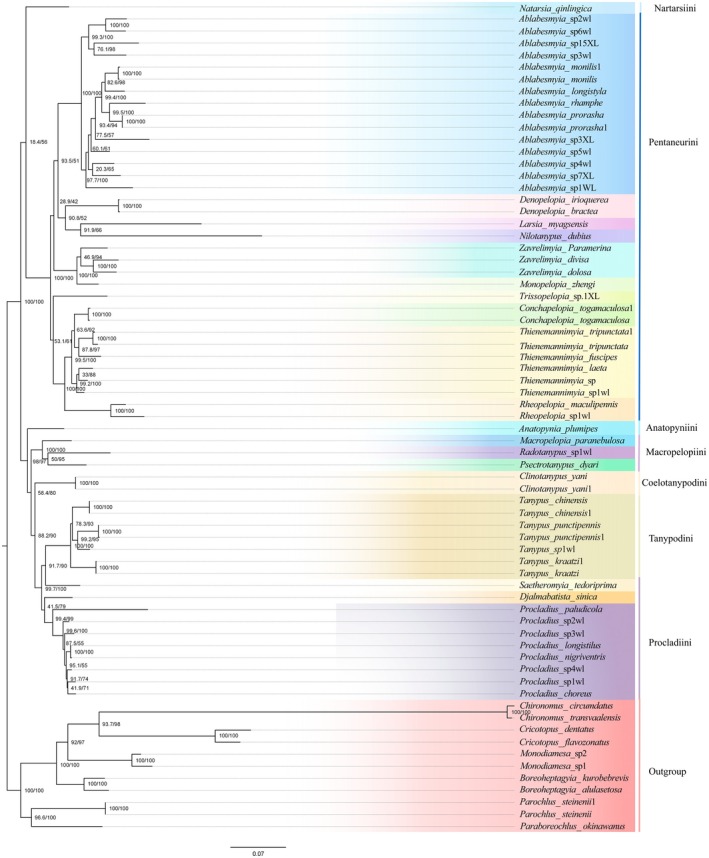 FIGURE 7
| Species | Sample ID | Location | Longitude and latitude | Date | Collector |
|---|---|---|---|---|---|
|
| SHP001 | Huaping National Nature Reserve, Guangxi Zhuang Autonomous Region, China | 109°58′10″ E, 25°39′15″ N | 22 July 2021 | Yao Yuan |
|
| XBZ169 | Xishuangbanna Tropical Botanical Garden, Xishuangbanna Dai Autonomous Prefecture, Yunnan Province, China | 101°25′00″ E, 21°41′00″ N | 19 April 2014 | Wan Qiang |
|
| XBZ168 | Xishuangbanna Tropical Botanical Garden, Xishuangbanna Dai Autonomous Prefecture, Yunnan Province, China | 101°25′00″ E, 21°41′00″ N | 22 April 2014 | Wan Qiang |
|
| TES002 | Qizimei Mountain National Nature Reserve, Xuan'en County, Enshi Tujia and Miao Autonomous Prefecture, Hubei Province, China | 109°38′30″ E, 29°39′30″ N | 9 July 2015 | Sun Bingjiao |
|
| KTS455 | Gutianshan National Nature Reserve, Kaihua County, Quzhou City, Zhejiang Province, China | 118°03′56″ E, 29°10′32″ N | 8 July 2017 | Zhao Guangjun |
|
| 3XB002 | Beichuan Wetland Park, Chengzhong District, Xining City, Qinghai Province, China | 101°49′17″ E, 36°34′03″ N | 12 November 2023 | Gao Xin |
|
| VEH001 | Baoguo Temple, Emeishan City, Leshan City, Sichuan Province, China | 103°44′33.6″ E, 29°33′22.3″ N | 22 July 2015 | Liu Wenbin |
|
| KSJ130 | Shangjie Village, Furong Town, Yueqing City, Zhejiang Province, China | 111°18′57.64″ E, 37°35′40.52″ N | 20 May 2014 | Liu Wenbin |
|
| TES003 | Qizimei Mountain National Nature Reserve, Xuan'en County, Enshi Tujia and Miao Autonomous Prefecture, Hubei Province, China | 109°38′30″ E, 29°39′30″ N | 10 July 2015 | Sun Bingjiao |
|
| SHC002 | Xiaoyun'an Town, Luocheng County, Hechi City, Guangxi Zhuang Autonomous Region, China | 109°04′82″ E, 24°88′24″ N | 11 April 2015 | Liu Wenbin |
|
| YNN001 | Nujiang River, Nagqu City, Tibet Autonomous Region, China | 98°67′19″ E, 27°91′25″ N | 15 June 2023 | Zhao Lin |
|
| 3XB001 | Beichuan Wetland Park, Chengzhong District, Xining City, Qinghai Province, China | 101°49′17″ E, 36°34′03″ N | 12 November 2023 | Gao Xin |
|
| VJZ066 | Jiuzhaigou National Park, Jiuzhaigou County, Ngawa Tibetan and Qiang Autonomous Prefecture, Sichuan Province, China | 103°54′00″ E, 33°12′00″ N | 15 July 2019 | Ge Xinyu |
|
| FBX001 | Benxi City, Liaoning Province, China | 123°90′90″ E, 40°87′32″ N | 24 July 2023 | Song Chao |
|
| YNN002 | Nujiang River, Nagqu City, Tibet Autonomous Region, China | 98°67′19″ E, 27°91′25″ N | 16 June 2023 | Zhao Lin |
|
| KLT191 | Lin'an District, Hangzhou City, Zhejiang Province, China | 118°51′00″ E, 29°56′00″ N | 29 July 2011 | Lin Xiaolong |
|
| LHS001 | Huangshan National Forest Park, Huangshan City, Anhui Province, China | 117°57′00″ E, 30°25′00″ N | 13 May 2015 | Wan Qiang |
|
| WST015 | Songtao Miao Autonomous County, Tongren City, Guizhou Province, China | 109°11′53″ E, 28°9′31″ N | 29 July 2021 | Cao wei |
|
| KTM381 | Tianmu Mountain, Lin'an District, Hangzhou City, Zhejiang Province, China | 119°25′00″ E, 30°20′00″ N | 10 April 2024 | Song Chao |
|
| AFS001 | Qinglong Lake, Fangshan District, Beijing Municipality, China | 116°03′96″ E, 39°77′73″ N | 21 March 2024 | Wang Chengyan |
|
| VJZ067 | Jiuzhaigou National Park, Jiuzhaigou County, Ngawa Tibetan and Qiang Autonomous Prefecture, Sichuan Province, China | 103°54′00″ E,33°12′00″ N | 15 July 2019 | Ge Xinyu |
|
| KNH001 | Fenghua River, Haishu District, Ningbo City, Zhejiang Province, China | 121°40′78″ E, 29°67′12″ N | 14 May 2015 | Qi Xin |
|
| KSJ129 | Shangjie Village, Furong Town, Yueqing City, Zhejiang Province, China | 111°18′58″ E, 37°35′41″ N | 17 July 2011 | Lin Xiaolong |
| Species | GenBank accession | References |
|---|---|---|
|
|
| Liu et al. |
|
|
| Liu et al. |
|
|
| Xiao et al. |
|
|
| Liu et al. |
|
|
| Xiao et al. |
|
|
| Liu et al. |
|
|
| Liu et al. |
|
|
| Liu et al. |
|
|
| This study |
|
|
| This study |
|
|
| Liu et al. |
|
|
| This study |
|
|
| This study |
|
|
| This study |
|
|
| Liu et al. |
|
|
| Lin et al. |
|
|
| This study |
|
|
| Liu et al. |
|
|
| Xiao et al. |
|
|
| Liu et al. |
|
|
| Xiao et al. |
|
|
| Xiao et al. |
|
|
| Xiao et al. |
|
|
| Xiao et al. |
|
|
| Xiao et al. |
|
|
| This study |
|
|
| Xiao et al. |
|
|
| Xiao et al. |
|
|
| This study |
|
|
| This study |
|
|
| This study |
|
|
| This study |
|
|
| This study |
|
|
| This study |
|
|
| This study |
|
|
| This study |
|
|
| This study |
|
|
| This study |
|
|
| Xiao et al. |
|
|
| Xiao et al. |
|
|
| Xiao et al. |
|
|
| Xiao et al. |
|
|
| Xiao et al. |
|
|
| Xiao et al. |
|
|
| Xiao et al. |
|
|
| Xiao et al. |
|
|
| Jiang et al. |
|
|
| This study |
|
|
| This study |
|
|
| Liu et al. |
|
|
| This study |
|
|
| This study |
|
|
| Xiao et al. |
|
|
| This study |
|
|
| This study |
|
|
| Li et al. 2023 |
|
|
| Li et al. 2023 |
|
|
| Lin et al. |
|
|
| Lin et al. |
|
|
| Lin et al. 2021 |
|
|
| Lin et al. 2021 |
|
|
| Li et al. 2022 |
|
|
| Li et al. 2022 |
|
|
| Shin et al. 2023 |
- —National Natural Science Foundation of China10.13039/501100001809
Peer Reviews
No public reviews on file for this paper yet. If you reviewed it on a platform where reviews are public (OpenReview, ICLR, NeurIPS, ICML), you can paste yours below so the community can read it here.
Videos
No videos yet. Explain this paper in a talk, walkthrough, or lecture? Add one.
Taxonomy
TopicsGenomics and Phylogenetic Studies · Freshwater macroinvertebrate diversity and ecology · Environmental DNA in Biodiversity Studies
Introduction
1
Chironomidae, positioned within the Diptera order, stands as the most broadly dispersed and frequently the most abundant insect lineage in freshwater ecosystems, with occurrences further confirmed in terrestrial and marine habitats (Armitage et al. 1995). The remarkable species diversity of this family can be traced back to its ancient origins, relatively low vagility that promotes isolation, and strong evolutionary plasticity (Andersen et al. 2013; Pinder 1989). Many species within the family exhibit short life cycles and high population densities, which have furnished valuable foundational data regarding ecosystem productivity and population dynamics (Bello‐González et al. 2024; Liu et al. 2022).
Tanypodinae, ranking third in species richness among the subfamilies of Chironomidae, is distributed across nearly all continents except Antarctica and encompasses 57 genera assigned to nine currently recognized tribes (Krosch et al. 2021). The diagnostic characteristics of the Tanypodinae include the position of crossvein MCu relative to FCu (either before or beyond it), the specific shape of the tibial spurs, and the inward or forward orientation of the gonostyles (Murray and Fittkau 1989). The majority of Tanypodinae larvae are generally considered carnivorous and are primarily found in various lotic and lentic water habitats, as well as occasionally in moist semi‐terrestrial environments; however, most species tend to prefer standing water or slow‐flowing river sections, showing an adaptation to warmer waters that is reflected in their global distribution, with their diversity decreasing in higher altitudes or cooler regions (Andersen et al. 2013; Ashe et al. 1987).
While phylogenetic analyses that integrate both morphological and molecular data consistently support the monophyly of Tanypodinae, the relationships within the subfamily have been found to be inconsistent and with variable levels of support (Cranston et al. 2012; Gao et al. 2024; Krosch et al. 2017, 2021; Sæther 1977; Silva and Ekrem 2016). Within the subfamily Tanypodinae, there are two major lineages: the Pentaneurini Hennig, 1950, which includes most species, and a group of eight tribes, among which Procladiini and Tanypodini are sister taxa forming terminal lineages that may even need to be merged into a single tribe (Krosch et al. 2017, 2021; Xiao et al. 2025). The placement of these three tribes within the subfamily Tanypodinae and their inter‐relationships warrant further investigation.
Insect mitochondrial genomes serve as powerful molecular markers for Diptera identification and phylogenetic reconstruction owing to their characteristics: they are compact, maternally transmitted, and structurally stable, and they exhibit rare recombination and accelerated evolutionary rates. Chironomidae research is a prime beneficiary of these attributes (Cameron 2014; Liu et al. 2025, 2024; Song et al. 2019; Xiao et al. 2025). This study reports the first complete mitogenomes for 22 Tanypodinae species, and the mitochondrial genome sequence of another individual of Thienemannimyia tripunctata has been added, enhancing Chironomidae's mitogenomic resources. To extend the scope of our investigation, an additional 23 publicly available mitogenomes were integrated into the dataset, allowing an in‐depth characterization of these mitochondrial genomes. Leveraging diverse sequence repositories, we inferred the phylogenetic affinities among genera within the subfamily Tanypodinae by implementing both Bayesian Inference (BI) and Maximum Likelihood (ML) frameworks, ensuring analytical robustness and scientific rigor. Our research has confirmed the monophyly of tribe Pentaneurini, and that tribes Procladiini and Tanypodini are sister clades.
Materials and Methods
2
Specimen Acquisition and Sequencing
2.1
This study reports the first analysis included five species of Ablabesmyia, seven species of Procladius, one species of Radotanypus, nine species of Pentaneurini tribe, and one species of Tanypus. All specimens were collected exclusively within China. Permission was obtained for the collection of all insect specimens used in this study. Sample collection was conducted in accordance with the Wildlife Protection Law of the People's Republic of China and was approved by the following national nature reserves: Huaping in Guangxi, Qizimeishan in Xuanen County of Hubei, Gutianshan in Kaihua County of Zhejiang, and Jiuzhaigou in Sichuan. The work was carried out with permission from the National Nature Reserves Administration of China. All sampling activities were also authorized under a broader scientific collection permit issued by the National Forestry and Grassland Administration of China, which supports university‐led scientific surveys within protected areas across the country. Comprehensive specimen details are provided in Table 1.
A total of 64 species were analyzed. The ingroup encompassed 55 species: 32 with complete mitochondrial genomes downloaded from GenBank, plus 23 whose mitogenomes are presented here de novo, and the newly added mitochondrial genome of Thienemannimyia tripunctata (Jiang et al. 2022; Lin et al. 2022; Xiao et al. 2025; Liu et al. 2025). The outgroup consisted of nine species whose mitogenomic data were also obtained from GenBank (Lin et al. 2022). All were drawn from closely allied genera. Further particulars are provided in Table 2.
Prior to genomic DNA isolation and morphological inspection, every specimen was immersed in 85%–95% ethanol and maintained at −20°C to ensure structural and molecular integrity.
Assembly, Annotation, and Composition Analyses
2.2
Mitogenomes assembly was performed de novo using NOVOPlasty v3.8.3 (Dierckxsens et al. 2017), with the COI barcode sequence serving as the initial seed. To enhance assembly optimization, we systematically evaluated multiple k‐mer lengths spanning 23–39 bp, employing a comparative approach to refine the mitogenome assembly parameters (Dierckxsens et al. 2017). Mitochondrial genome annotation followed the protocol described by Zheng et al. (2020) with modifications. Specifically, tRNA secondary structures were determined using the MITOS WebServer, whereas rRNAs and protein‐coding genes (PCGs) were manually annotated in Geneious. Sequence alignments were performed using the Clustal Omega algorithm (Kumar et al. 2016). The boundaries between PCGs and rRNAs were subsequently manually verified through alignment with reference sequences. Moreover, the synonymous (Ks) and non‐synonymous substitution rates (Ka) of PCGs were computed using DnaSP v6.0 (Rozas et al. 2017). The processed PCGs file was imported into the software, and the “mtDNA Drosophila” genetic code was selected for subsequent analysis. MEGA X was utilized to quantify relative synonymous codon usage, nucleotide constitution, and codon preferences across the mitogenomes. Compositional asymmetry and gene‐wise patterns were evaluated with SeqKit v0.16.0, a bioinformatics utility developed in Chongqing, China (Shen et al. 2016). Circular genome diagrams were rendered via the CGView Server (https://cgview.ca/; accessed 8 May 2025) (Rozas et al. 2017). Strand‐specific nucleotide biases were assessed by computing AT‐skew [(A − T)/(A + T)] and GC‐skew [(G − C)/(G + C)], thereby illuminating the evolutionary dynamics of the mitogenome.
Phylogenetic Analyses
2.3
To resolve phylogenetic affinities, we assembled a dataset comprising two ribosomal RNA (rRNA) loci and 13 PCGs retrieved from 50 complete mitochondrial genomes (Table 2). Both nucleotide and corresponding amino‐acid sequences were aligned with MAFFT v7.470 employing the L‐INS‐I strategy to ensure high fidelity (Katoh and Standley 2013). Handling of DNA Indels chose 5th state. Subsequent sequence trimming was executed with Trimal v1.4.1 (Barcelona, Spain) to prepare the aligned datasets for downstream phylogenetic analyses. This investigation relied on five discrete data partitions generated by FASconCAT‐G v1.04, each tailored as follows: (1) cds_fna, containing every codon position of the 13 PCGs; (2) cds12_rna, merging the first and second codon sites of the 13 PCGs with the two rRNA loci; (3) cds_rna, uniting all codon positions of the 13 PCGs and the two rRNA loci; (4) cds_faa, employing the deduced amino‐acid sequences of the 13 PCGs; and (5) cds12, restricted to the first and second codon sites of the 13 PCGs. To gauge between‐matrix heterogeneity, we utilized AliGROOVE v1.06 (Bonn, Germany), adopting the conceptual framework established in investigations (Capella‐Gutiérrez et al. 2009; Katoh and Standley 2013; Kück et al. 2014; Tamura et al. 2021). Amino Acid Substitution Matrix chose BLOSUM26. For ML analysis, best‐fit substitution models were implemented across individual gene partitions. Bootstrap resampling and node confidence assessment were executed with 1000 replicates to evaluate statistical reliability. Subsequent phylogenetic reconstruction employed IQ‐TREE v2.2.0.8 for ML tree inference and Phylobayes‐MPI v1.9 for Bayesian analysis, collectively providing comprehensive insights into the evolutionary dynamics among the examined mitochondrial genomes (Hoang et al. 2018; Kalyaanamoorthy et al. 2017; Lartillot et al. 2013; Minh et al. 2020).
Results and Interpretation
3
Mitogenomic Organization
3.1
The freshly obtained sequences spanned 15,496 base pairs in Thienemannimyia laeta to 22,001 bp in Radotanypus sp. 1wl. This variability chiefly stems from the variable length of the CR, which measures 421 bp in Thienemannimyia laeta and expands to 6623 bp in Radotanypus sp. 1wl (Table S1). All de novo mitogenome assemblies conform to the canonical architecture, comprising one CR and 37 genes—specifically 13 PCGs, 22 tRNAs, and 2 rRNAs—as depicted in Figures 1 and 2. The majority of assemblies align closely in size with previously documented Chironomidae mitogenomes. The salient sequence attributes of the examined taxa are graphically consolidated in Figures 1 and 2.
The mitochondrial genome map of diverse representative species across 15 species of Tanypodinae is presented, emphasizing their unique genomic features. PCGs and rRNAs are annotated with canonical abbreviations, whereas transfer RNAs (tRNAs) are abbreviated to single‐letter symbols to preserve clarity. An additional concentric ring depicts the mitogenome‐wide GC content, elucidating global trends in nucleotide composition. A subsequent ring presents GC‐skew indices, thereby extending the evaluation of strand‐specific base imbalance. The centermost ring reports the aggregate mitogenome length, integrating pivotal architectural metrics into a cohesive graphical summary.
The mitochondrial genome map of diverse representative species across eight species of Tanypodinae is presented, emphasizing their unique genomic features. Detailed interpretation of the mitochondrial circular map refers specifically to the annotations provided in Figure 1.
The nucleotide patterns of the recently assembled mitogenomes exhibited uniform trends across the analyzed specimens, as outlined in Table S1, mirroring the typical AT‐enriched inclination prevalent in Chironomidae and other insect lineages. Notable disparity emerged in the AT proportion of the mitochondrial genomes, spanning from 74.95% in Tanypus sp. 1wl to 79.57% in Nilotanypus dubius (Figure 3 and Table S1).
Difference in AT composition of the protein‐coding genes within Tanypodinae mitogenomes.
Strikingly, the CR exhibited the most pronounced AT enrichment, spanning 76.65% in Conchapelopia togamaculosa to 93.41% in Ablabesmyia sp. 3wl. By contrast, the AT proportion in tRNAs and PCGs was markedly lower than that observed in rRNAs (Table S1). All freshly reconstructed mitogenomes exhibited a negative GC‐skew, indicating a surplus of cytosine, whereas most displayed a positive AT‐skew, evidencing the predominance of adenine and thymine. GC‐skew spanned from −0.34 in Radotanypus sp. 1wl to −0.120 in Procladius sp. 1wl. AT‐skew varied between 0 in Ablabesmyia sp. 6wl and 0.05 in Rheopelopia maculipennis, with a single outlier Radotanypus sp. 1wl—showing an AT‐skew of −0.04. GC content itself fluctuated from 20.34% in Ablabesmyia sp. 2wl to 25.05% in Tanypus sp. 1wl, furnishing further insight into the nucleotide landscape of these mitogenomes (Table S1).
Protein‐Coding Genes, Codon Usage, and Evolutionary Rates
3.2
Conservation of gene length was observed across tRNA, PCGs, and rRNA in all examined species. Specifically, the cumulative length of the 13 PCGs in newly sequenced mitogenomes displayed minimal variation (11,210–11,239 bp). Comparative analysis with existing Chironomidae datasets revealed distinct codon position biases in the Pentaneurini tribe: Ablabesmyia and Thienemannimyia exhibited significantly elevated AT content at first codon positions relative to second and third positions in PCGs. In Conchapelopia and Rheopelopia, the AT proportion at the second codon sites of PCGs markedly exceeds that at the first and third sites. Nilotanypus dubius exhibits an opposite trend, with the third codon sites of PCGs displaying the highest AT proportion relative to the first and second sites. Within the Procladiini tribe, Procladius sp. 1wl, Procladius sp. 2wl, and Procladius sp. 3wl show elevated AT proportions at the first codon sites of PCGs, whereas the remaining taxa exhibit a pronounced increase at the second codon sites. Within the Tanypodini tribe, first codon positions in PCGs exhibited predominant AT content relative to second and third positions. Conversely, second codon positions demonstrated elevated AT content compared to first and third positions in the Macropelopiini tribe.
Strikingly, across the complete set of 55 mitogenomes, the majority exhibited a negative GC skew at the whole genome scale. Moreover, a negative AT skew was observed within the PCGs, spanning from −0.19 in Ablabesmyia longistyla to −0.17 in Nilotanypus dubius. The AT proportion fluctuated between 71.89% in Tanypus sp. 1wl and 76.88% in Nilotanypus dubius, whereas the GC content ranged from 23.12% in Nilotanypus dubius to 28.11% in Tanypus sp. 1wl (consult Table 2 for comprehensive details).
13 PCGs of all species in the analyzed mitogenomes predominantly employed the canonical ATN start codon, consistent with typical insect mitochondrial initiation patterns. However, non‐canonical start codons were identified in specific genes. Most notably, the COI gene initiated with TCG in 32 species, TTG in 7 species, ACG in 5 species, and ATT in 2 species. The ATP8 gene began with ATT in 36 species and ATC in nine species, while the ATP6 gene started with ATG in all species. The ND1 gene utilized TTG as its start codon in 36 species, GTG in eight species, and ATT in one species. Similarly, the ND2 gene started with ATT in 43 species, ATC in two species, and TTG in one species; the ND3 gene began with ATT in 21 species, ATG in 23 species, and ATC in 2 species. Furthermore, the COII, COIII, and ND4 genes consistently started with ATG, the CYTB and ND4L genes with ATG in 45 species. The ND5 gene started with GTG in 36 species, ATT in 5 species, and ATG in 5 species, while the ND6 gene exclusively began with ATT in 42 species and ATC in four species (Figure 4).
Start codons of protein‐coding genes among Tanypodinae mitogenomes.
Regarding termination codons, the predominant signal among the 13 PCGs was TAA. Deviations include COI and COII, which predominantly terminate with a solitary thymine (T) as an incomplete stop; ND5, exhibiting 29 instances of T and 32 of TAA; ND6, presenting two T and one TAG; ND1, characterized by seven TAG; and ND3, marked by four TAG codons.
The Ka/Ks ratio (ω), a well‐established indicator of sequence evolutionary tempo under selective pressure, remained uniformly below unity across all 13 PCGs. This pattern aligns closely with observations in other insect lineages, with a range spanning from 0.043 for COI to 0.891 for ND2 (Figure 4). These PCGs can be ranked according to their evolutionary rates as follows: ND2 > ATP8 > ND6 > ND5 > ND4 > ND4L > ND3 > ATP6 > ND1 > CYTB > COIII > COII > COI. Our results notably highlight that a substantial proportion of these genes have undergone evolutionary refinement under purifying selection, which functions to eliminate deleterious mutations and is modulated by heterogeneous selective forces. Notably, the diminished ω ratios observed in COII and COI genes signify a stringent selective environment, indicating the presence of robust evolutionary constraints. Conversely, the elevated ω values detected in ND2, ATP8, and ND6 suggest comparatively relaxed purifying selection pressures, implying that these genetic elements may experience greater evolutionary latitude (Figure 5). These insights substantially enhance our grasp of the selective forces operating on these PCGs and highlight the central influence of natural selection in directing their patterns of sequence divergence.
Evolutionary tempo of the 13 PCGs across Tanypodinae mitogenomes. The x‐axis enumerates the 13 PCGs, while the y‐axis indicates the Ka/Ks ratios.
The 55 mitochondrial tRNAs displayed pronounced length heterogeneity, spanning 1474–2153 base pairs (bp). Their AT fraction also diverged markedly, ranging from 75.71% in Clinotanypus yani to 81.99% in Nilotanypus dubius. Remarkably, nine tRNAs exhibited a negative AT‐skew, varying from −0.05 to −0.01. Conversely, GC content fluctuated between 18.01% in Nilotanypus dubius and 24.30% in Clinotanypus yani. Moreover, GC‐skew revealed substantial variability, extending from 0.12 in Procladius paludicola to 0.28 in Thienemannimyia tripunctata. Collectively, these findings underscore extensive nucleotide compositional and skew divergence across mitochondrial tRNAs within the examined taxa.
The rRNA segments displayed pronounced length heterogeneity, spanning 2136 bp in Ablabesmyia sp. 4wl to 2212 bp in Nilotanypus dubius. AT fractions remained uniformly elevated across all mitogenomes, fluctuating between 76.25% and 84.72%, while GC levels mirrored this variability, ranging from 15.28% to 23.74%. Although the majority of mitogenomes exhibited a negative AT‐skew between −0.10 and −0.01, Thienemannimyia tripunctata presented an AT‐skew of 0. A comprehensive compilation of these metrics is provided in Table S1.
Phylogenetic Relationships
3.3
The examination of sequence divergence patterns elucidates the degree of mitochondrial gene sequence conservation across multiple taxa. Notably, due to the degeneracy of the genetic code, the amino acid (AA) dataset demonstrated minimal sequence divergence, whereas the combined coding and ribosomal RNA (cds12_rrna) dataset exhibited relatively elevated divergence levels (Figure 6). This observation suggests that the third codon positions in PCGs accumulate mutations more rapidly compared to the first and second positions. Consequently, third codon positions are deemed unreliable for reconstructing phylogenetic relationships within the four tribes. Furthermore, sequence divergence in the outgroup Chironomus species was markedly less than that observed in the ingroup taxa.
Genomic divergence across 55 Tanypodinae species was evaluated by examining their PCGs, amino‐acid sequences, and rRNAs. Homology patterns were visualized through color‐graded tiles calculated from AliGROOVE scores, extending from −1 (crimson, indicating pronounced divergence) to +1 (azure, denoting strong conservation). Within each tile, paler tones correspond to heightened sequence disparity, whereas deeper shades reflect diminished variability.
Phylogenetic inference, performed with BI and ML across the 10 datasets, consistently yielded concordant tree architectures, yet disparities appeared in branching configurations and nodal support indices (Figure 7 and Figures S1–S8). Phylogenetic inference resolves the 50 Tanypodinae species into seven discrete lineages that correspond precisely to the seven recognized tribes: Pentaneurini, Procladiini, Tanypodini, Coelotanypodini, Nartarsiini, Anatopynini, and Macropelopiini, following Silva and Ekrem (2016), Krosch et al. (2017, 2021) and Xiao et al. (2025).
Phylogenetic ML tree of the genus Tanypondinae, based on analysis PCG12_rRNA in partition.
The mitochondrial phylogenomic analysis strongly supports the monophyly of Pentaneurini and its sister‐group relationship to (Coelotanypodini + (Macropelopiini + (Tanypodini + Procladiini))), aligning with prior studies (Xiao et al. 2025). The Tanypodini‐Procladiini sister relationship is also strongly supported, echoing Silva and Ekrem's (2016) morphological findings. Within Pentaneurini, the monophyly of Ablabesmyia is confirmed (Liu et al. 2025), and the topology shows (Ablabesmyia + Nilotanypus) as sister to (Rheopelopia + (Thienemannimyia + Conchapelopia) + (Zarelimyia + Denopelopia)), which mirrors the global dataset analysis of Tanypodinae using COI, 28S, and CAD, bolstering confidence in future genomic phylogenetic research (Krosch et al. 2017, 2021). This discovery elucidates key evolutionary dynamics within Tanypodinae, underscoring the imperative for expanded taxonomic sampling to resolve the subfamily's intricate phylogenetic relationships.
In the study by Silva, Anatopyniini and the clade comprising Fittkauimyiini + Macropelopiini were recovered as sister groups. However, due to the absence of Fittkauimyiini samples in our dataset, our study could only confirm the sister‐group relationship between Anatopyniini and Macropelopiini. Notably, both our study and Silva consistently support the monophyly of Nartarsiini, identifying it as a distinct lineage that forms a sister group with Pentaneurinir (Table S2).
Conclusions
4
This study presents the first fully annotated and assembled mitochondrial genomes for twenty‐three species spanning all five tribes of the subfamily Tanypodinae (Diptera: Chironomidae). These novel mitogenomes exhibit conserved architectural characteristics and base composition consistent with existing records for Chironomidae, substantially enlarging the available genomic resources for this family.
Despite pronounced morphological differentiation across larval, pupal, and adult life stages within Chironomidae, phylogenetic hypotheses inferred from morphology, limited gene markers, and complete mitogenomes frequently demonstrate significant incongruence. Molecular analyses, however, continue to affirm the enduring relevance of detailed morphological examination in chironomid systematics. While comprehensive mitogenomic datasets offer considerable potential for resolving evolutionary relationships, their interpretation necessitates critical evaluation. A robust phylogenetic framework must therefore synthesize developmental morphology, biogeography, and life‐history traits with genomic evidence to elucidate the group's intrinsic evolutionary pathways.
Author Contributions
Wen‐Bin Liu: conceptualization (equal), resources (equal), software (equal), writing – original draft (equal). Jia‐Xin Nie: formal analysis (equal), methodology (equal), validation (equal). Ya‐Ning Tang: data curation (equal), investigation (equal), software (equal). Zi‐Ming Shao: data curation (equal), formal analysis (equal), resources (equal). Cheng‐Yan Wang: data curation (equal), resources (equal), visualization (equal). Chun‐Cai Yan: project administration (equal), supervision (equal), writing – review and editing (equal).
Conflicts of Interest
The authors declare no conflicts of interest.
Supporting information
Figure S1: Phylogenetic BI tree of the genus Tanypondinae, based on PCG_faa. Figure S2: Phylogenetic ML tree of the genus Tanypondinae, based on PCG_faa in partition. Figure S3: Phylogenetic ML tree of the genus Tanypondinae, based on PCG_fna in partition. Figure S4: Phylogenetic BI tree of the genus Tanypondinae, based on PCG_rRNA. Figure S5: Phylogenetic ML tree of the genus Tanypondinae, based on PCG_rRNA in partition. Figure S6: Phylogenetic BI tree of the genus Tanypondinae, based on PCG_12rRNA. Figure S7: Phylogenetic BI tree of the genus Tanypondinae, based on PCG_12rRNA. Figure S8: Phylogenetic ML tree of the genus Tanypondinae, based on PCG_12fna in partition. Table S1: Nucleotide composition of 38 mitogenomes.
The reference list from the paper itself. Each links out to its DOI / PubMed record.
- 1Andersen, T. , T. Ekrem , and P. Cranston . 2013. “The Larvae of the Holarctic Chironomidae (Diptera)—Introduction.” Chironomidae of the Holarctic Region: Keys and Diagnoses, Part 1.
- 2Armitage, P. , P. S. Cranston , and L. C. V. Pinder . 1995. The Chironomidae. Biology and Ecology of Non‐Biting Midges. Chapman & Hall. 10.1017/S 0007485300036245. · doi ↗
- 3Ashe, P. , D. A. Murray , and F. Reiss . 1987. “The Zoogeographical Distribution of Chironomidae (Insecta: Diptera).” Annales de Limnologie 23: 27–60.
- 4Bello‐González, O. C. , T. Andersen , and N. Mercado‐Silva . 2024. “A Revised, Annotated Checklist of Mexican Non‐Biting Midges (Diptera, Chironomidae).” Zoo Keys 1191: 237–286. 10.3897/zookeys.1191.117223.38389584 PMC 10882552 · doi ↗ · pubmed ↗
- 5Cameron, S. L. 2014. “Insect Mitochondrial Genomics: Implications for Evolution and Phylogeny.” Annual Review of Entomology 59, no. 1: 95–117. 10.1146/annurev-ento-011613-162007.24160435 · doi ↗ · pubmed ↗
- 6Capella‐Gutiérrez, S. , J. M. Silla‐Martínez , and T. Gabaldón . 2009. “Trimal: A Tool for Automated Alignment Trimming in Large‐Scale Phylogenetic Analyses.” Bioinformatics 25, no. 15: 1972–1973. 10.1093/bioinformatics/btp 348.19505945 PMC 2712344 · doi ↗ · pubmed ↗
- 7Cranston, P. S. , N. B. Hardy , and G. E. Morse . 2012. “A Dated Molecular Phylogeny for the Chironomidae (Diptera).” Systematic Entomology 37, no. 1: 172–188. 10.1111/j.1365-3113.2011.00603.x. · doi ↗
- 8Dierckxsens, N. , P. Mardulyn , and G. Smits . 2017. “Novoplasty: De Novo Assembly of Organelle Genomes From Whole Genome Data.” Nucleic Acids Research 45, no. 4: e 18. 10.1093/nar/gkw 955.28204566 PMC 5389512 · doi ↗ · pubmed ↗