The Association of Peak Glycemia and No‐Reflow Phenomenon in Patients Undergoing Primary Percutaneous Coronary Intervention
Golrokh Ghaffari, Maryam Mehrpooya, Mohsen Faghihinia, Elnaz Shahmohamadi, Farnoosh Larti, Babak Geraiely

TL;DR
High blood sugar levels are strongly linked to poor heart artery reflow in heart attack patients undergoing a specific treatment.
Contribution
This study identifies peak glycemia above 180 mg/dL as an independent risk factor for no-reflow in STEMI patients.
Findings
42.4% of STEMI patients experienced no-reflow after PPCI.
Peak glycemia above 180 mg/dL independently increased no-reflow odds by 8.16 times.
No-reflow was also associated with diabetes, smoking, and high LDL cholesterol.
Abstract
This study investigates the effect of peak glycemia on the no‐reflow phenomenon in patients with ST‐elevation myocardial infarction (STEMI) undergoing primary percutaneous coronary intervention (PPCI) to examine the relationship between elevated blood glucose (BG) levels and no‐reflow. A total of 252 STEMI patients (81.7% male) who underwent PPCI were enrolled. BG was measured by a glucometer every 6 h for 24 h, starting at the time of patient admission. The maximum measured BG was considered the peak glycemic level. A corrected TIMI frame count (CTFC) of less than 27 was used to define the no‐reflow phenomenon in this study. 42.4% of participants experienced no flow, with a significant association between this condition and diabetes mellitus, peak glycemia, smoking history, and elevated LDL cholesterol levels. Specifically, peak glycemia levels above 180 mg/dL independently increased…
Genes, proteins, chemicals, diseases, species, mutations and cell lines named across the full text — each resolved to its canonical identifier and authoritative record.
Click any figure to enlarge with its caption.
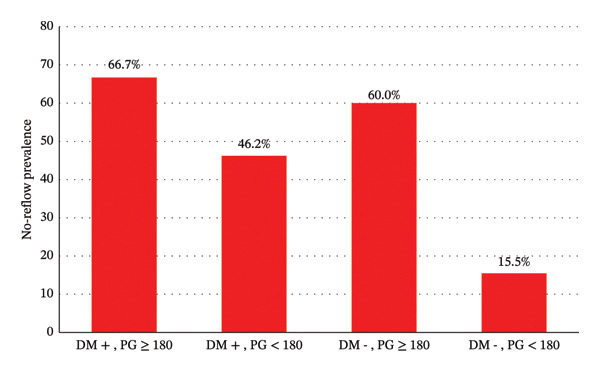 FIGURE 1
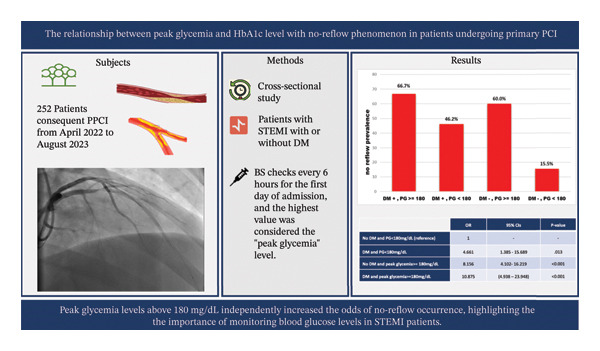 FIGURE 2
|
|
|
| |
|---|---|---|---|
|
| |||
| Age | 60.3 ± 10.9 | 60.4 ± 10.3 | 0.925 |
| Gender | |||
| Male | 120 (82.76%) | 86 (80.37%) | 0.628 |
| Height (cm) | 171.7 ± 6.0 | 171.8 ± 6.7 | 0.839 |
| Weight (kg) | 74.9 ± 7.2 | 76.0 ± 7.5 | 0.246 |
| Body surface area (m2) | 1.87 ± 0.11 | 1.89 ± 0.12 | 0.392 |
| Body mass index (kg/m2) | 25.4 ± 1.8 | 25.7 ± 1.7 | 0.159 |
| Systolic blood pressure (mmHg) | 128.4 ± 7.2 | 127.8 ± 7.5 | 0.495 |
| Diastolic blood pressure (mmHg) | 79.5 ± 5.5 | 79.4 ± 5.6 | 0.842 |
| Heart rate (beat per minute) | 82.2 ± 5.7 | 82.0 ± 5.4 | 0.700 |
| Family history of coronary artery disease | 12 (8.28%) | 6 (5.6%) | 0.416 |
| Cigarette | 44 (30.34%) | 59 (55.14%) | 0.001 |
| Alcohol | 2 | 2 | 0.758 |
| Diabetes | 24 (16.55%) | 40 (37.38%) | 0.001 |
| Hypertension | 74 (51.0%) | 66 (61.7%) | 0.093 |
| Hyperlipidemia | 47 (32.41%) | 60 (56.07%) | 0.001 |
| Hx of known coronary artery disease | 12 (8.28%) | 29 (27.10%) | 0.001 |
| Hx of cerebral vascular accident | 4 (2.8%) | 3 (2.8%) | 0.983 |
| Hx of chronic kidney disease | 6 (4.1%) | 3 (2.8%) | 0.573 |
| Hx of obstructive sleep apnea | 0 | 1 | 0.243 |
| Peripheral artery disease | 1 | 2 | 0.393 |
| Drug Hx | |||
| ASA | 10 (6.9) | 32 (29.9) | 0.001 |
| Clopidogrel | 10 (4.8) | 2 (1.9) | 0.211 |
| ACEi/ARB | 32 (22.1) | 19 (17.8) | 0.400 |
| Aldactone | 6 (6.2) | 3 (2.8) | 0.573 |
| B‐blocker | 9 (6.2) | 12 (11.2) | 0.155 |
| Statin | 20 (13.8) | 19 (17.8) | 0.390 |
| Diuretic | 10 (6.9) | 9 (8.4) | 0.653 |
| Oral antidiabetes | 28 (19.3) | 42 (39.3) | 0.001 |
| Insulin | 6 (4.1) | 11 (10.3) | 0.055 |
| Lab data | |||
| Peak glycemia (mg/dL) | 179.4 | 220.6 | 0.001 |
| HbA1c | 5.6 ± 0.8 | 6.2 ± 1.6 | 0.001 |
| CRP (mg/dL) | 10.3 ± 23.3 | 16.2 ± 32.0 | 0.088 |
| Uric acid (mg/dL) | 4.1 ± 1.3 | 4.5 ± 1.3 | 0.031 |
| WBC (103/mm3) | 10.4 ± 2.7 | 9.9 ± 3.2 | 0.217 |
| HB (g/dL) | 13.3 ± 1.7 | 13.5 ± 1.7 | 0.382 |
| PLT (103/mm3) | 199.5 ± 71.4 | 199.1 ± 45.8 | 0.961 |
| AST (U/L) | 58.0 ± 121.8 | 84.0 ± 123.6 | 0.097 |
| ALT(U/L) | 37.2 ± 72.4 | 40.8 ± 72.4 | 0.630 |
| ALP(U/L) | 184.3 ± 37.8 | 191.6 ± 57.9 | 0.226 |
| Urea (mg/dL) | 32.4 ± 17.6 | 35.3 ± 21.8 | 0.245 |
| Cr (mg/dL) | 1.0 ± 0.3 | 1.0 ± 0.2 | 0.324 |
| LDL | 95.4 ± 13.5 | 104.4 ± 22.6 | 0.001 |
| HDL | 38.4 ± 7.6 | 40.5 ± 7.4 | 0.026 |
| TG | 103.6 ± 21.4 | 103.6 ± 19.7 | 0.978 |
| Chol | 159.9 ± 22.8 | 163.6 ± 21.3 | 0.192 |
| PT(s) | 13.0 ± 1.5 | 13.0 ± 1.7 | 0.941 |
| INR | 1.1 ± 0.2 | 1.1 ± 0.3 | 0.988 |
| PTT (s) | 30.6 ± 11.4 | 31.2 ± 17.9 | 0.773 |
|
|
|
| ||
| LVEF | 40.8 | 37.29 | 0.004 | |
| LV systolic dysfunction | Normal and preserved function | 20 (13.8) | 7 (6.5) | 0.040 |
| Mild | 61 (42.1) | 37 (34.6) | ||
| Moderate | 52 (35.9) | 45 (42.1) | ||
| Severe | 12 (8.3) | 18 (16.8) | ||
| LV enlargement | Mild | 2 | 4 | 0.726 |
| Moderate | 1 | 0 | ||
| Severe | 1 | 0 | ||
| LVH | Mild | 14 | 10 | 0.271 |
| Moderate | 0 | 4 | ||
| Severe | 1 | 2 | ||
| RV dysfunction | Mild and moderate | 4 (2.8) | 15 (14.0) | 0.001 |
| RV enlargement | Mild and Moderate | 0 (0) | 6 (5.6) | 0.005 |
| sPAP (mmHg) | 26.5 ± 3.4 | 26.7 ± 3.8 | 0.713 | |
| MR (mild, moderate) | 135 | 93 | 0.180 | |
| TR (mild, moderate) | 113 | 90 | 0.470 | |
|
|
|
| |
| Number of narrowed vessels | 0.001 | ||
| Single vessel disease | 81 (55.9) | 39 (36.4) | |
| Two vessel disease | 37 (25.5) | 27 (25.2) | |
| Three vessel disease/left main disease | 26 (18.6) | 39 (38.3) | |
| Culprit lesion | 0.003 | ||
| LAD | 53 (36.6) | 61 (57.0) | |
| LCx | 24 (16.6) | 8 (7.5) | |
| RCA | 68 (46.8) | 38 (35.5) | |
| CFTC | 20.6 ± 5.4 (8–26) | 43.4 ± 12.5 (28–66) | 0.001 |
| SYNTAX | 15.7 ± 8.3 | 23.7 ± 9.9 | 0.001 |
| OR | 95% CIs |
| |
|---|---|---|---|
| No DM and PG < 180 mg/dL (reference) | 1 | — | — |
| DM and PG < 180 mg/dL | 4.661 | 1.385–15.689 | 0.013 |
| No DM and peak glycemia ≥ 180 mg/dL | 8.156 | 4.102–16.219 | < 0.001 |
| DM and peak glycemia ≥ 180 mg/dL | 10.875 | 4.938–23.948 | < 0.001 |
Peer Reviews
No public reviews on file for this paper yet. If you reviewed it on a platform where reviews are public (OpenReview, ICLR, NeurIPS, ICML), you can paste yours below so the community can read it here.
Videos
No videos yet. Explain this paper in a talk, walkthrough, or lecture? Add one.
Taxonomy
TopicsHyperglycemia and glycemic control in critically ill and hospitalized patients · Acute Myocardial Infarction Research · Diabetes Management and Research
1. Introduction
The collaborative effort of a specialized team, involving timely ST‐elevation myocardial infarction (STEMI) management, aims to restore full antegrade blood flow to the infarct‐related artery (IRA), ideally achieving a Thrombolysis in Myocardial Infarction (TIMI) Grade 3, indicating optimal perfusion. According to various reports, the incidence of the no‐reflow phenomenon among patients undergoing primary percutaneous coronary intervention (PPCI) varies depending on the definition of no‐reflow, ranging from 32% [1] to 43% [2]. The related mortality rate with no‐reflow also exhibits variability, ranging from 7.4% to 30.3% [3].
Various diagnostic techniques are used to identify the no‐reflow phenomenon, such as angiography, myocardial contrast echocardiography (MCE), and cardiac magnetic resonance imaging (CMR). MCE is considered the gold standard for diagnosing no‐reflow. In contrast, CMR is regarded as the most sensitive and specific method for assessing the severity of no‐reflow [3].
The no‐reflow phenomenon can also be evaluated by analyzing angiographic films. The corrected TIMI frame count (CTFC) provides a quantitative measure of coronary blood flow.
The no‐reflow phenomenon significantly increases the likelihood of severe clinical complications such as death, recurrent myocardial infarction (MI), reduced left ventricular ejection fraction (LVEF), changes in left ventricular structure, dangerous ventricular arrhythmias, heart failure (HF), and even cardiac rupture. In light of these harmful consequences, it is crucial to accurately identify instances of no‐reflow and the associated predictive factors [3]. Hyperglycemia during STEMI is associated with a subsequent reduction in myocardial salvage [4].
This study investigates the relationship between high blood glucose levels and no‐reflow in diabetic and nondiabetic patients undergoing PPCI and identifies contributing factors associated with its occurrence.
2. Method
2.1. Study Population
The study, conducted from April 2021 to July 2022, focused on STEMI patients aged 18 years or older who were admitted to our center and underwent PPCI. Patients who did not consent to the study, those who received medical treatment or urgent coronary artery bypass grafting (CABG) instead of PPCI, and patients who ceased before stent deployment or had incomplete data were excluded from the study. Culprit lesions limited to the posterior descending artery (PDA), posterior left ventricular (PLV) artery, or saphenous vein graft (SVG) were also excluded from the study as they are not specified in the CTFC.
2.2. Study Protocol
Demographic data, including age, height, weight, body surface area (BSA), and body mass index (BMI), were collected upon enrollment. Vital signs, including systolic and diastolic blood pressure and heart rate, were recorded at admission. A family history of coronary artery disease was documented according to the American Heart Association (AHA) guidelines [5], and lifestyle factors such as alcohol consumption and smoking history were recorded. Medical histories of Type 2 diabetes, hypertension, hyperlipidemia, obstructive sleep apnea, stroke, and peripheral artery disease were also documented.
A history of diabetes was defined by the American Diabetes Association’s 2022 guidelines using HbA1c and fasting blood glucose cutoffs (HbA1c > 6.5%, FBS > 126 mg/dL) or a self‐report. The history of hyperlipidemia was obtained through self‐report.
CCU nurses measured blood glucose levels at admission and every 6 h for the first 24 h using a blood glucose meter (Clever Chek TD‐4230). They cleaned the index finger pad with an alcohol swab, and then dried it with alcohol. Then, they used a single‐use lancet to draw blood.
The blood was correctly applied to the testing strip, and the reported blood sugar (BS) was documented.
A blood glucose check with the blood glucometer was performed immediately upon admission and every 6 h for the first 24 h, with the results accurately recorded. The highest level detected was reported as peak glycemia.
Initial complete blood samples, drawn from an antecubital or dorsal metacarpal vein, were tested for complete blood count (CBC), C‐reactive protein (CRP), liver enzymes, and kidney function. Also, fasting blood samples were collected on the first day after admission to measure HbA1c and lipid levels.
Experienced operators performed PPCI. Later, the SYNTAX score, TIMI flow, culprit lesions, and the number of diseased vessels were reported. Our study used the CTFC to define the no‐reflow phenomenon.
To objectively assess coronary flow as a continuous quantitative measure, we counted the number of cine frames until contrast initially reached predefined distal coronary landmarks within the IRA, known as the TIMI frame count. The TIMI frame count starts with the first frame in which the contrast dye fully enters the artery. This is determined when three specific criteria are met: (1) a column of nearly fully concentrated dye must span the entire width of the artery’s origin; (2) the dye must contact both edges of the artery’s origin; and (3) the dye must show forward movement. When the left anterior descending artery (LAD) is selectively engaged and the left circumflex artery (LCx) is identified as the problematic vessel, the TIMI frame count begins as soon as the dye first contacts both edges at the LCx’ s origin. The same principle applies when selectively engaging the circumflex artery. The final frame is counted as the moment the dye first reaches the distal landmark branch, without requiring complete opacification. Usually, the last frame is most accurately determined by advancing the cine film past the initial opacification of the endpoint branch, and then reversing frame by frame until the branch is no longer visible [6].
The analysis uses specific distal landmark branches, including the distal bifurcation of the LAD, often called the “mustache.” In the circumflex system, we focus on the distal bifurcation of the segment with the greatest total length that includes the culprit lesion. For the right coronary artery (RCA), attention is given to the first branch of the posterolateral artery. Notably, the LAD’s frame count is much higher. To address this difference in distance to distal arterial landmarks, we adjust the LAD TIMI frame count by dividing it by 1.7 [6]. Different references suggest CTFC cutoff values of 21 or 27 [6] to indicate normal flow; in this study, we used 27.
One expert interventionalist, blinded to the peak glycemia and patients’ diabetes history, performed an offline analysis and reported the TIMI, CTFC, and SYNTAX scores. The SYNTAX score was calculated using the following online calculator: https://syntaxscore.org/calculator/syntaxscore/frameset.htm.
Bedside echocardiography was performed within the first 24 h after PPCI using the GE Vivid S60N to evaluate cardiac function and structure. Left ventricular function was estimated visually by assessing LVEF. The chamber size [7], valvular diseases [8], and diastolic function [9] were assessed according to the latest guidelines.
2.3. Statistical Analysis
Data are presented as mean ± SD or frequency. The study aimed to analyze the relationship between various clinical factors and the occurrence of no‐reflow in patients undergoing PPCI, using SPSS for data analysis. The normal flow and no‐reflow groups were compared with an unpaired t‐test and Fisher’s exact test. Logistic regression was also employed for multifactorial predictors. A p value less than 0.05 was considered statistically significant. Analyses were conducted using SPSS Version 26.
3. Result
The study enrolled 252 patients, with 81.7% being male. Participants were divided into two groups based on the TIMI flow grade after PPCI. Table 1 shows the detailed demographic and laboratory data. The no‐reflow group included 107 participants (42.4%) with flow Grades 0–2, while the normal flow group had 145 participants (57.6%) with TIMI flow Grade 3. There were no significant differences in demographic factors like age and gender between the no‐reflow and normal flow groups, according to the available data. However, the prevalence of smoking was significantly higher in the no‐reflow group (55.14% vs. 30.34%).
Furthermore, a larger proportion of patients in the no‐reflow group had comorbidities such as diabetes (37.38%), hyperlipidemia (56.07%), and a history of CAD (27.10%) compared to the normal flow group (16.55%, 32.41%, and 8.28%, respectively). Both admission HbA1c (6.1% vs. 5.6%) and in‐hospital peak glycemia levels (220.6 vs. 179.4 mg/dL) were significantly higher in patients with no‐reflow than in those with normal reflow. This significant difference extended to other laboratory parameters, where patients with no‐reflow consistently showed higher values than those with normal reflow. These include uric acid (4.5 vs. 4.1 mg/dL, p = 0.031), HDL (40.5 vs. 38.4 mg/dL, p = 0.026), and LDL levels (104.4 vs. 95.4 mg/dL, p < 0.001). Although patients with no‐reflow had higher CRP levels, the difference was not statistically significant (p value = 0.088).
Regarding echocardiographic parameters, lower LVEF, RV dysfunction, and RV enlargement were significantly more common in the no‐reflow group. There was not enough statistical evidence of reduced LV enlargement in the no‐reflow group, but it was less frequent in normal‐flow patients (Table 2).
The angiographic characteristics (Table 3) showed significant differences between the two groups in the number of narrowed vessels and the SYNTAX score. Notably, the no‐reflow group had a significantly higher prevalence of multivessel disease (63.1%) compared to the normal flow group (44.1%) (p‐value = 0.001). The distribution of infarction‐related arteries also differed significantly between the normal and no‐reflow groups (p value = 0.003). The LAD was involved in 57% of the no‐reflow group and 36.6% of the normal flow group. The involvement of the RCA as the target lesion was more common in the normal reflow group than in the no‐reflow group (16.6% vs. 7.5%, respectively). Figure 1 illustrates the prevalence of no‐reflow considering the presence of diabetes and peak glycemia levels (below or above 180 mg/dL).
Distribution of the no‐reflow phenomenon based on the presence of diabetes and peak glycemia (PG) level.
Based on logistic regression, no interaction was observed between diabetes mellitus and peak glycemia levels above 180 mg (OR = 0.286, 95% CI = 0.070–1.177, p = 0.083). A peak glycemia level of ≥ 180 independently increased the odds of exhibiting the no‐reflow phenomenon (OR = 8.16, 95% CI: 4.1–16.2, p ≤ 0.001) (Table 4).
4. Discussion
This study investigated the association of the no‐reflow phenomenon in patients with STEMI undergoing direct PCI with peak glycemia. The findings indicated a significant association between the occurrence of the no‐reflow phenomenon and factors such as a history of diabetes, peak glycemia, a history of cigarette smoking, a history of CAD, and higher LDL levels in both diabetic and nondiabetic patients.
The no‐reflow phenomenon mainly occurs due to distal embolization and reperfusion injury. Patients may experience chest pain along with an elevation in the ST segment on the electrocardiogram [10, 11]. Coronary blood perfusion is a key clinical indicator for assessing the success of PCI in patients with STEMI. Restoring microvascular function and achieving successful reperfusion influence both functional and clinical outcomes after an AMI [12–14]. Therefore, recent studies focus on identifying predictors of the no‐reflow phenomenon in patients with STEMI before PPCI. Research shows that both hyperglycemia and peak glycemia are associated with the highest mortality rates, regardless of whether patients have diabetes [15, 16]. Hyperglycemia is strongly linked to AMI and correlates with high mortality rates in diabetic patients following an AMI [17, 18]. In this study, effective glycemic control may be a helpful strategy for preventing no‐reflow, regardless of diabetic status.
Additionally, no‐reflow has been associated with higher cholesterol levels and increased thrombus burden [19, 20]. Our study also notes that elevated LDL cholesterol in the no‐reflow group emphasizes the importance of this risk factor. This research does not assess HDL levels as they are highly affected in post‐STEMI states.
The hemodynamic vulnerability of hyperglycemic STEMI patients was reported in a retrospective study that assessed the predictive value of baseline characteristics, angiographic, echocardiographic, and laboratory data for in‐hospital mortality in 319 STEMI patients with cardiogenic shock who underwent PPCI. In the multivariate analysis, chronic renal failure, post‐PCI TIMI flow ≤ 2, plasma glucose and lactate level, blood urea nitrogen level, tricuspid annular plane systolic excursion (TAPSE), and LVEF were independent predictors of in‐hospital mortality. In this retrospective, only the blood glucose level at admission was measured, and the CTFC was not assessed [21]. Another retrospective study found an association between LVEF, chronic renal failure, post‐PCI TIMI flow ≤ 2, plasma glucose and lactate levels, and mortality among ACS patients with intra‐aortic balloon pump support in the intensive coronary care unit [22]. Again, serial measurement of the blood glucose and CTFC was not evaluated in their study.
Multiple prognostic scoring systems already incorporate glucose components, underscoring glycemia as a direct determinant of adverse outcomes in MI. In one study, the predictive performance of the “Intermountain Risk Score” (IMRS) and the “SYNTAX Score II” was compared. The IMRS combines variables from the CBC and metabolic panel, including sodium, potassium, chloride, bicarbonate, blood urea nitrogen, creatinine, glucose, and calcium levels. The IMRS outperformed the SYNTAX Score II in terms of predicting both short‐ and long‐term mortality [23].
The exact mechanism by which hyperglycemia influences the occurrence of no‐reflow during PCI remains unclear. Multiple potential pathological pathways have been suggested to explain the link between hyperglycemia and the no‐reflow phenomenon. First, hyperglycemia increases levels of intercellular adhesion molecule‐1 (ICAM‐1) and P‐selectin, which promote leukocyte adhesion to capillaries, thereby increasing capillary bed obstruction [24]. Furthermore, hyperglycemia contributes to the formation of additional microthrombi, a significant factor in the no‐reflow phenomenon. Microemboli generated during PPCI procedures can cause microvascular dysfunction. The underlying process involves microvascular plugging due to platelet and neutrophil activity, increased platelet activation, a large thrombus burden, reperfusion injury, ischemic injury, endothelial dysfunction, inflammation, oxidative stress, interstitial edema, and swelling of myocardial cells. Hyperglycemia may amplify these mechanisms, thereby worsening no‐reflow [25]. The role of hyperglycemia in activating blood coagulation has also been investigated in prior studies. Acute fluctuations in blood glucose appear to be associated with changes in the coagulation cascade, which may promote thrombosis [26, 27]. Stress hyperglycemia in patients with acute MI is a transient response triggered by the initial release of catecholamines, cytokines, and cortisol, rather than simply reflecting the patient’s underlying glucose metabolism. Deckers et al. [28] examined a large cohort of 11,324 patients, of whom 41% had blood glucose levels > 140 mg/dL at admission [28]. Stress hyperglycemia reduces fibrinogen half‐life and increases fibrinopeptide A levels, as well as prothrombin fragments, Factor VII, and platelet aggregation [29, 30]. Collectively, these findings indicate increased thrombotic activity.
It is important to acknowledge certain limitations of the current study. The cross‐sectional design should be noted, but it is worth emphasizing that our cohort was relatively large and included consecutive patients. Since the study focused on patients with STEMI undergoing PPCI, the results may not apply to all ACS patients. Additionally, we recognize the potential for residual confounding from unmeasured variables that could influence outcomes.
5. Conclusion
In this study, the group of patients who experienced no‐reflow had higher LDL levels, a greater prevalence of diabetes mellitus, and a history of smoking. High peak glycemia increases the likelihood of experiencing the no‐reflow phenomenon in patients with STEMI undergoing PPCI (Figure 2). Blood glucose levels should be closely monitored in all patients with STEMI, regardless of their diabetic status.
Summary of the research process and findings.
Author Contributions
Babak Geraiely: conceptualization, project administration, data curation, supervision, and methodology.
Maryam Mehrpooya: investigation, supervision, and methodology.
Golrokh Ghaffari: resources, project administration, data curation, and methodology.
Mohsen Faghihinia: resources and data curation.
Farnoosh Larti: supervision, methodology, and review and editing of the original and final draft.
Elnaz Shahmohamadi: writing the original draft and methodology.
Funding
The authors have nothing to report.
Ethics Statement
The Research Ethics Committee of Tehran University of Medical Sciences (IR.TUMS.MEDICINE.REC.1401.256) approved the study protocol. All treatment methods were conducted in accordance with relevant guidelines and regulations.
Consent
Written informed consent was obtained from the study population.
Conflicts of Interest
The authors declare no conflicts of interest.
The reference list from the paper itself. Each links out to its DOI / PubMed record.
- 1Rezkalla S. H. , Stankowski R. V. , Hanna J. , and Kloner R. A. , Management of No-Reflow Phenomenon in the Catheterization Laboratory, Jacc: Cardiovascular Interventions. (2017) 10, no. 3, 215–223, 10.1016/j.jcin.2016.11.059, 2-s 2.0-85011850425.28183461 · doi ↗ · pubmed ↗
- 2Hamada S. , Nakamura S. , Sugiura T. et al., Early Detection of the No-Reflow Phenomenon in Reperfused Acute Myocardial Infarction Using Technetium-99m Tetrofosmin Imaging, European Journal of Nuclear Medicine. (1999) 26, no. 3, 208–214, 10.1007/s 002590050378, 2-s 2.0-0033040417.10079309 · doi ↗ · pubmed ↗
- 3Wang L. , Huang S. , Zhou Q. , Dou L. , and Lin D. , The Predictive Value of Laboratory Parameters for No-Reflow Phenomenon in Patients With ST-Elevation Myocardial Infarction Following Primary Percutaneous Coronary Intervention: A Meta-Analysis, Clinical Cardiology. (2024) 47, no. 2, 10.1002/clc.24238.PMC 1089141538400562 · doi ↗ · pubmed ↗
- 4Lønborg J. , Vejlstrup N. , Kelbæk H. et al., Impact of Acute Hyperglycemia on Myocardial Infarct Size, Area at Risk, and Salvage in Patients With Stem I and the Association With Exenatide Treatment: Results From a Randomized Study, Diabetes. (2014) 63, no. 7, 2474–2485.24584550 10.2337/db 13-1849 · doi ↗ · pubmed ↗
- 5Arnett D. K. , Blumenthal R. S. , Albert M. A. et al., 2019 ACC/AHA Guideline on the Primary Prevention of Cardiovascular Disease: A Report of the American College of Cardiology/American Heart Association Task Force on Clinical Practice Guidelines, Circulation. (2019) 140, no. 11, E 596–E 646, 10.1161/cir.0000000000000678, 2-s 2.0-85072058148.30879355 PMC 7734661 · doi ↗ · pubmed ↗
- 6Gibson C. M. , Cannon C. P. , Daley W. L. et al., Timi Frame Count: A Quantitative Method of Assessing Coronary Artery Flow, Circulation. (1996) 93, no. 5, 879–888, 10.1161/01.cir.93.5.879, 2-s 2.0-9044246670.8598078 · doi ↗ · pubmed ↗
- 7Lang R. M. , Badano L. P. , Mor-Avi V. et al., Recommendations for Cardiac Chamber Quantification by Echocardiography in Adults: An Update From the American Society of Echocardiography and the European Association of Cardiovascular Imaging, European Heart Journal-Cardiovascular Imaging. (2015) 16, no. 3, 233–271, 10.1093/ehjci/jev 014, 2-s 2.0-84933508191.25712077 · doi ↗ · pubmed ↗
- 8Otto C. M. , Nishimura R. A. , Bonow R. O. et al., 2020 ACC/AHA Guideline for the Management of Patients With Valvular Heart Disease: A Report of the American College of Cardiology/American Heart Association Joint Committee on Clinical Practice Guidelines, Circulation. (2021) 143, no. 5, E 72–E 227, 10.1161/cir.0000000000000923.33332150 · doi ↗ · pubmed ↗