Exploring phytochemistry, antioxidant potential, essential oil profiling and bioactive profiling of Pogostemon mollis Benth. through GC–MS and UPLC-QTOF-MS/MS
Sobiyanaz Momin, Mayur Jadhav, Rajaram Gurav

TL;DR
This study explores the chemical composition and antioxidant properties of Pogostemon mollis, identifying various bioactive compounds and essential oils.
Contribution
The study provides a comprehensive phytochemical and antioxidant profile of Pogostemon mollis using advanced analytical techniques.
Findings
Dry aqueous leaf extract showed the highest antioxidant inhibition (65.1 ± 0.11%).
UPLC-QTOF-MS/MS identified 99 bioactive compounds, including anticancer and antiviral agents.
GC–MS identified 68 essential oil compounds, with lupeol, alpha-cyperone, and caryophyllene oxide as major constituents.
Abstract
The genus Pogostemon (Lamiaceae) is known for its diverse pharmacological and ethnomedicinal properties, which may be due to the presence of various bioactive constituents. This study investigates antioxidant potential, profiling of phytochemicals, essential oil and their derivatives from Pogostemon mollis Benth., and correlation among them. Plant parts were taken in fresh and dried forms, were extracted using methanol, acetone and distilled water through ultrasonication extraction method. Essential oil was obtained from the aerial parts through hydro-distillation with a Clevenger apparatus. Antioxidant activity by DPPH, FRAP, and ABTS, demonstrating significant radical scavenging and reducing power; dry aqueous leaf extract showing the highest inhibition (65.1 ± 0.11%) and the lowest in fresh aqueous stem extract (9.80 ± 0.24%). Total phenolic and flavonoid contents were checked for…
Genes, proteins, chemicals, diseases, species, mutations and cell lines named across the full text — each resolved to its canonical identifier and authoritative record.
Click any figure to enlarge with its caption.
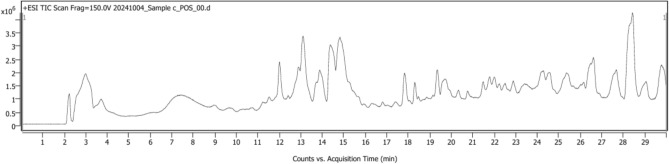 Figure 10
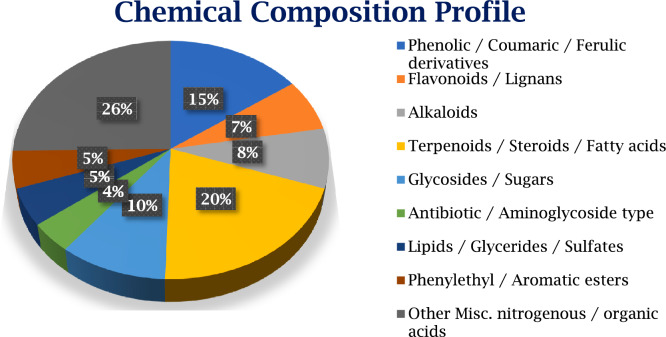 Figure 11
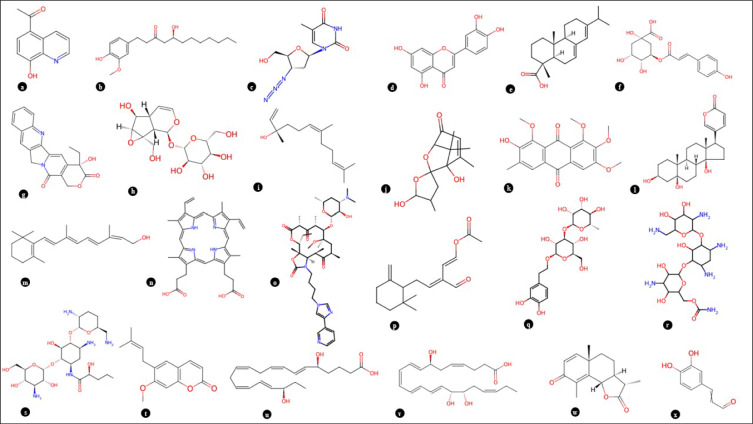 Figure 12
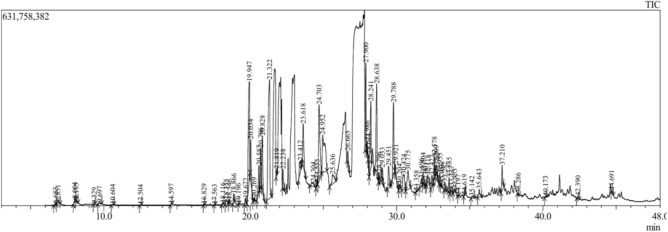 Figure 13
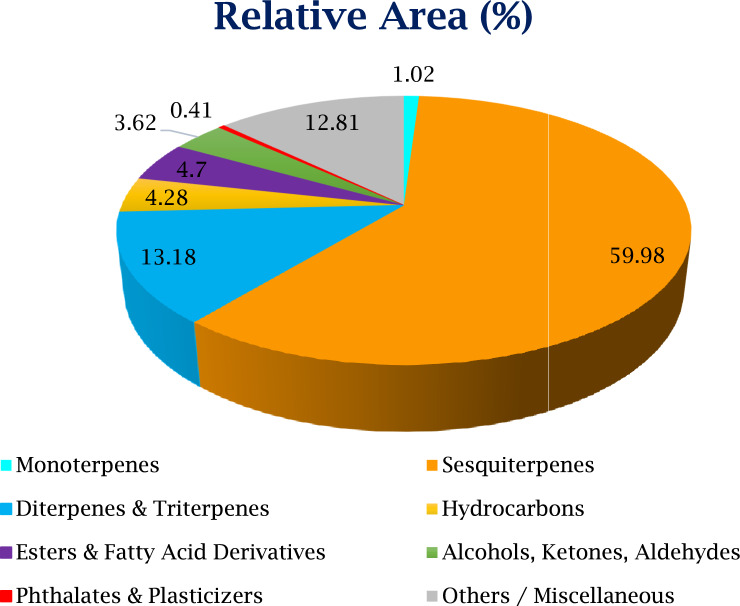 Figure 14
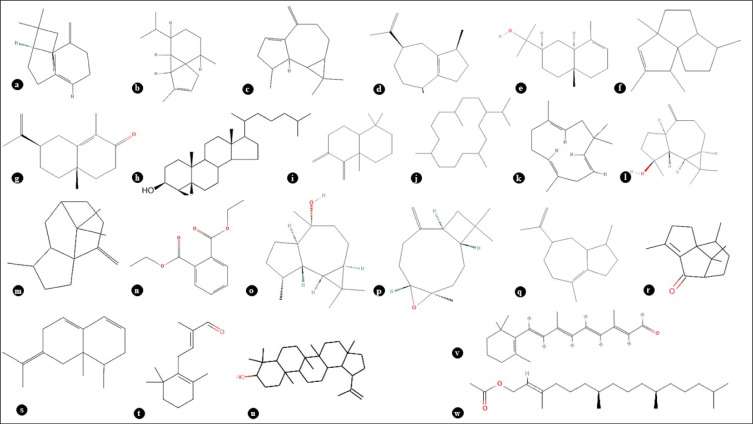 Figure 15
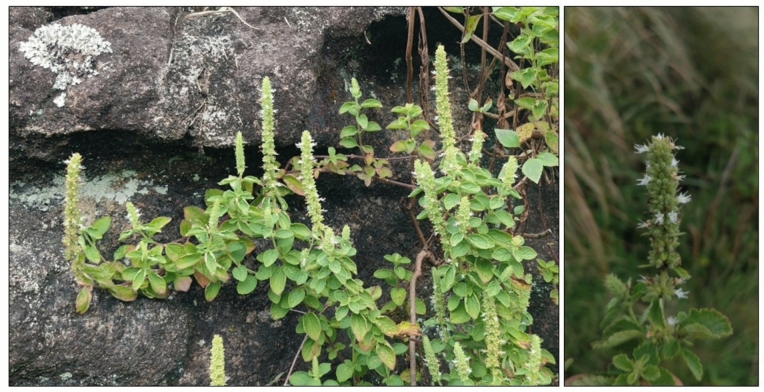 Figure 1
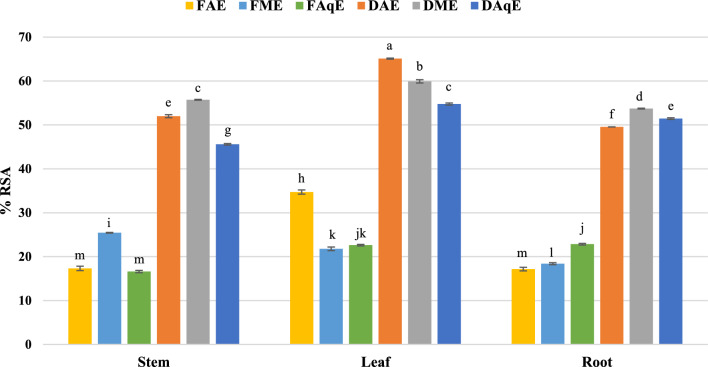 Figure 2
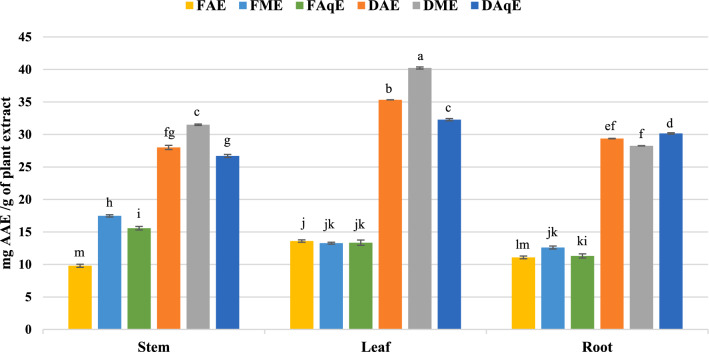 Figure 3
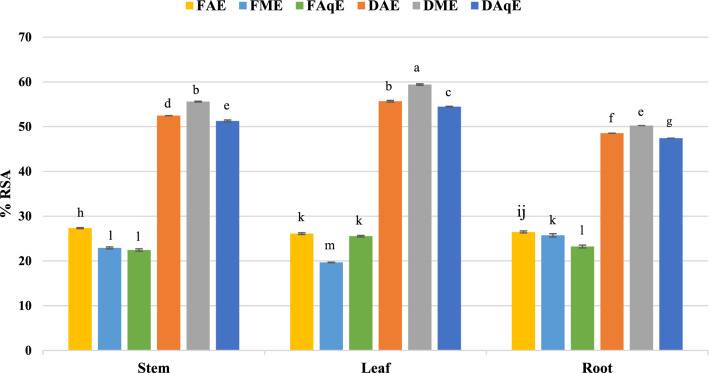 Figure 4
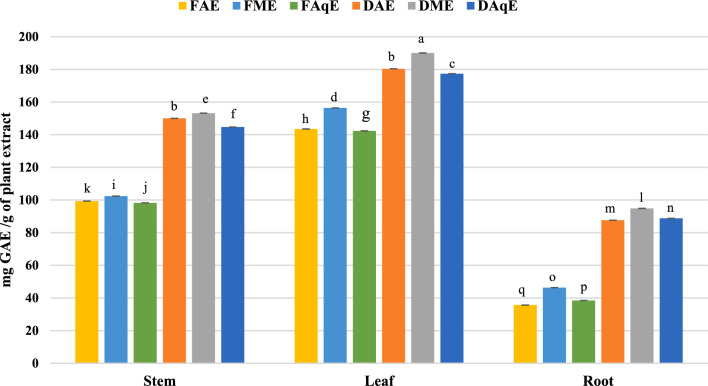 Figure 5
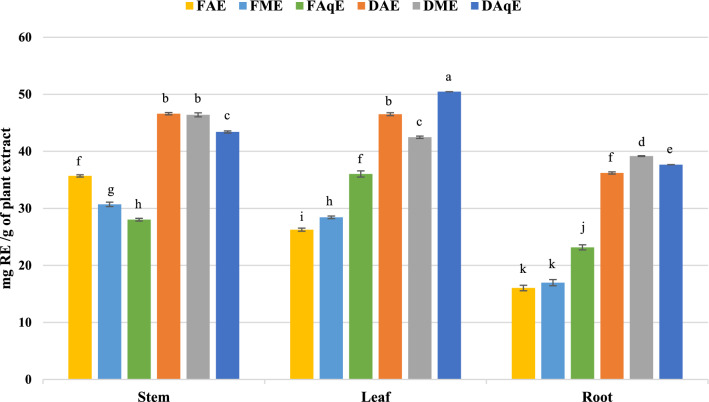 Figure 6
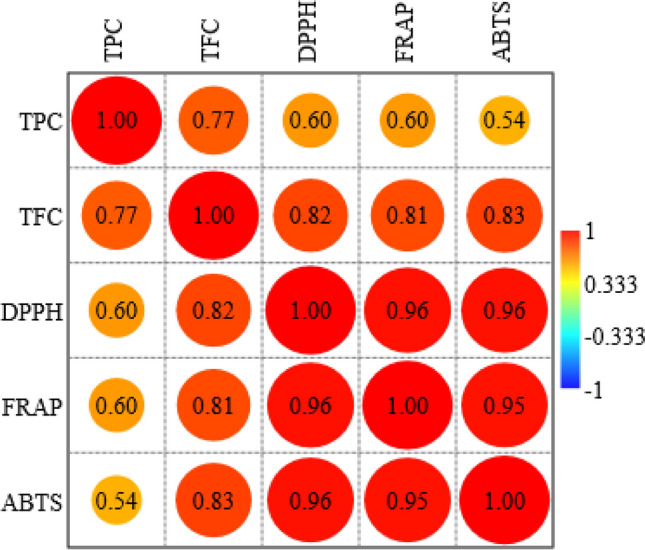 Figure 7
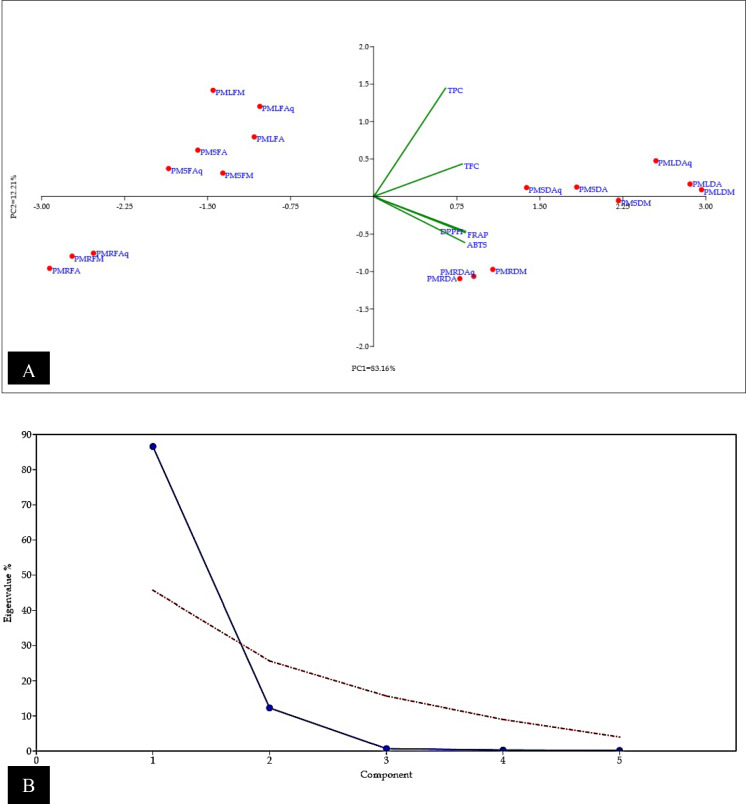 Figure 8
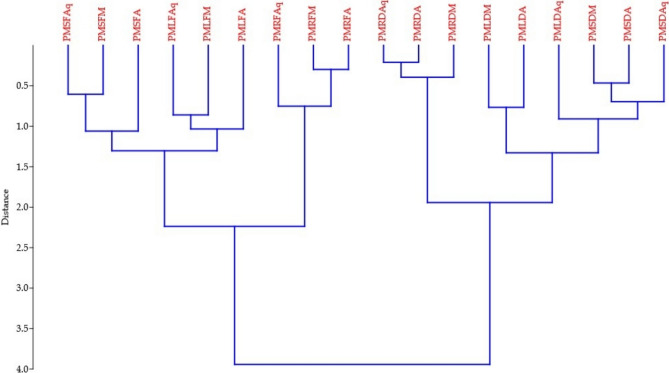 Figure 9
Peer Reviews
No public reviews on file for this paper yet. If you reviewed it on a platform where reviews are public (OpenReview, ICLR, NeurIPS, ICML), you can paste yours below so the community can read it here.
Videos
No videos yet. Explain this paper in a talk, walkthrough, or lecture? Add one.
Taxonomy
TopicsEssential Oils and Antimicrobial Activity · Ethnobotanical and Medicinal Plants Studies · Plant biochemistry and biosynthesis
Introduction
The Lamiaceae family includes numerous aromatic species widely utilised in traditional medicine, as well as in pharma and food sectors, due to diverse biological activities^1^. A total of 272 genera of flowering plants were identified as having medicinal uses, among which approximately 4% of studied species belonged to the Lamiaceae family^2^. Pogostemon mollis is an undershrub that grows to a height of 30–60 cm that growing on hills above 1200 m on exposed rocks and bare slopes. It has been found predominantly in various parts of southwestern India, as well as in the Western and Eastern Ghats. It contains bioactive constituents that have been used since ancient times and are associated with various therapeutic effects, such as pain relief, asthma management, anticancer activity, inflammation reduction, and antimicrobial action^3^. The therapeutic potential of these plant species is attributed to their diverse phytochemical profile, including several secondary metabolites such as phenolics, flavonoids, alkaloids, and other groups, which exhibit notable bioactivity as antioxidants, antimicrobial agents, and anti-pathogenicity,thereby supporting their traditional use in disease management^3–5^. George et al.^6^ studied ethyl acetate extract of P. mollis, having higher phenolic concentration of 474.8 mg GAE/g, followed by methanol 311.1 mg GAE/g and acetone extracts 309.8 mg GAE/g. DPPH radical scavenging reveal that the ethyl acetate extract had 3.1 µg/mL, while the acetone extract had 3.8 µg/mL. It exhibited maximum reduction in nitric oxide levels at 11.7%, showcasing its potential in scavenging reactive nitrogen species. Flavonoids possess potent antioxidant, anti-inflammatory, anticancer and antimicrobial activities^7^. Saranya et al.^8^ studied qualitative screening of P. mollis with solvents (petroleum ether, ethyl acetate, and ethanol) for the different parts, as leaf, stem, and root. Results showed a significant presence of secondary metabolites, indicating the plant’s potential for therapeutic applications. Analysis of ash values indicated a high purity level in plant extracts. Total ash, along with its water-soluble and acid-insoluble fractions, was measured to assess inorganic content, which is essential for assessing the quality and authenticity of herbal medicines^9^. Earlier, Li^10^ and Chakrapani et al.^11^ have reported many active compounds in P. mollis, through HPLC; George et al.^6^ found several compounds in ethyl acetate, methanol and acetone extract. Muthuraj et al.^9^ detected 47 bioactive compounds from the methanolic extract by GC–MS. The essential oil of the Opopanax genus exhibits low yield but a chemically diverse profile dominated by monoterpenes and sesquiterpenes, as reported in Turkish populations. Babacan et al.^12^ identified major constituents such as trans-β-ocimene, myrcene, α-pinene, and germacrene D, highlighting the genus’s phytochemical and pharmacological relevance.
Kurt-Celep et al.^13^ reported that extracts of Astragalus caraganae possess a rich profile of phenolic and flavonoid constituents, with compounds such as rutin, p-coumaric acid, chlorogenic acid, isoquercitrin, and delphinidin-3,5-diglucoside predominating. Their study demonstrated notable antioxidant and enzyme-inhibitory activities, along with non-cytotoxic yet concentration-dependent cytostatic effects on HDF cells, underscoring the plant’s pharmacological relevance. Yagi et al.^14^ showed that Phlomis fruticosa, P. herba-venti and P. kurdica possess diverse bioactive metabolites, with methanol extracts providing the richest chemical profiles. Their study demonstrated notable antioxidant, metal-chelating and cholinesterase-inhibitory activities across the species.
Essential oils are a class of volatile, aromatic compounds having broad applications in both culinary and perfumery sectors. These oils typically consist of intricate blends of terpenes—mainly monoterpenes and sesquiterpenes—and their corresponding oxygenated compounds^15^. Evaluation of antimicrobial properties of essential oil from P. mollis yielded significant findings regarding its effectiveness against various bacterial and fungal strains. It has antifungal activity against Staphylococcus aureus, Streptococcus pyogenes and Escherichia coli, and antimicrobial action against Candida tropicalis, Candida albicans Proteus mirabilis^9,16^). The SARS-CoV-2 viral infection, which emerged in late 2019, rapidly spread worldwide and was declared a global pandemic, with ongoing impact to the present day. Secondary metabolites have been explored for their interactions with various target proteins of SARS-CoV-2 in search of potential lead compounds against COVID-19. Use of in silico tools has allowed researchers to explore a vast range of medicinal plant compounds, effectively narrowing down bioactive leads and reducing the reliance on traditional experimental methods^17^. Pogostemon cablin has been explored for its potential antiviral properties, including its effectiveness against the COVID-19 virus^18^. MTT assay revealed that extracts exhibited cytotoxic activity against RAW 264.7, MCF-7, and Caco-2 cell lines. Extracts exhibited a dose-dependent reduction in cell viability^6^.
Earlier studies on Pogostemon mollis have mainly focused on either single solvent extracts or limited plant parts. Previous investigations did not provide a comprehensive comparison of leaf, stem, and root extracts nor evaluate how different solvents (water, methanol, acetone) influence the phytochemical profile, essential oil composition, and antioxidant activity. The present study therefore offers the first detailed, organ-wise and solvent-wise evaluation of P. mollis, providing a more complete understanding of its chemical diversity and supporting its traditional medicinal applications (Fig. 1).Fig. 1Pogostemon mollis Benth. (A) Habitat, (B) Inflorescence.
Materials and methods
Collection and authentication
Pogostemon mollis Benth. collected from Trivandrum district, 8°45′36.39″N, 77° 6′ 39.52″E, Ponmudi Hills, Kerala. Plant specimens were taxonomically identified and authenticated by Prof. Rajaram Gurav. Specimens from the same population were deposited as voucher specimens (SAM-006, SAM-007) in the Herbarium of Shivaji University (SUK). All necessary permits for the collection and use of plant materials were obtained from the Kerala Forest Department (No. KFDHQ/4512/2024-CWW/WL10).
Preparation of plant extracts and essential oil
The biochemical, antioxidant activities of fresh and dried leaf, stems, and roots of P. mollis were studied. Extract prepared by the Ultrasonication method using methanol, acetone, and distilled water as solvents^19^. Specimens were processed as both fresh and oven-dried,the drying occurred at 60 °C, and fresh samples had been frozen at − 80 °C for an ongoing study. Essential oil isolated from aerial parts (leaf, inflorescence with floral buds) through hydro distillation was performed using a Clevenger-type apparatus^20^. Subsequently, oil was stored at 4 °C until it was required for continued use.
Antioxidant potential
DPPH radical scavenging activity
Radical scavenging potential was evaluated using the protocol of Aquino et al.^21^, with minor modifications. In brief, 10 μl of extract was taken and mixed with 290 μl freshly prepared DPPH solution. The components were mixed uniformly and kept at room temperature for incubation for over 30 min. After decolourization, the reaction mixture was measured at 517 nm. A standard curve was constructed using ascorbic acid (mg/ml). Results were represented as a percentage of inhibition.
\documentclass[12pt]{minimal} \usepackage{amsmath} \usepackage{wasysym} \usepackage{amsfonts} \usepackage{amssymb} \usepackage{amsbsy} \usepackage{mathrsfs} \usepackage{upgreek} \setlength{\oddsidemargin}{-69pt} \begin{document}$${\text{Percentage of Inhibition}} = \left[ {\left( {{\mathrm{Abs}}.{\text{ Control}} - {\mathrm{Abs}}.{\text{ Sample}}} \right)/{\mathrm{Abs}}.{\text{ Control}}} \right] \times {1}00$$\end{document}FRAP (ferric reducing antioxidant power) assay
Reducing power assay was determined by following the Benzie and Strain et al.^22^ method with a few changes. To prepare the FRAP reagent solution, 0.3 M acetate buffer (pH 3.6), 10 mM TPTZ in 40 mM HCl, and 20 mM FeCl₃·6H₂O were mixed in a 10:1:1 volume ratio. The resulting solution was then incubated in a water bath at 37 °C for 10 min before use. In this experiment, a 10 μl volume of plant extract was mixed with 290 µl freshly prepared FRAP solution, and following a 30-min incubation in the dark, absorbance was recorded at 595 nm. Values were calculated and expressed as milligrams of ascorbic acid equivalent per gram (mg AAE/g) of sample weight.
ABTS (2, 2-azino-bis-3-ethylbenzothiazoline-6-sulphonic acid) assay
ABTS is extensively applied in antioxidant activity assessment or free radical scavenging capacity of plant extracts. The assay was performed following the method described by Re et al.^23^. For the assay, 10 μl of the plant extract was mixed with 190 μl of ABTS working solution. The ABTS reagent was prepared by mixing equal volumes of a 7 mM aqueous solution of ABTS and a 2.45 mM aqueous solution of potassium persulfate, and incubating this mixture for 12–16 h in the dark. The resulting solution was then diluted to achieve an absorbance of 0.70 ± 0.02 at 734 nm. After mixing with the plant extract, the mixture was kept at room temperature for 10 min. Antioxidant activity was assessed by measuring the reduction in absorbance at 734 nm. Ascorbic acid served as a reference standard. The percentage of free radical scavenging or inhibition was calculated accordingly.
\documentclass[12pt]{minimal} \usepackage{amsmath} \usepackage{wasysym} \usepackage{amsfonts} \usepackage{amssymb} \usepackage{amsbsy} \usepackage{mathrsfs} \usepackage{upgreek} \setlength{\oddsidemargin}{-69pt} \begin{document}$${\text{ABTS scavenging activity }}\left( \% \right) = \left[ {\left( {{\mathrm{Abs}}.{\text{ Control}} - {\mathrm{Abs}}.{\text{ Sample}}} \right)/{\mathrm{Abs}}.{\text{ Control}}} \right] \times {1}00$$\end{document}Quantitative phytochemistry
Determination of total phenolic content
TPC was estimated using the Folin-Ciocalteu (FC) reagent following the modified protocol of Singleton and Rossi^24^. In brief, 125 µl of extract was combined with 1.8 ml of FC reagent and incubated at 25 °C for 5 min. Subsequently, 1.2 ml of 15% Na_2_CO_3_ was added, mixture was allowed to react for 90 min room temperature. Absorbance was measured at 765 nm, and total phenolic content (TPC) was calculated in milligrams of gallic acid equivalent per gram of sample (mg GAE/g) utilizing a standard curve for calibration.
Determination of total flavonoid content
Flavonoid quantification was carried out following the colorimetric procedure of Luximon-Ramma et al.^25^. To quantify total flavonoid content (TFC), 150 μl of plant extract was combined with 150 μl of a 2% aluminium chloride solution and incubated at room temperature for 10 min. Absorbance was recorded at 367 nm, and TFC was expressed as milligrams of rutin equivalents per gram of sample (mg RE/g).
Bioactive Compound Profiling (UPLC Q-TOF MSMS)
Analysis was performed using ultra-performance liquid chromatography coupled with quadrupole time-of-flight tandem mass spectrometry (UPLC-QToF-MS/MS) was conducted through an Agilent Q-ToF G6540B mass spectrometer integrated with an Agilent 1260 Infinity II HPLC system. Chromatographic separation was carried out on an Agilent Eclipse XDB-C18 column (3.0 × 150 mm, 3.5 µm particle size), maintained at a constant temperature of 40 °C. Mobile phase comprised Solvent A (0.1% formic acid in water) and Solvent B (0.1% formic acid in acetonitrile), delivered at a flow rate of 0.3 mL/min. Gradient elution was as follows: A gradient elution program was employed over a total runtime of 30 min. The initial mobile phase composition was 95% solvent A and 5% solvent B, maintained from 0.0 to 2.0 min. The proportion of solvent B was then linearly increased to 95%, reaching this composition at 25.0 min and held constant until 28.0 min. At 28.1 min, the gradient was rapidly returned to the initial conditions (95% A, 5% B), and the system was re-equilibrated under these conditions for 30 min. The mass spectrometer was operated in dual electrospray ionization (Dual AJS ESI) mode with both positive and negative ionization. Data were collected over a mass-to-charge ratio range from 100 to 1700. The analysis was carried out using the following optimised instrumental conditions: the nebuliser gas temperature was maintained at 300 °C, while the sheath gas temperature was set at 350 °C. The drying gas flow rate was 8L/min, and the sheath gas flow rate was maintained at 11L/min. The nebuliser pressure was adjusted to 35psi. A capillary voltage of 3500 V and a nozzle voltage of 1000 V were applied to ensure efficient ionization and transmission of the analyte.
Essential oil profiling (GC–MS)
The volatile constituents of P. mollis oil were analysed by GC–MS employing the TQ 8050 plus instrument (Shimadzu, Japan) equipped with an HS-20 unit. An SH-Rxi-5Sil MS capillary column (30 m length × 0.25 mm internal diameter × 0.25 μm film thickness) was used for the separation. Injection mode was set to split, with a split ratio of 1.0. Inlet pressure conditions were regulated at 75.2 kPa, and the linear velocity of carrier gas was 41.4 cm/sec. A purge flow of 3.0 ml/min was applied. Column oven temperature was programmed from 50 to 260 °C. High-purity helium gas (99.9%) was employed as carrier gas, maintained at a constant flow rate throughout analysis. Compound identification was carried out by interpreting the mass spectra obtained from GC–MS, comparing them against spectral databases of the National Institute of Standards and Technology (NIST) and WILEY-08 libraries.
Statistical analysis
All experiments were conducted in triplicate, and the resulting average values were considered as individual data points. Results are presented as the mean ± standard error (SE). Experimental data were statistically analyzed using one-way ANOVA, and significant differences between mean values were determined by Duncan’s Multiple Range Test (p ≤ 0.05) using SPSS software (version 16). The correlation coefficient was determined between TPC, TFC, and antioxidant activities using SPSS (version 16.0). PAST software (version 3.01) was used to perform Principal Component Analysis (PCA) and Hierarchical Cluster Analysis (HCA) to analyse data derived from phytochemical profiling and antioxidant ability of various extracts.
Results and discussion
Antioxidant potential
2,2-diphenyl-1-picrylhydrazyl assay (DPPH) assay
A colour changes from purple to yellow was observed in the DPPH assay with a decrease in absorbance. Colour change occurs due to donating the hydrogen for scavenging free radicals by antioxidants, which causes a stable form of the DPPH molecule. In the present study, methanol and acetone extracts of both species showed the highest Radical Scavenging Activity (RSA), as presented in (Table 1 and Fig. 2). Dry aqueous leaf extract showed the highest percentage inhibition (65.1 ± 0.11), while the fresh acetonic stem extract % inhibition was minimum (16.62 ± 0.26).Table 1DPPH, FRAP and ABTS activity of P. mollis Benth.Extraction codeDPPH^α^FRAP^β^ABTS^α^DSAq52.00 ± 0.33ᵉ28.01 ± 0.18^ fg^52.50 ± 0.01^d^DSM55.70 ± 0.17ᶜ31.49 ± 0.13^c^55.60 ± 0.23^b^DSA45.60 ± 0.08ᵍ26.70 ± 0.06^ g^51.30 ± 0.10^e^DLAq65.10 ± 0.11ᵃ35.33 ± 0.00^b^55.70 ± 0.19^b^DLM59.90 ± 0.24ᵇ40.23 ± 0.09^a^59.40 ± 0.17^a^DLA54.80 ± 0.38ᶜ32.28 ± 0.10^c^54.50 ± 0.09^c^DRAq49.50 ± 0.01ᶠ29.37 ± 0.02^ef^48.50 ± 0.01f.DRM53.70 ± 0.08ᵈ28.25 ± 0.01f.50.20 ± 0.01^e^DRA51.40 ± 0.18ᵉ30.15 ± 0.06^d^47.40 ± 0.00^ g^FSAq17.32 ± 0.50ᵐ09.80 ± 0.24^ m^27.30 ± 0.11^ h^FSM25.40 ± 0.08ⁱ17.47 ± 0.27^ h^22.90 ± 0.27^ l^FSA16.62 ± 0.26ᵐ15.58 ± 0.17^i^22.40 ± 0.23^ l^FLAq34.72 ± 0.47^ h^13.61 ± 0.18^j^26.10 ± 0.20^ k^FLM21.79 ± 0.42ᵏ13.27 ± 0.14^jk^19.70 ± 0.06^ m^FLA22.62 ± 0.18ʲᵏ13.35 ± 0.41^jk^25.50 ± 0.18^ k^FRAq17.16 ± 0.41ᵐ11.09 ± 0.41^ lm^26.50 ± 0.22^ij^FRM18.39 ± 0.23ˡ12.61 ± 0.22^jk^25.70 ± 0.39^ k^FRA22.84 ± 0.18ʲ11.31 ± 0.52^kl^23.20 ± 0.30^1^DSAq dry stem aqueous extract, DSM dry stem methanol extract, DSA dry stem acetone extract, DLAq dry leaf aqueous extract, DLM dry leaf methanol extract, DLA dry leaf acetone extract, DRAq dry root aqueous extract, DRM dry root methanol extract, DRA dry root acetone extract, FSAq fresh stem aqueous extract, FSM fresh stem methanol extract, FSA fresh stem acetone extract, FLAq fresh leaf aqueous extract, FLM fresh leaf methanol extract, FLA fresh leaf acetone extract, FRAq fresh root aqueous extract, FRM fresh root methanol extract, FRA fresh root acetone extract.Values are means of three replicate determinations ± standard error. Mean values in the same column with different alphabets shows statistically significant differences (p ≤ 0.05) according to Duncan’s multiple range test. α (% inhibition) and β (mg AAE /g extract).Fig. 2DPPH radical scavenging activity P. mollis in different solvents with fresh and dried plant parts (FAE fresh acetone extract, FME fresh methanol extract, FAqE Fresh aqueous extract, DAE dry acetone extract, DME dry methanol extract, DAqE dry aqueous extract).
Ferric reducing antioxidant power (FRAP) assay
The FRAP assay measures antioxidant activity following the reduction of ferric ions, where the test solution shifts from yellow to green or blue hues, indicating the sample’s reducing power. A compound’s capacity to act as a reducing agent is a key marker of its antioxidant strength. FRAP assay assesses this by monitoring the transformation of ferric (Fe3⁺)-TPTZ complex into its ferrous (Fe2⁺) form, producing a coloured complex indicative of antioxidant activity. Antioxidant capacity is closely associated with the reducing power of bioactive compounds, which reflects their ability to donate electrons. Dry methanolic leaf extract showed the highest FRAP (40.23 ± 0.09) while fresh aqueous stem extract was minimum 9.80 ± 0.24 mg AAE/g (Table 1 & Fig. 3).Fig. 3FRAP activity P. mollis in different solvents with fresh and dried plant parts. FAE fresh acetone extract, FME fresh methanol extract, FAqE fresh aqueous extract, DAE dry acetone extract, DME dry methanol extract, DAqE dry aqueous extract.
ABTS assay
ABTS assay, based on an electron transfer mechanism, was used to assess radical scavenging potential. It involves the reduction of the dark blue ABTS**⁺** cation (2,2′-azino-bis(3-ethylbenzothiazoline-6-sulfonic acid)) by antioxidants into a colourless form. This change can be quantified using a spectrophotometer. Take 10 μl extract, then add 290 μl ABTS, then incubate in the dark for over 30 min at room temperature. Take absorbance at 734 nm. Maximum inhibition was observed in dry leaf extract prepared using methanol (59.4 ± 0.17%), while the fresh methanolic extract of leaf % inhibition was minimum (19.7 ± 0.06) as represented in (Table 1 & Fig. 4).Fig. 4ABTS activity P. mollis in different solvents with fresh and dried plant parts. FAE fresh acetone extract, FME fresh methanol extract, FAqE fresh aqueous extract, DAE dry acetone extract, DME dry methanol extract, DAqE dry aqueous extract.
Quantitative phytochemistry
Determination of total phenolic content
Phenolic compounds represent a varied class of plant-derived bioactive secondary metabolites featuring hydroxyl groups (–OH) bonded to aromatic ring systems. These compounds include flavonoids, phenolic acids, coumarins, quinones, stilbenes, and tannins. Folin-Ciocalteu reagent interacts with polyphenols and other reducing agents, resulting in the formation of a blue-coloured complex. This method relies on the ability of phenolic substances to donate electrons to phosphomolybdic and phosphotungstic acid complexes under alkaline conditions. The intensity of the developed blue colouration is quantified at 765 nm using a UV–Visible spectrophotometer. Gallic acid (μg/ml) was used as a standard to construct the calibration curve. The maximum total phenolic content was recorded in dry methanolic leaf extract, measuring 249.9 ± 0.47 mg GAE (Gallic acid equivalent) / g extract, while fresh acetonic root extract shows the lowest phenolic content, 64.12 ± 0.31 mg GAE / g extract (Fig. 5 and Table 2).Fig. 5. Total phenolic contents P. mollis in different solvents with fresh and dried plant parts. FAE fresh acetone extract, FME fresh methanol extract, FAqE fresh aqueous extract, DAE dry acetone extract, DME dry methanol extract, DAqE dry aqueous extract.Table 2TPC and TFC activity of P. mollis Benth.Extraction codeTPC^α^TFC^β^DSAq158.4 ± 0.63ᵉ46.60 ± 0.20^b^DSM166.5 ± 0.63ᶜ46.40 ± 0.36^b^DSA147.4 ± 0.68ᶠ43.40 ± 0.19^c^DLAq188.7 ± 0.11ᵇ46.50 ± 0.26^b^DLM249.9 ± 0.47ᵃ42.50 ± 0.20^c^DLA162.1 ± 0.34ᵈ50.50 ± 0.00^a^DRAq117.9 ± 0.40ʲ36.20 ± 0.20^f^DRM119.3 ± 0.48ʲ39.20 ± 0.07^d^DRA110.8 ± 0.50ᵏ37.70 ± 0.00^e^FSAq146.0 ± 0.37ᶠ35.13 ± 0.19^f^FSM124.8 ± 0.26ⁱ30.72 ± 0.34^g^FSA102.2 ± 0.23ˡ28.03 ± 0.23^h^FLAq142.4 ± 0.21ᵍ26.27 ± 0.28^i^FLM157.0 ± 0.34ᵉ28.43 ± 0.23^h^FLA132.1 ± 0.31ʰ36.04 ± 0.27^f^FRAq74.68 ± 0.02ⁿ16.04 ± 0.49^k^FRM87.53 ± 0.03ᵐ16.98 ± 0.45^k^FRA64.12 ± 0.31ᵒ23.17 ± 0.54^j^DSAq dry stem aqueous extract, DSM dry stem methanol extract, DSA dry stem acetone extract, DLAq dry leaf aqueous extract, DLM dry leaf methanol extract, DLA dry leaf acetone extract, DRAq dry root aqueous extract, DRM dry root methanol extract, DRA dry root acetone extract, FSAq fresh stem aqueous extract, FSM fresh stem methanol extract, FSA fresh stem acetone extract, FLAq fresh leaf aqueous extract, FLM fresh leaf methanol extract, FLA fresh leaf acetone extract, FRAq fresh root aqueous extract, FRM fresh root methanol extract, FRA fresh root acetone extract.Values are means of three replicate determinations ± standard error. Mean values in the same column with different alphabets shows statistically significant differences (p ≤ 0.05) according to Duncan’s multiple range test. α (mg GAE/ g extract) and β (mg RE / g extract).
Determination of total flavonoid content
Flavonoids are composed of two benzene rings (designated as A and B) connected through a three-carbon bridge that forms a central oxygen-containing heterocyclic ring, known as the C ring^26^. Flavonoids can be categorised into various subclasses, including flavonols, flavanones, flavan-3-ols, anthocyanins, flavones, and isoflavones. Flavonoids possess strong antioxidant activity, neutralizing free radicals and minimizing oxidative stress, thereby contributing to the prevention of various chronic illnesses^27^. Flavonoids can exhibit antimicrobial properties by inhibiting the growth of various pathogens^28^. Several flavonoids have shown potential anticancer effects by inducing apoptosis and inhibiting tumor growth^29^. Rutin was employed as the calibration standard for flavonoid quantification. Dry acetonic leaf extract shows the highest total flavonoids content at 50.5 ± 0.00 mg RE (Rutin Equivalents) per gram of extract were the lowest concentration observed in the Fresh aqueous extract of root 16.04 ± 0.49 mg RE/ g of extract (Fig. 6 & Table 2).Fig. 6. Total flavonoid contents in P. mollis in different solvents with fresh and dried plant parts. FAE fresh acetone extract, FME fresh methanol extract, FAqE fresh aqueous extract, DAE dry acetone extract, DME dry methanol extract, DAqE dry aqueous extract.
Statistical analysis
The correlation heat map (Fig. 7) presents the Pearson correlation coefficients among total phenolic content (TPC), total flavonoid content (TFC), and three antioxidant assays: DPPH, FRAP, and ABTS. All parameters exhibit positive correlations, with the strongest relationships observed among the antioxidant assays themselves. DPPH shows a very high correlation with both FRAP (r = 0.96) and ABTS (r = 0.96), while FRAP and ABTS are similarly correlated (r = 0.95), indicating consistency and reliability among these methods in evaluating antioxidant activity. TFC is also strongly correlated with the antioxidant assays, showing coefficients of 0.82 (DPPH), 0.81 (FRAP), and 0.83 (ABTS), suggesting that flavonoids significantly contribute to the antioxidant capacity of the plant extracts. In comparison, TPC displays moderate correlations with DPPH (r = 0.60), FRAP (r = 0.60), and ABTS (r = 0.54), indicating a contributory but less dominant role of total phenolics. The moderate correlation between TPC and TFC (r = 0.77) further suggests a partial overlap in their presence within the samples. Overall, the heat map confirms that flavonoid content is more closely associated with antioxidant activity than total phenolic content in the analyzed extracts.Fig. 7. Correlation among various assays, viz. TPC, TFC, DPPH, FRAP, and ABTS (p ≤ 0.05, where p denotes the probability value indicating statistical significance).
The principal component analysis (PCA) biplot (Fig. 8A) shows the distribution of plant extracts based on their phytochemical and antioxidant properties. The first principal component (PC1) accounts for 53.16% of the total variance, while the second principal component (PC2) explains 12.21%, together representing 65.37% of the variability in the dataset. The red-labelled sample points are distributed along the axes, with those positioned on the right side of PC1 (e.g., PMRDA, PMRDM, PMSDA, PMSDAq, PMLDA, and PMLDM) showing a strong positive association with antioxidant assays such as DPPH, FRAP, and ABTS, as indicated by the direction and length of the corresponding vectors. These samples are therefore characterized by high antioxidant activity. In contrast, samples located on the left side of PC1 (e.g., PMRFA, PMRFAq, and PMRFM) are negatively correlated with these variables, suggesting comparatively lower antioxidant potential. The vectors representing total phenolic content (TPC) and total flavonoid content (TFC) are oriented primarily along PC2, indicating their greater influence on the vertical separation of samples. The close alignment of DPPH, FRAP, and ABTS vectors suggests a strong positive correlation among these antioxidant assays. The clustering patterns observed in the biplot reflect distinct biochemical profiles among the extracts, enabling clear discrimination based on their phytochemical content and antioxidant capacity. The scree plot (Fig. 8B) showed a steep drop in the variance explained after the first component. PC1 accounted for nearly 87% of the total variance, while PC2 explained about 12%, and the remaining components (PC3–PC5) contributed insignificantly (≤ 1%). When compared with the broken-stick distribution (46, 28, 20, 14, and 9% for Components 1–5, respectively), only PC1 exceeded its expected threshold, indicating that it is the only component representing meaningful structural variation in the dataset. Therefore, PC1 was considered the principal informative component, whereas the subsequent components were not considered further due to their negligible contribution. The high variance explained by PC1 reflects a robust underlying structure in the dataset, supporting the reliability and interpretability of the PCA results.Fig. 8(A) Biplot graph based on the principal components analysis (PCA) depicting the phytochemical properties across the P. mollis. (B) Scree plot showing the percentage of variance explained by the principal components. DSAq dry stem aqueous extract, DSM dry stem methanol extract, DSA dry stem acetone extract, DLAq dry leaf aqueous extract, DLM dry leaf methanol extract, DLA dry leaf acetone extract, DRAq dry root aqueous extract, DRM dry root methanol extract, DRA dry root acetone extract, FSAq fresh stem aqueous extract, FSM fresh stem methanol extract, FSA fresh stem acetone extract, FLAq fresh leaf aqueous extract, FLM fresh leaf methanol extract, FLA fresh leaf acetone extract, FRAq fresh root aqueous extract, FRM fresh root methanol extract, FRA fresh root acetone extract.
The hierarchical cluster analysis (HCA) of Pogostemon mollis extracts (Fig. 9) demonstrated distinct clustering patterns reflecting variations in chemical composition across solvents and plant parts. Polar extracts, particularly aqueous and methanolic fractions of leaf and stem, formed closely related clusters, indicating high similarity in their phenolic-rich profiles and associated antioxidant activities. In contrast, acetone extracts from all plant parts grouped separately, representing a chemically divergent cluster with lower polarity–derived metabolites. Overall, the HCA clearly differentiates the extracts based on solvent polarity and phytochemical distribution, highlighting the compositional heterogeneity within P. mollis.Fig. 9. Hierarchical cluster analysis (HCA) of Pogostemon mollis extracts based on phytochemical composition and antioxidant parameters.
Qualitative phytochemical assay (UPLC Q-TOF MS–MS)
UPLC Q-TOF MS–MS is an advanced technique that combines pressurized liquid chromatography and mass spectrometry. It facilitates the separation of components from a compound mixture, while a mass spectrometer produces ions and separates them according to their mass-to-charge ratio. Results indicated the presence of a number of metabolites, including flavonoids, phenolics, toxins, and certain antibiotics. Methanolic extract of P. mollis was subjected to liquid chromatography coupled with Mass spectrometry as mentioned in materials and methods. UPLC-QTOF-MS/MS Analysis of P. mollis shows 99 compounds (Table 3, Figs. 10, Fig. 11, and Fig. 12). Compounds like the presence of important therapeutic secondary metabolites, including Anticancer Compounds (Camptothecin, Chryso-obtusin, Telithromycin), Antiviral Compounds (Zidovudine, Quinacetol), Phenolics (Sinapic acid), Anti-inflammatory (Resolvin D2, Resolvin E2), Antibiotics (Arbekacin, Nebramycin factor 4), Flavonoids (Luteolin, Chrysosplenetin, Tricetin), Terpenoids (Onchidal, (8)-Gingerol, (S)-Nerolidol), alkaloids (Kamahine C).Table 3. Qualitative analysis of phytochemicals in P. mollis using UPLC-Q-TOF–MS analysis.Sr. noCompound nameFormulaRTMass1N-acetyl-D-galactosamine enolC₁₄H₂₃NO₁₀2.80365.12CatalpolC₁₅H₂₂O₁₀2.88362.131- aminocyclohexanecarboxylic acidC₇H₁₃NO₂3.02143.14ZidovudineC₁₀H₁₃N₅O₄3.57267.153-hydroxy-cis, cis- muconic acidC₆H₆O₅3.73158.06Trans-4- Carboxymethylenebut-2- en-4-olideC₆H₄O₄3.74140.07Gentiobiosyl 2-methyl-6- oxo-2E,4E-heptadienoatC₂₀H₃₀O₁₃8.28478.28VanillolosideC₁₄H₂₀O₈8.98316.19VerbasosideC₂₀H₃₀O₁₂10.53462.2101,8- diazacyclotetradecane- 2,9-dioneC₁₂H₂₂N₂O₂11.04226.2115,6,7- trimethoxycoumarinC₁₂H₁₂O₅11.19236.1121-O-feruloyl-ß-D-glucosC₁₆H₂₀O₉11.22356.113QuinacetolC₁₁H₉NO₂11.52187.114De-O-methylsimmondsinC₁₅H₂₃NO₉11.59361.115O-1,4-a-L- dihydrostreptosyl- streptidine 6-phosphateC₁₄H₂₉N₆O₁₁11.93488.2166'- methoxypolygoacetophenosideC₁₅H₂₀O₁₀12.01360.117Caffeic aldehydeC₉H₈O₃12.02164.018Sinapic acidC₁₁H₁₂O₅12.02224.119Tuberonic acid glucosideC₁₈H₂₈O₉12.03388.220Luteolin 7-O-[ß-D- glucuronosyl-(1- > 2)-ß D- glucuronide]C₂₇H₂₆O₁₈12.57638.121Phenylethyl primeverosideC₁₉H₂₈O₁₀12.80416.222(7'R) -( +)-lyoniresinol 9’- glucosideC₂₈H₃₈O₁₃12.84582.223GardosideC₁₆H₂₂O₁₀12.92374.1241-(2,4,5- trimethoxyphenyl)-1,2 propanedioneC₁₂H₁₄O₅13.07238.125FenfuramC₁₂H₁₁NO₂13.10201.126MahalebosideC₁₅H₁₆O₈13.30324.127Podorhizol beta-D- glucosideC₂₈H₃₄O₁₃13.34578.2285,10- methenyltetrahydrofolateC₂₀H₂₂N₇O₆13.53456.229ArbekacinC₂₂H₄₄N₆O₁₀13.58552.330Luteolin 7-O-glucuronideC₂₁H₁₈O₁₂13.71462.1315-Megastigmen-7-yne- 3,9-diol 9-glucosideC₁₉H₃₀O₇14.00370.232Limonexic acidC₂₆H₃₀O₁₀14.09502.2337-Methyl-1,4,5- naphthalenetriol 4- [xylosyl-(1- > 6)- glucoside]C₂₂H₂₈O₁₂15.11484.234(-)-Matairesinol 4’- [apiosyl-(1- > 2)- glucoside]C₃₁H₄₀O₁₅15.11652.235p-coumaroyl quinic acidC₁₆H₁₈O₈15.11338.1364',5,6- trimethylscutellarein 7- glucosideC₂₄H₂₆O₁₁16.23490.137Chryso-obtusin glucosideC₂₅H₂₈O₁₂16.44520.238Beta-damascenoneC₁₃H₁₈O16.81190.139(8)-GingerolC₁₉H₃₀O₄17.07322.240CamptothecinC₂₀H₁₆N₂O₄17.19348.1419S,11R,15S-trihydroxy- 2,3-dinor-13E-prostaenoic acid- cyclo[8S,12R]C₁₈H₃₂O₅17.41328.242Myristic acidC₁₄H₂₈O₂17.46228.2435-Hydroxy-1-(4-hydroxyphenyl)-3- decanoneC₁₆H₂₄O₃17.70264.244Trinexapac-ethylC₁₃H₁₆O₅17.88252.1459,10-Dihydroxy-12,13- epoxyoctadecanoateC₁₈H₃₄O₅18.09330.246Abietic acidC₂₀H₃₀O₂18.49302.247Resolvin D2C₂₂H₃₂O₅19.15376.248HeptopargilC₁₃H₁₉NO19.23205.1493',4',5'-Trimethoxycinnamyl alcohol acetateC₁₄H₁₈O₅19.36266.150PhytosphingosineC₁₈H₃₉NO₃19.81317.35116-Hydroxy hexadecanoic acidC₁₆H₃₂O₃19.91272.252SuberosinC₁₅H₁₆O₃19.95244.153α-santoninC₁₅H₁₈O₃20.33246.154(2E,4E,6E)-2,6 dimethylocta-2,4,6 trienedialC₁₀H₁₂O₂20.34164.155Resolvin E2C₂₀H₃₀O₄20.35334.256ChrysosplenetinC₁₉H₁₈O₈20.46374.1575-O-MethylvisamminolC₁₆H₁₈O₅20.91290.15811beta,17beta Dihydroxy-17-methyl 5alpha-androstan-3-oneC₂₀H₃₂O₃21.17320.259NormethandroloneC₁₉H₂₈O₂21.54288.260(S)-nerolidol 3-O-[a-L rhamnopyranosyl-(1 > 4)-a-L rhamnopyranosyl-(1 > 2)-b-D glucopyranoside]C₃₃H₅₆O₁₄21.55676.461Kamahine CC₁₄H₂₀O₅21.59268.162Tricetin 3’,4',5'-trimethyl etherC₁₈H₁₆O₇21.71344.163SphinganineC₁₈H₃₉NO₂21.72301.36413-cis-retinolC₂₀H₃₀O21.79286.26510-hydroperoxy-8E,12Z octadecadienoic acidC₁₈H₃₂O₄21.80312.266Colneleic acidC₁₈H₃₀O₃21.80294.267(S)-nerolidol 3-O-[a-L rhamnopyranosyl-(1 > 4)-a-L rhamnopyranosyl-(1 > 2)-b-D glucopyranoside]C₃₃H₅₆O₁₄21.96676.468HostmanianeC₁₃H₁₈O₅22.53254.1693alpha,21-dihydroxy-D homo-5beta-pregn 17a(20)-en-11-oneC₂₂H₃₄O₃22.65346.370OnchidalC₁₇H₂₄O₃22.89276.271Gingerglycolipid BC₃₃H₅₈O₁₄23.28678.4723-α(S)-strictosidineC₂₇H₃₄N₂O₉23.44530.273Chryso-obtusinC₁₉H₁₈O₇23.56358.174Protomycinolide IVC₂₁H₃₂O₄23.68348.27516-feruloyloxypalmitateC₂₆H₄₀O₆23.73448.376Lauryl hydrogen sulfateC₁₂H₂₆O₄S23.91266.277Isopimara-7,15-dienolC₂₀H₃₂O24.03288.278AspidinolC₁₂H₁₆O₄24.09224.1792alpha hydroxypyracrenic acidC₃₉H₅₄O₇24.11634.4803-α(S)-strictosidineC₂₇H₃₄N₂O₉24.14530.2813-O-trans feruloyleuscaphic acidC₄₀H₅₆O₈24.35664.482TelocinobufaginC₂₄H₃₄O₅24.43402.283Nebramycin factor 4C₁₉H₃₈N₆O₁₁24.91526.384Beta-elemonic acidC₃₀H₄₆O₃25.14454.385Sterol 3-beta-D glucosideC₂₃H₃₈O₆25.35410.386F4-Neuroprostane (7 series)C₂₂H₃₄O₅25.41378.287Colneleic acidC₁₈H₃₀O₃25.42294.288Isopimara-7,15-dienolC₂₀H₃₂O25.47288.289Di-n-heptyl phthalateC₂₂H₃₄O₄25.64362.2903-oxo-5alpha-steroidC₂₂H₃₆O₃26.54348.391TelithromycinC₄₃H₆₅N₅O₁₀27.71811.5921-palmitoyl lysophosphatidic acidC₁₉H₃₉O₇P27.71410.293ProtoporphyrinC₃₄H₃₄N₄O₄27.72562.394Dihydrozeatin-9-N glucoside-O-glucosideC₂₂H₃₅N₅O₁₁27.78545.2952-undecyl-4(1H) quinolinone N-oxideC₂₀H₂₈NO₂28.36314.296Di-n-heptyl phthalateC_22_ H_34_ O_4_28.67362.297PolidocanolC₃₀H₆₂O₁₀28.79582.498Dihydroabietic acidC₂₀H₃₂O₂28.98304.299IntegerressineC₃₃H₃₈N₄O₄29.24554.3Fig. 10UPLC Q-TOF MS–MS Chromatogram of methanolic extracts of P. mollis.Fig. 11. Chemical composition profile of UPLC-Q-TOF–MS/MS-identified metabolites, classified into major phytochemical groups.Fig. 12. Some important bioactive compounds from the methanolic extract of P. mollis. (a) Quinacetol, (b) 8-Gingerol, (c) Zidovudine, (d) Luteolin, (e) p-Coumaroyl quinic acid, (f) p-Coumaroyl quinic acid, (g) Camptothecin, (h) Catalpol, (i) (S)-Nerolidol, (j) Kamahine C, (k) Chryso-obtusin, (l) Telocinobufagin, (m) 13-cis-Retinol, (n) Protoporphyrin, (o) Telithromycin, (p) Onchidal, (q) Verbasoside, (r) Nebramycin factor, 4 (s) Arbekacin, (t) Suberosin, (u) Resolvin E2, (v) Resolvin E2, (w) α-Santonin, (x) Caffeic aldehyde.
Essential oil profiling (GC–MS)
Gas chromatography relies on chromatograms, which are printouts displaying peaks representing different components of an essential oil, to separate substances. However, it cannot directly identify the substance responsible for a peak. Instead, comparison with known standards is necessary to make identifications. If a known standard appears at the same position as a peak in the chromatogram, the substance is assumed to be identified. Identifying components in essential oils can be challenging due to their complex compositions. To achieve precise identification, spectroscopic methods are often necessary. Recent advancements have simplified this process with the introduction of machines capable of conducting mass spectrometry immediately after gas chromatography separation. These machines perform a dual function within a single unit: first, separating the essential oil components via gas chromatography, and then individually identifying the isolated components through separate mass spectra. Each compound produces its own spectrum. However, interpreting these mass spectra is a complex process and is primarily facilitated by computerized reference libraries.
The oil from P. mollis was pale yellow in colour. GC–MS of the essential oil of P. mollis showing the presence of a total of 68 compounds. The essential oil yield (0.6%) is in this species. This compound list was given in (Table 4, Figs. 13, Fig. 14 & Fig. 15). The maximum representative compounds from P. mollis were lupeol (6.33%), alpha. -cyperone (7.15%), t (7.23%), globulol (5.07%), boronal (7.51%), guaia-10 (14),11-diene (2.31%) and 7-epi-Silphiperfol-5-ene (9.46%). Previous studies have highlighted compounds like cadina-1,4-diene (26.64%), sabinene (11.95%), beta-pinene (8.34%), beta-cubebene (7.76%), and alpha-pinene (5.95%)^30^. Caryophyllene oxide (CO), a bioactive sesquiterpene, is used in cancer treatment^31^.Table 4. Essential oil profiling of P. mollis by GC–MS/MS.Peak noCompound nameRTArea%1.Alpha-thujene6.6830.082.Alpha-Pinene6.8510.313.Sabinene8.0040.224.Beta-pinene8.1150.115.Cis-4-carene9.3290.046.D-Limonene9.6970.167.Gamma-terpinene10.6040.048.3-methylcyclopentenone12.5040.029.4-terpinenol14.5970.0610.2,6,11-trimethyldodecane16.8290.0411.Behenyl behenate17.5630.0212.Isopentacosane18.1160.0913.Alpha. -eudesmol18.3550.4314.Delta. -Eiemene18.5460.1915.Alpha.—cubebene18.8660.4616.Gamma.—muurolene19.1960.0317.4,4-dimethyl-3-(3-methylbut-3-enylidene)-2-methylenebicyclo [4.1.0] heptane19.6720.3618.7-epi-silphiperfol-5-ene19.9479.4619.Guaia-10(14),11-diene20.0342.3120.Tetradecane20.2690.1621.Caryophyllene20.5871.6522.1,1,4a-trimethyl-5,6-dimethylene-decalin20.7061.8223.Aromandendrene20.8283.4524.Gamma-patchoulene21.32214.9125.Humulene21.8190.2026.Alpha.—guaiene22.2381.1027.Beta.—vatirenene23.4121.1328.Isovalencenol23.6182.9729.Globulol24.3045.0730.4,10-aromadendranediol24.5550.3031.Boronal24.7037.5132.Caryophyllene oxide24.9527.2333.Diethyl phthalate25.6361.5834.Spathulenol26.6651.0435.Acetic acid, 3-hydroxy-6-isopropenyl-4,8a-dimethyl-1,2,3,5,6,7,8,8a-octahydronaphthalen-2-yl ester27.9004.1236.Eudesma-4,11-dien-2-ol27.9860.2237.Cembrane28.0740.3638.Lupeol28.6386.3339.Isopatchoulenone28.7960.4140.Allopregnanolone29.0330.5941.Retinal29.4511.8242.Alpha. -cyperone29.7887.1543.E, E, Z-1,3,12-nonadecatriene-5,14-diol29.9210.4644.Aristolone30.2040.2745.3alpha,7beta-dihydroxy-5beta,6beta-epoxycholestane30.7752.3746.Phytane31.3580.0147.2-butyloxycarbonyloxy-1,1,10-trimethyl-6,9-epidioxydecalin31.6960.6548.1,54-dibromotetrapentacontane31.8041.2249.Eicosane32.0030.0650.Phytyl acetate32.1181.0651.Diglycolic acid32.4220.9552.Carbonic acid32.5780.9753.Corymbolone32.7090.5954.Diene-2,8-dione32.7870.1455.Methyl palmitate33.0560.1056.Hexacosyl nonyl ether33.2820.5357.Hexadecane33.5850.7358.Tetrapentacontane33.7270.7159.Butyl isodecyl phthalate33.9530.2760.Ethyl palmitate34.6190.0461.2,3-dimethylnonadecane35.1420.2462.Dotriacontane35.6430.7363.Hexacontane37.2101.6164.2-methylhexacosane38.2860.0565.Pentatriacontane40.1730.0866.Tetracosane42.3900.1967.Phthalic acid44.6910.1468.Squalene49.9100.28Fig. 13GC–MS Chromatogram of Essential oil of P. mollis.Fig. 14GC–MS-based profiling of major compound classes in Pogostemon mollis essential oil.Fig. 15. Some important bioactive compounds from the essential oil of P. mollis. (a) Caryophyllene, (b) (-)-alpha-Cubebene, (c) Aromadendrene, (d) alpha-Guaiene, (e) Alpha-eudesmol, (f) 7-epi-Silphiperfol-5-ene, (g) Alpha-Cyperone, (h) 3α,7β-Dihydroxy-5β,6β-epoxycholestane, (i) 1,1,4a-Trimethyl-5,6-dimethylenedecahydronaphthalene, (j) Cembrane, (k) Humulene, (l) Spathulenol, (m) Gamma-Patchoulene, (n) Diethyl Phthalate, (o) Globulol, (p) Caryophyllene oxide, (q) Guaia-1(10),11-diene, (r) Isopatchoulenone, (s) beta-Vatirenene, (t) Boronal, (u) Lupeol, (v) Retinal, (w) Phytyl acetate.
Conclusion
This study provides a comprehensive investigation into phytochemical composition, essential oil profile, and antioxidant potential of P. mollis collected from Trivandrum district, Kerala. Antioxidant activity assessed through DPPH, FRAP, and ABTS assays revealed notable free radical scavenging and reducing capacities, particularly evident in dry aqueous and methanolic extracts. Biochemical analysis revealed substantial variability in total phenolic and flavonoid contents across different extracts, with dry methanolic leaf extracts exhibiting the highest TPC and TFC values. UPLC-QTOF-MS/MS analysis identified 99 bioactive metabolites, including pharmacologically relevant compounds like camptothecin, zidovudine, and luteolin, while GC–MS analysis identified 68 volatile constituents, with notable compounds such as lupeol, alpha-cyperone, and caryophyllene. Study revealed a strong statistical link between phenolic and flavonoid contents and antioxidant activity of P. mollis may serve as an effective natural antioxidant source. These findings emphasize the potential utility of this species in formulating bioactive compounds and validate its traditional use in herbal medicine for health-promoting purposes. Future studies, including in vivo investigations and bioactivity-guided fractionation, are warranted to further elucidate the pharmacological potential, therapeutic applicability of P. mollis.
The reference list from the paper itself. Each links out to its DOI / PubMed record.
- 1Harborne, J. B. Phenolic compounds. In J. B. Harborne (Ed.), Phytochemical methods: A guide to modern techniques of plant analysis (pp. 33–88). (1973).
- 2Saranya, P., Mugendhiran, S., & Rajesh Kumar, S. Primary phytochemical screening of leaf, stem and root extracts of endemic species of Pogostemon mollis Benth. in Nilgiri District. (2021).
- 3Yagi, S., Zengin, G., Cetiz, M.V., Cziáky, Z., Jeko, J., Bahşi, M., Çakılcıoğlu, U., Turumtay, H. & Aktumsek, A. (2025). Chemical Characterization, Antioxidant and Enzyme‐Inhibitory Activities of Different Extracts from Three Phlomis Species. Chemistry Open, 2500004.10.1002/open.202500004 PMC 1295788340351016 · doi ↗ · pubmed ↗