GENOVIS: a Python package for the visualization of population genetic analyses
Siavash Salek Ardestani, Elmira Mohandesan

TL;DR
GENOVIS is a Python package that simplifies the creation of high-quality, customizable population genetics visualizations for researchers with varying levels of bioinformatics expertise.
Contribution
GENOVIS introduces a unified, user-friendly tool for generating six key population genomics visualizations via both CLI and GUI interfaces.
Findings
GENOVIS supports the creation of SNP density heatmaps, ROH plots, genomic relationship matrix heatmaps, 3D PCA, admixture barplots, and Manhattan plots.
The package is accessible through both command-line and graphical interfaces, reducing the need for advanced coding skills.
GENOVIS is built on a flexible Python framework, enabling reproducible and customizable population genomics analyses.
Abstract
Despite its importance, generating clear and customisable figures remains challenging for researchers without a bioinformatic background. This is due to the fact that most population genetics tools target specific analyses and rely on language-specific scripting (e.g., R or Python), producing large amounts of non-interactive outputs. Moreover, many visualization tools are challenging to integrate into existing analytical pipelines or cross-platform environments, adding time-consuming and technically demanding steps. Therefore, there is a growing demand for powerful, user-friendly, and flexible visualization tools that enable researchers with varying levels of bioinformatic expertise to investigate and communicate a wide range of population genetic questions, using both simulated and empirical datasets. To address this need, we developed GENOVIS, a Python package available both as a…
Genes, proteins, chemicals, diseases, species, mutations and cell lines named across the full text — each resolved to its canonical identifier and authoritative record.
Click any figure to enlarge with its caption.
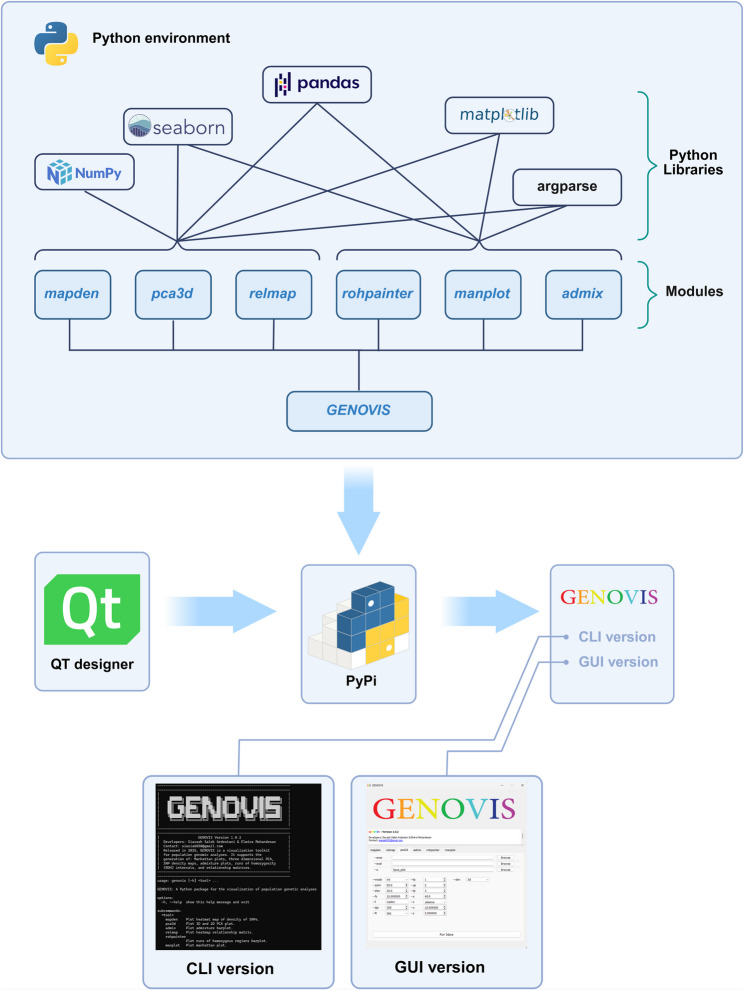 Figure 1
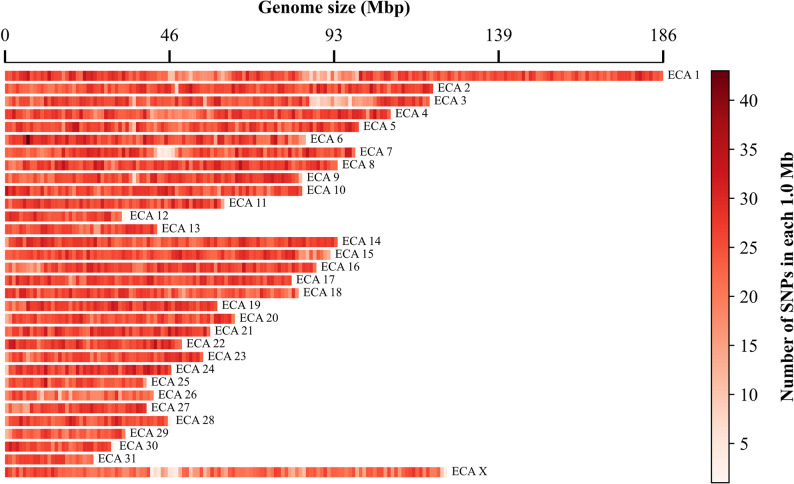 Figure 2
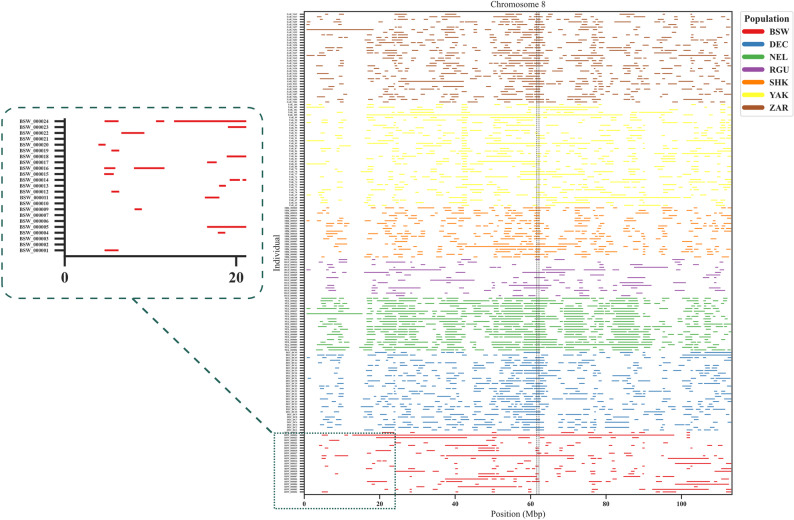 Figure 3
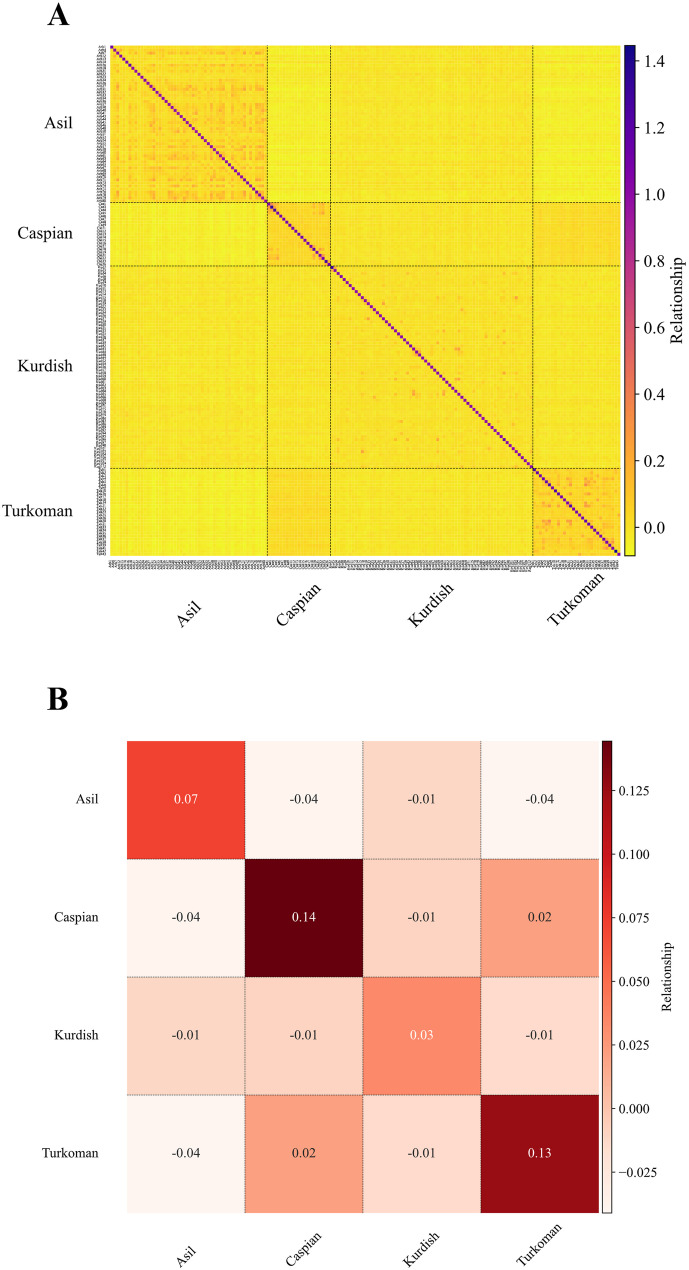 Figure 4
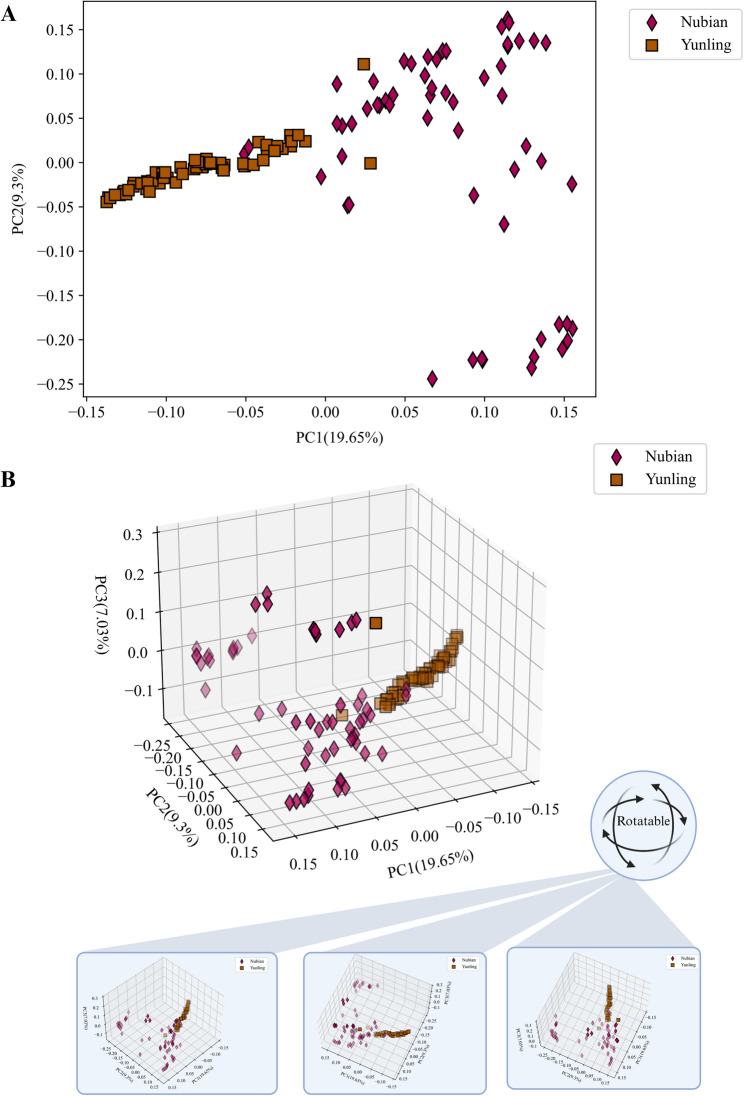 Figure 5
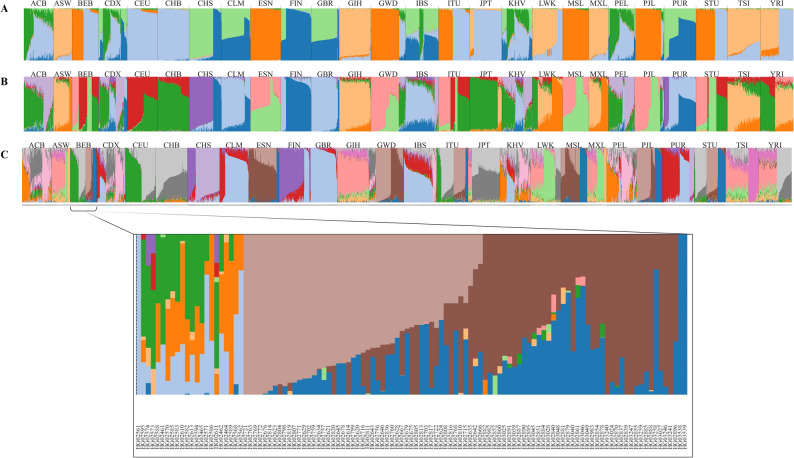 Figure 6
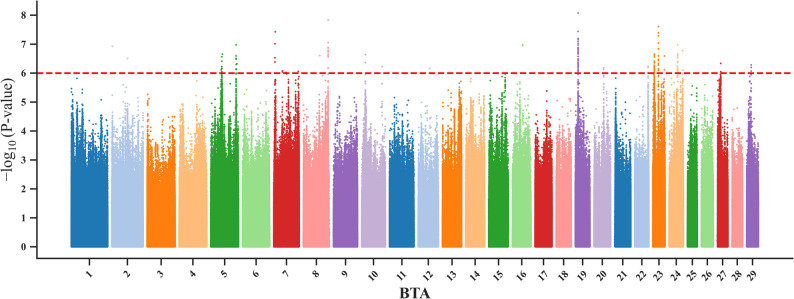 Figure 7
Peer Reviews
No public reviews on file for this paper yet. If you reviewed it on a platform where reviews are public (OpenReview, ICLR, NeurIPS, ICML), you can paste yours below so the community can read it here.
Videos
No videos yet. Explain this paper in a talk, walkthrough, or lecture? Add one.
Taxonomy
TopicsGenetic Associations and Epidemiology · Data Analysis with R · Health, Environment, Cognitive Aging