Categorization of household drinking water and sanitation service levels and associated determinants in Uganda
Betty Nakibuule, Henry Musoke Semakula, Denis Nseka, Hannington Wasswa, Carol Aboda, Precious Nampereza, Lydia Nabawanuka Namakula, Rawlance Ndejjo

TL;DR
This study examines access to safe water and sanitation in Uganda, finding significant inequalities linked to education, wealth, and region.
Contribution
The study provides national-level evidence on water and sanitation service levels in Uganda using the WHO/UNICEF JMP framework.
Findings
Most households use basic water services, with low safely managed water access in regions like Karamoja.
Higher education, wealth, and central/western region residence correlate with better water and sanitation service levels.
Rural areas and refugee settlements face the lowest service levels due to infrastructure and affordability issues.
Abstract
Achieving universal access to safe drinking water and sanitation remains a major challenge in Uganda, where persistent socioeconomic and spatial inequalities limit progress toward Sustainable Development Goal 6. While previous studies have largely focused on localized settings, national-level evidence applying the WHO/UNICEF Joint Monitoring Programme (JMP) service ladder framework is limited. This study aimed to address this gap. This study used secondary data from the 2018–2019 Uganda Malaria Indicator Survey. A total of 8,925 households were included, with data drawn from the Household Recode file. The dependent variables were household sources of drinking water and types of toilet facilities and these were classified according to the WHO/UNICEF JMP service ladder framework into safely managed, basic, limited, unimproved, and no service categories. Independent variables comprised a…
Genes, proteins, chemicals, diseases, species, mutations and cell lines named across the full text — each resolved to its canonical identifier and authoritative record.
Click any figure to enlarge with its caption.
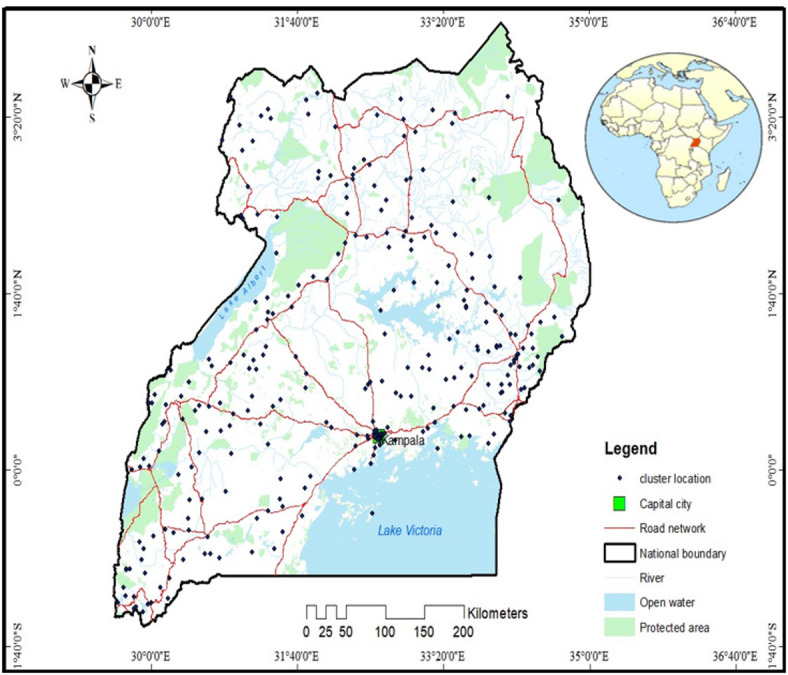 Figure 1
Peer Reviews
No public reviews on file for this paper yet. If you reviewed it on a platform where reviews are public (OpenReview, ICLR, NeurIPS, ICML), you can paste yours below so the community can read it here.
Videos
No videos yet. Explain this paper in a talk, walkthrough, or lecture? Add one.
Taxonomy
TopicsChild Nutrition and Water Access · Global Maternal and Child Health · Wastewater Treatment and Reuse
Introduction
Access to safe drinking water and adequate sanitation facilities is universally recognized as a foundational component for preventing diseases, promoting good health and wellbeing, enhancing education, boosting economic productivity, ensuring dignity, safety, and environmental sustainability^1^. These benefits highlight the critical need for continued investment and policy focus on enhancing water and sanitation infrastructure worldwide^2^. Despite these benefits, a significant portion of the global population still lacks access to clean water and adequate sanitation. As of 2022, over 2.2 billion people lacked safely managed drinking water, 703 million had no basic water services, 3.5 billion lacked safely managed sanitation, and 1.5 billion had no basic sanitation services^3^. Additionally, more than 2 billion people globally, live in water-stressed regions, a challenge exacerbated by climate change and population growth^4^. These disparities hinder progress toward achieving the Sustainable Development Goals (SDGs), particularly SDG 6, which aims to ensure availability and sustainable management of water and sanitation for all by 2030^5^.
The crisis is particularly more acute in Africa, where water and sanitation challenges remain widespread. More than 411 million people lack basic drinking water services, 208 million practice open defecation, and 829 million lack basic hygiene services, with nearly three-quarters of the population lacking access to safely managed sanitation^6^. Over 296 million people rely on unprotected wells and springs, and 115 million draw untreated surface water from lakes, rivers, and streams often contaminated due to open defecation and inadequate waste management^7^. Sub-Saharan Africa (SSA) bears a significant burden, with an estimated 7.8% of deaths due to diarrheal diseases linked to unsafe water, sanitation, and hygiene (WASH), with a risk factor attribution of 95.9%^7^. Furthermore, intermittent water supply is a persistent issue, with many households accessing water for only a few hours per day^8^.
Uganda exemplifies these regional challenges, with 18.9% of households depending on unimproved water sources and 49.7% lacking access to safely managed services^9^. These deficiencies expose communities to severe public health risks, increasing the prevalence of waterborne diseases such as cholera, dysentery, typhoid, hepatitis A, diarrheal diseases, and parasitic infections^10,11^. Beyond health implications, inadequate water and sanitation services contribute to economic losses, with global estimates indicating an annual loss of $260 billion due to these deficiencies^12^ Socially, the crisis exacerbates gender inequalities, and leads to environmental challenges such as water pollution^13^. The education sector is also affected, as students’ health, school attendance, and academic performance suffer^14^.
In SSA, numerous studies have documented persistent challenges in achieving universal access to safe water and adequate sanitation. Two recent review studies showed that WASH challenges in SSA stem from intertwined institutional weaknesses such as poor policy coordination, weak regulatory enforcement, and limited community participation coupled with economic and political constraints, including chronic underinvestment, corruption, and inequitable cost-sharing arrangements^15,16^. These structural limitations are further compounded by geographical barriers in informal settlements and remote rural areas, where extending water and sanitation infrastructure remains both costly and technically demanding, resulting in persistent service gaps^15,16^. Evidence from another systematic review focusing on internally displaced persons (IDP) camps across SSA reported additional barriers, including insecurity in conflict-affected zones, inadequate community involvement in Water, Sanitation and Hygienic planning, significant logistical challenges in hard-to-reach areas, and an overreliance on donor-driven, short-term interventions that undermine long-term sustainability^17^. Regional SDG 6 assessments further reveal slow progress between 2015 and 2020, only minimal improvements were observed, with more than half of SSA’s population still lacking access to safely managed drinking water, improved sanitation facilities, basic hygiene services, and safe wastewater treatment^18^. This regional assessment attributed these deficits to inadequate and aging infrastructure, weak governance and regulatory systems, rapid population growth, and chronic underinvestment in the WASH sector. Consequently, large segments of the population remain dependent on unreliable, unsafe, or informal water and sanitation services, perpetuating health risks and deepening socio-economic inequalities^19^.
In Uganda, a growing body of research on water and sanitation has been conducted. Nationally, one study developed a WASH Resource Index (WRI), mapped high-risk WASH practices and child diarrhea geographically, and assessed how the WRI relates to child diarrhea at both cluster and individual levels^20^. Another study focused on identifying the key determinants influencing household transitions across different levels of the Drinking Water Supply Systems (DWSS) service ladder^21^. Other studies have focused particularly within informal urban settlements. For example, Ssemugabo et al.^22^ documented pronounced inequities in Kampala’s slums, showing that the quality and reliability of water services remain substantially below national averages, despite the settlements’ physical proximity to urban infrastructure. Additional evidence from a slum-based study in Kampala highlighted that individual-level factors, including knowledge, beliefs, language barriers, and financial limitations hinder adoption of WASH interventions^23^. The same study revealed broader social and structural constraints such as negative peer influences, unsupportive household and community environments, cultural norms, limited space for sanitation facilities, and political interference, all of which collectively reduce the uptake of WASH services^23^. Similarly, Dickson-Gomez et al.^24^ found that even where facilities are physically present, they often fail to provide safe, continuous, and dignified services due to operational breakdowns, overcrowding, poor maintenance, and environmental contamination. A more recent and comprehensive investigation applied the Joint Monitoring Programme (JMP) service ladder classification in the Kinawataka informal settlement and reported that drinking water services were predominantly basic (75%), while sanitation services were largely limited (88%), with only 12% and 7% meeting safely managed standards, respectively^25^. The same study underscored that the existence of water points or latrines alone does not ensure safely managed service levels; rather, factors such as reliability, distance, cost, and the number of users per facility critically shape the quality and safety of WASH access^25^.
Although substantial research on water and sanitation in Uganda has examined WASH inequities, high-risk practices, health outcomes, and service conditions, most studies report only the type or functionality of water and sanitation technologies (e.g., pit latrines, boreholes, tap water) rather than categorizing these services according to the WHO/UNICEF JMP service ladder, namely safely managed, basic, limited, unimproved, or surface water^26–28^. Moreover, much of the current evidence is drawn from Kampala’s informal settlements or small community-based studies, and while these provide valuable insights, they do not offer a nationally representative assessment of household drinking water and sanitation service levels across Uganda. Moreover, previous studies have not comprehensively applied the WHO/UNICEF Joint Monitoring Programme (JMP) service ladder to categorize service levels at the national scale, nor have they systematically modelled the demographic and socio-economic determinants driving variations in these service levels. Importantly, no study to date has utilized the nationally representative 2018 Malaria Indicator Survey (MIS), which uniquely captures both general households and refugee settlements, to evaluate water and sanitation access using JMP standards. As a result, critical national-level patterns, regional disparities, and vulnerabilities among refugee populations remain underexplored.
This study addresses these critical gaps by providing the first national-level JMP-based categorization and statistical modelling of drinking water and sanitation service levels in Uganda. Using a nationally representative dataset (i.e. 2018–2019 Malaria Indicator survey dataset), the study aimed to: (1) categorize household drinking water and sanitation service levels in Uganda using the WHO/UNICEF Joint Monitoring Programme (JMP) framework^29^; and (2) model the demographic and socio-economic determinants influencing these service levels across the country. This study makes three key important and novel contributions to the WASH literature in Uganda and sub-Saharan Africa. First, this study is the first to categorize drinking water and sanitation service levels across all Ugandan households using the internationally standardized WHO/UNICEF JMP framework. This enables direct alignment with SDG 6 monitoring and global comparability. Second, by including refugee households captured in the MIS 2018, the study provides unique insights into WASH inequalities across both host communities and refugee populations, an area rarely examined at national scale. Third, the study’s results provide actionable information for national planners, development partners, and humanitarian actors, supporting more efficient resource allocation and targeted strategies to reduce service inequities.
Materials and methods
Study area
The study focused on Uganda, a landlocked country situated in Eastern Africa^30^. Uganda shares borders with Kenya to the east, South Sudan to the north, the Democratic Republic of Congo to the west, Rwanda to the southwest, and Tanzania to the south^31^. The country spans a total area of 241,551 square kilometers, including 200,523 square kilometers of land^31^. Uganda is home to over 1.5 million refugees from countries such as South Sudan, Somalia, Sudan, the Democratic Republic of Congo, Ethiopia, Eritrea, Rwanda, and Burundi^32^. With a projected population of 44.2 million people^33^, Uganda is divided into 15 regions as depicted in Fig. 1.
Data sources
This study analyzed secondary data from the 2018–2019 Uganda Malaria Indicator Survey (UMIS) which adopted a cross sectional survey design. The Malaria Indicator survey dataset was obtained from the Demographic and Health Survey program (DHS) after permission was granted. This DHS program is responsible for collecting and disseminating accurate, nationally representative data on health and population in developing countries^34^. The UMIS dataset is the first national wide survey in Uganda to include households in refugee settlements^34^. Data was extracted from the household record file and the unit of analysis was a household. Standardized questionnaires were designed to collect the demographic, social, economic and environmental information of the surveyed households^35^.
Fig. 1. Study area and UMIS cluster locations. The map was created using UMIS cluster GPS location data and generated in ArcGIS version 10.8 (Esri, Redlands, CA, USA; https://www.esri.com). DHS cluster coordinates are geographically displaced to protect respondent confidentiality.
Study population and sample size
A total of 8957 households participated in the Uganda Malaria Indicator Survey (UMIS), conducted between December 2018 and February 2019. The survey utilized the 2014 Uganda Population and Housing Census frame and employed a two-stage stratified sampling method. In the first stage, the sampling frame was stratified by geographic areas (urban, rural, and refugee settings) based on the enumeration areas from the 2014 census. This stage involved selecting clusters from each stratum and listing households within the chosen clusters. In the second stage, households to be interviewed were selected from these listings. This study utilized the Household Recode (HR file) dataset, which was obtained from the DHS Program website (https://dhsprogram.com/). The Household Recode dataset contained both male and female-headed households that had complete data on access to drinking water sources and sanitation facilities. Households were eligible for this study if they participated in the 2018–2019 Uganda Malaria Indicator Survey and provided reliable responses to key WASH indicators. Households with incomplete or missing data on water and sanitation variables were excluded. Additionally, those that did not meet the survey’s eligibility criteria or had inconsistencies in reporting were omitted from the analysis. After applying the inclusion and exclusion criteria, the final sample size for this study comprised 8925 households.
Variables
Dependent variables
This study utilized two dependent variables: sources of drinking water and types of toilet facilities. In line with World Health Organization and United Nations Children’s Fund (WHO/UNICEF) Joint Monitoring Programme (JMP) standards, the study classified household drinking water sources and toilet facility types into internationally recognized service ladders (Table 1). These classifications were derived from the WHO/UNICEF Progress Reports on Household Drinking Water, Sanitation, and Hygiene (2000–2024)^29,36^, which provide the latest global benchmarks for tracking SDG 6. This standardized classification ensured comparability with global monitoring systems and provided a robust framework for assessing service inequality across Uganda. It also enabled a more nuanced interpretation of access beyond simple technology type, capturing important aspects such as reliability, safety, and the burden of collection time.
Table 1. Categorization of dependent variables based on the drinking water and sanitation service levels of the JMP framework.Service levelsDescriptiona) Drinking water1) Safely managedDrinking water from an improved source that is accessible on premises, available when needed and free from faecal and priority chemical contamination. These include piped water on premises, protected well on premises, bottled water, sachet water, rain water and other treated water.2) BasicDrinking water from an improved source (e.g., piped water, borehole, protected well, protected springs) within 30 min round trip, including queuing.3) LimitedDrinking water from an improved source that requires more than 30 min to collect water.4) UnimprovedDrinking water from unprotected sources (e.g., unprotected well, unprotected spring).5) Surface water (no service)Drinking water collected directly from rivers, lakes, ponds, streams, or canals.b) Sanitation1) Safely managedUse of improved sanitation facility that is not shared with other households and where excreta are safely disposed of or treated on-site. These include flush to piped sewer/septic, VIP latrine, pit latrine with slab on household premises2) BasicUse of improved sanitation facility that is not shared with other households. Examples: flush/pour-flush to piped sewer/septic tank, ventilated improved pit latrine.3) LimitedUse of an improved facility shared with other households.4) UnimprovedUse of pit latrines without a slab, bucket toilets, hanging toilets, or other unimproved facilities.5) Open defecationDisposal of human feces in fields, forests, bushes, open bodies of water, beaches, no facility, or other open spaces.
Independent variables
Identification and categorization of independent variables was based on empirical evidence^25,37–40^ and the standardized categories within the MIS dataset as shown in Table 2. This categorization was necessary for the smooth running of the logistic regressions.
Table 2. Categorization of independent variables.No.Independent variablesCategories1Age(1) < 30, (2) 31–39, (3) 40–49, (4) 50–59, (5) ≥ 60)2Sex(1) Male, (2) Female3Education level(1) No education, (2) primary, (3) secondary, (4) Higher4Religion(1) No religion (2) Anglican, (3) Catholic, (5) Muslim, (5) Seventh Day Adventists, (6) Born again5Place of residence(1) Rural, (2) Urban, (3) Refugee settlement6Household wealth status(1) Poor, (2) Middle, (3) Rich7Household size(1) 1– 3, (2) 4– 6, (3) 7+8Region of residence(1) Kampala, (2) North Buganda, (3) South Buganda, (4) Busoga, (5) Bukedi, (6) Bugisu, (7) Teso, (8) Karamoja, (9) Lango, (10) Acholi, (11) West Nile, (12) Bunyoro, (13) Tooro, (14) Ankole, (15) Kigezi9Distance to water source(1) On premises (2) < 19 min, (3) 20**–29 min, (4) Above 30 min10Cluster altitude(1) < 1000 m, (2) 1001–**1500 m, (3) above 1500 m
Data analysis
Four types of analyses were performed. Multicollinearity was assessed using the Variance Inflation Factor (VIF). All predictors showed acceptable VIF values (range: 1.12–2.11), indicating no serious multicollinearity. Descriptive analysis of the data was conducted resulting into summarized statistics, bivariate analysis was used to assess the association between the outcome and the independent variables using the chi-square test, and multivariate ordinal logistic regression modelling was conducted to assess the magnitude of the associations after including controls (Eq. 1).
\documentclass[12pt]{minimal} \usepackage{amsmath} \usepackage{wasysym} \usepackage{amsfonts} \usepackage{amssymb} \usepackage{amsbsy} \usepackage{mathrsfs} \usepackage{upgreek} \setlength{\oddsidemargin}{-69pt} \begin{document}$$\:Log\frac{{P(Y_{i} \le \:j}}{{P(Y_{i} < j}}\: = \alpha \:_{j} + \:\beta \:_{1} X_{{1i}} + \:\beta \:_{{12}} X_{{2i}} + \:\beta \:_{3} X_{{3i}} + \cdots \:\beta \:_{k} X_{{ki}} ,\:{\mathrm{j}} = 1,2, \ldots \:,{\mathrm{J}} - 1$$\end{document}where Y_i_ represents the ordinal outcome variable (water or sanitation service level) for household i; j denotes the category threshold; α_j_ are the intercepts (cut-points); X_ki_ are the independent variables; and β_k_ are the estimated regression coefficients. A positive coefficient indicates higher likelihood of being in a higher service level category.
The ordinal logistic regression model was used because household drinking water and sanitation service levels are ordinal, ranging from safely managed, basic, limited, unimproved, to no service. This model appropriately accounts for the natural ordering of the categories, unlike linear or multinomial regression, allowing for the estimation of the effects of demographic and socio-economic factors on the likelihood of households achieving higher versus lower service levels. Post-estimation diagnostics were conducted to assess the adequacy of the ordinal logistic regression models. Model fit was evaluated by comparing the log-likelihoods of the fitted models with those of the intercept-only models and by examining McFadden’s pseudo R². These diagnostics were applied to both the drinking water and sanitation models to confirm model robustness and ensure the reliability of the estimated associations.
The multivariate ordinal logistic results were presented with coefficients with 95% confidence intervals (CI). The p-values of < 0.05 were set for statistical significance. The inclusion criteria for variables in the multivariable ordinal logistic regression were set at P < 0.05. This threshold was chosen to ensure that only variables with a statistically significant contribution to explaining the outcome were included, thereby enhancing the robustness of the findings. To account for disproportionate sampling and nonresponse, DHS weights provided as six-digit integers in the HR file dataset were normalized (i.e. divided by 1,000,000) and used to provide weights to the data^41^. To adjust for the effect of the complex survey design, the DHS variables of primary sampling unit, strata and sampling weights were used in the analysis. All data entries and statistical analyses were conducted in JMP software, Excel and Stata 18 (Stata Corp, College Station, TX, USA). All methods were performed in accordance with the relevant guidelines and regulations.
Results
Categorization of household drinking water and sanitation service levels in Uganda
Table 3, shows that access to drinking water services varied widely across Uganda. Nationally, basic water services accounted for the largest share at 67.8%, with most regions, particularly Busoga, Acholi, Lango, West Nile, and central Uganda showing high dependence on improved sources located within a 30-minute collection time. In contrast, only 8.8% of households had safely managed drinking water, and several regions, including Karamoja, reported no safely managed access. Safely managed services were most common in Kampala and parts of central and western Uganda but remained low overall, indicating limited availability of water on premises that is both accessible and free from contamination. Unimproved sources accounted for 17.0% of households, with the highest concentrations in Acholi, West Nile, Bunyoro, Tooro, and Ankole. Further, 5.9% of the households relied on surface water, especially in Bunyoro, Tooro, Karamoja, and Ankole, underscoring persistent dependence on untreated sources. Only 0.5% of households used limited water services, reflecting a small but notable segment with improved yet time-intensive access.
Sanitation service levels showed a slightly better distribution of improved options but remained constrained by sharing and regional disparities (Table 3). Nationally, 43.6% of households had safely managed sanitation, with higher concentrations in West Nile, Tooro, Ankole, and Acholi. However, limited sanitation, representing improved but shared facilities, constituted 49.7% of households and was widespread across nearly all regions, reflecting the dominant mode of sanitation access. Basic sanitation was extremely low (0.2%), indicating that very few households had private improved facilities. Unimproved sanitation comprised 1.7%, although higher levels were observed in Kigezi, Ankole, and selected eastern regions. Open defecation, while 4.8% nationally, was disproportionately concentrated in Karamoja, where it was the predominant sanitation practice.
Household and contextual characteristics further highlighted regional inequalities in service access (Table 3). Younger household heads were more common in central Uganda, while older household heads were concentrated in eastern and western regions. Female-headed households accounted for 30.4% nationally but exceeded 70% in Karamoja. Educational attainment remained low overall, with 80.1% of households headed by individuals with only primary education. Walking time to water sources showed that 43.7% of households required more than 30 min, especially in Karamoja and several northern regions. Large households (seven or more members) comprised 27.4%, and poverty was widespread, affecting 44.8% of households, particularly in Karamoja, West Nile, and Acholi. Most households (68.6%) resided in rural areas, and 6.8% lived in refugee settlements, primarily in West Nile and Acholi.
Table 3. National and regional categorization of drinking water and sanitation service levels (n = 8925).VariablesRegion of residenceNationaln (%)Kampala n (%)South Bugandan (%)North Bugandan (%)Busogan (%)Bukedin (%)Bugisu n (%)Teso n (%)Karamojan (%)Langon (%)Acholin (%)West Nilen (%)Bunyoron (%)Tooro n (%)Ankolen (%)Kigezi n (%) Drinking water service level Safely managed789 (8.8)171 (1.9)164(1.8)40(0.5)16(0.2)9(0.1)43(0.5)32(0.34)0(0.0)46(0.5)16(0.2)9(0.1)6(0.1)28(0.3)49(0.6)35(0.4)Basic6055 (67.8)305(3.4)413(4.6)362(4.1)411(4.6)476(5.3)357(4.0)446(5.0)443(5.0)499(5.6)538(6.0)778(8.7)398(4.5)453(5.1)266(3.0)297(3.3)Limited48 (0.5)0(0.0)6(0.1)7(0.1)4(0.1)0(0.0)1(0.0)12(0.1)0(0.0)0(0.0)0(0.0)0(0.0)19(0,2)0(0.0)1(0.0)0(0.0)Unimproved1516(17.0)5(0.1)95(1.1)86(1.0)10(0.1)12(0.1)45(0.5)7(0.1)4(0.0)90(1.0)159(1.8)108(1.2)172(1.9)192(2.3)135(1.5)76(0.9)Surface water526 (5.9)0(0.)34(0.4)40(0.5)14(0.16)1(0.0)37(0.41)0(0.0)36(0.4)25(0.3)9(0.1)16(0.2)90(1.0)77(0.9)115(1.3)78(0.9) Sanitation service level Safely managed3895(43.6)420(4.7)464(5.2)296(3.3)148(1.7)213(2.4)210(2.4)106(1.2018(0.2)90(1.0)238(2.7)419(4.7)212(2.4)292(3.3)268(3.0)109(1.1)Basic16(0.2)17(0.2)0(0.0)0(0.0)1(0.0)0(0.0)0(0.0)0(0.0)0(0.0)0(0.0)1(0.0)0(0.0)0(0.0)0(0.0)5(0.1)0(0.0)Limited4441(49.7)41(0.5)237(2.7)233(2.6)282(3.2)255(2.9)269(3.0)312(3.5)103(1.2)544(6.1)355(4.0)417(4.7)446(5.0)436(4.9)263(3.0)330(3.7)Unimproved155(1.7)2(0.0)4(0.0)5(0.0)13(0.2)8(0.0)1(0.0)1(0.0)0(0.0)0(0.0)25(0.3)4(0.0)8(0.1)14(0.2)28(0.3)46(0.5)Open defecation428(4.8)1(0.0)7(0.1)1(0.0)11(0.1)22(0.3)3(0.0)78(0.9)362(4.1)26(0.3)103(1.2)71(0.8)19(0.2)8(0.1)3(0.0)1(0.0) Age of household head Less than 302161(24.2)178(37.0)163(22.9)148(27.7)98(21.5)131(26.3)112(23.2)124(25.0)191(39.5)175(26.5)184(25.5)265(29.1)190(27.7)198(26.4)108(19.1)114(23.5)Between 31–391907(21.3)110(22.9)179(25.1)105(19.6)85(18.7)92(18.5)102(21.1)119(23.9)91(18.8)156(23.6)162(22.4)197(21.6)158(23.1)192(25.6)116(20.5)103(21.2)Between 40 − 491904(21.3)80(16.6)173(24.3)105(19.6)109(24.0)91(18.3)96(19.9)98(19.7)62(12.8)138(20.9)156(21.6)167(18.3)152(22.2)130(17.3)137(24.2)98(20.2)Between 50 − 591455(16.3)79(16.4)95(13.3)91(17.0)69(15.2)70(14.1079(16.4)69(13.9)60(12.4)98(14.9)104(14.4)132(14.5)88(12.9)108(14.4)105(18.5)71(14.6)60 and above1509(16.9)34(7.1)102(14.3)86(16.1)94(20.7)114(22.9)94(19.5)87(17.5)79(16.4)93(14.1)116(16.1)150(16.5)97(14.20122(16.30101917.8)100(20.6) Sex of household head Female2716(30.4)164(34.1)193(27.1)145(271)100(22.0)108(21.7)90(18.6)126(25.4)346(71.6)173(26.2)295(40.9)417(45.8)158(23.1)194(25.9)168(29.6)117(24.1)Male6219(69.6)317(65.9)519(72.9)390(72.9)355(78.0)390(78.3)393(81.4)371(74.7)137(28.4)487(73.8)427(59.10494(54.2)527(76.9)556(74.1)399(70.4)369(75.9) Education level No education699(7.8)3(0.6)15(2.1)23(4.3)36(8.0)21(4.2)13(2.7)24(4.8)209(43.3)55(8.3)76(10.5)158(17.3)58(8.5)85(11.3)44(7.8)40(8.2)Primary7155(80.1)357(74.2)540(75.8)430(80.4)378(83.1)431(86.6)399(82.6)415(83.5)264(54.7)571(86.5)586(81.2)709(77.8)546(79.7)587(78.3)472(83.3)404(83.1)Secondary880(9.9)95(19.6)124(17.4)73(13.6)38(8.4)40(8.0)55(11.4)41(8.3)8(1.7)26(3.9)50(6.9)37(4.1)68(9.9)66(8.8)39(6.9)32(6.6)Higher201(2.2)26(5.4)33(4.6)9(1.7)3(0.7)6(1.2)16(3.3)17(3.4)2(0.4)8(1.2)10(1.4)7(0.8)13(1.9)12(1.6)12(2.1010(2.1) Religion of household No religion73(0.8)1(0.2)3(0.4)691.1)03(0.6)1(0.2)007(1.1)10(1.4)6(0.7)20(2.9)24(3.2)6(1.1)1(0.2)Anglican2877(32.4)128(26.6)166(23.3)137(25.6098(21.50193(38.8)248(51.4)206(41.5)115(23.8)242(36.7)99(14.2)241(27.4)240(35.0)327(43.6)260(45.9)251(51,7)Catholic3279(36.9)132(27.4)295(41.4)163(30.5)104(22.9)169(33.9)117(24.2)199(40.0)318(65.8)336(50.9)486(69.9)432(49.0)275(40.20229(30.5)199(35.1)122(25.1)Muslim1224(13.8)116(24.1)134(18.8)113(21.1)139(30.6)73(14.7)18(3.7)7(1.4)9(1.9)3(0.5)11(1.6)123(14.0)25(3.7)29(3.9)17(3.0)25(5.1)Seventh-day Adventist (SDA)148(1.7)6(1.3)12(1.7)25(4.7)3(0.7)0004(0.8)3(0.5)010(1.1)13(1.9)43(5.7)11(1.9)18(3.7)Born again1288(14.5)98(20.37)102(14.3091(17.0)111(24.4)60(12.1)99(20.5)85(17.1037(7.7)69(10.5)89(12.8)69(7.8)112(16.4098(13.1)74(13.1)69(14.2) Cluster altitude (Meters) Less than 1000578(6.5)000000000151(21.6)616(69.6)50(7.3)68(9.4)00Between 1001 − 15007275(82.5)481(100)712(100)535(100)455(100)498(100)309(64.0)497(100)403(83.4)633(100)547(78.4)245(27.7)635(92.7)575(79.6)347(61.2)56(11.5)1501 and above967(11.0)00000174(36.0)080(16.6)0024(2.7)079(10.9)220(38.8)430(88.5) Walk time distance (minutes) On premises1805(20.2)292(61.5)294(41.3)129(24.1)46(10.1)23(4.6)66(13.7)66(13.3)3(0.6)107(16.2)72(10.0)200(22.0)53(7.7)51(6.8)91(16.1)95(19.6)Less than 191967(22.0)154(32.0)164(23.0)123(22.9)88(19.3)125(25.1)126(26.1)77(15.5)14(3.0)127(19.2)132(18.3)138*15.2)185(27.0)209(27.9)166(29.3)107(22.0)Between 20 − 291260(14.1)17(3.53)60(8.4)62(11.6)61(13.4)122(24.5)101(20.9)52(10.5)48(10.0)100(15.2)103(14.3)149(16.4)115(16.8)112(14.9)104(18.3)60(12.4)30 and above3903(43.7)14(2.9)194(27.3)221(41.30260(57.1)228(45.8)190(39.3)302(60.8)418(86.5)326(49.4)415(57.5)424(46.5)332(48.5)378(50.4)206(36.3)224(46.1) Household size Between 1 − 33044(34.1)244(50.7)269(37.8)204(38.1)144(31.65)176(35.3)169(35.0)129(26.0)142(29.4)207(31.4)175(24.2)227(24.9)194(28.3)212(28.3)197(34.7)142(29.2)Between 4 − 63447(38.6)166(34.5)292(41.0)212(39.6)155(34.1)197(39.6)177(36.7)159(32.0)257(53.2)272(41.2)294(40.7)354(38.9)282(41.2)287(38.3)218(38.5)232(47.7)7 and above2444(27.4)71(14.8)151(21.2)119(22.2)156(34.3)125(25.1)137(28.4)209(42.0)84(17.4)181(27.4)253(35.0)330(36.2)209(30.5)251(33.5)152(26.8)112(23.1) Household wealth status Poor3999(44.8)091(12.8)140(26.17185(40.7)284(57.0)207(42.9)354(71.2)470(97.3)472(71.5)558(77.3)768(84.3)331(48.30328(43.7)212(37.4)201(41.4)Middle1586(17.8)2(0.4)119(16.7)113(21.1)112(24.6)101(20.3)109(22.6)32(6.4)4(0.8)66(10.0)59(8.2)67(7.4)143(20.9)219(29.2)103(18.2)148(30.5)Rich3349(37.5)479(99.6)502(70.5)282(52.70158(34.70113(22.70167(34.6)111(22.3)9(1.9)122(18.5)105(14.5)76(8.3)211(30.8)203(27.1)252(44.4)137(28.2) Place of residence Rural6130(68.6)0327(45.9)387(72.30348(76.5)425(85.3)350(72.5)424(85.3)456(94.4)554(83.9)544(75.4)502(55.1)558(81.5)574(76.5)350(61.7)378(77.8)Urban2201(24.6)481(100)385(54.1)148(27.7)107(23.5)73(14.7)133(27.5)73(14.7027(5.6)106(16.1)151(20.9)26(2.9)101(14.7)92(12.3)134(23.6)108(22.2)Refugee settlements604(6.8)00000000027(3.74)383(42.0)26(3.8)84(11.2)83(14.6)0
Categorization of household drinking water and sanitation service levels by type of residence
Table 4, shows that access to drinking water and sanitation services varied markedly by residence type, demonstrating substantial structural inequities between urban, rural, and refugee settlement populations. Safely managed drinking water was highest in urban areas, where 5.5% of households met this standard, compared with 2.0% in rural areas and only 0.3% in refugee settlements. The majority of urban and rural households relied on basic water services, though the burden was considerably heavier in rural areas, where 50.0% depended on basic services versus 15.9% in urban settings. Refugee settlements showed the greatest reliance on basic water services (6.3%), but also exhibited disproportionately high dependence on surface water (0.3%) relative to their population size, reflecting limited access to improved sources. Unimproved water sources were predominantly rural (11.3%), while urban households showed the lowest reliance (2.0%), and refugee settlements remained vulnerable, with 1.1% depending on unimproved sources.
Patterns in sanitation access aligned closely with those of drinking water, but with even sharper disparities (Table 4). Urban areas showed the highest share of safely managed sanitation services (15.9%), followed by rural areas (19.6%) and refugee settlements (3.4%). Rural households, however, were overwhelmingly reliant on limited sanitation services at 41.2%, compared with 6.9% in urban areas and 2.5% in refugee settlements. Refugee settlements showed the lowest access to safely managed sanitation and remained disproportionately dependent on inadequate options, including open defecation, which affected 3.2% of households. Open defecation was most prevalent in rural homes (7.1%), indicating persistent sanitation deficits in non-urban regions. Although urban areas demonstrated comparatively better access to improved sanitation, open defecation remained present (0.6%), highlighting that even urban settings retain pockets of deprivation.
Table 4Categorization of drinking water and sanitation service level by type of residence.VariablesUrban (2,145, 24.0%)Rural (6,177, 69.2%)Refugee settlements(603, 6.8%) Drinking water service levels Safely managed486(5.5)175(2.0)3(0.0)Basic1,419(15.9)4,458(50.0)566(6.3)Limited19(0.2)31(0.4)0(0.0)Unimproved181(2.0)1,004(11.3)11(0.1)Surface water40(0.5)509(5.7)23(0.3) Sanitation service levels Safely managed1,419(15.9)1,746(19.6)338(3.4)Basic21(0.2)0(0.0)3(0.0)Limited616(6.9)3,680(41.2)227(2.5)Unimproved35(0.4)118(1.3)6(0.0)Open defecation54(0.6)633(7.1)29(0.32)
Factors associated with drinking water service levels in Uganda
Analysis of the association between the independent variables and drinking water service levels revealed that the majority of the examined factors were significantly associated with the type of water service accessed by households (Table 5). Out of the ten variables included in the model, eight demonstrated statistically significant associations (p < 0.05). Significant predictors included sex of household head, education level, cluster altitude, walk-time distance to water sources, region of residence, household size, household wealth status, and place of residence. These variables showed varying relationships with safely managed, basic, limited, unimproved, and surface water service levels. In contrast, age of the household head and religion did not show statistically significant associations (p > 0.05), indicating limited influence on household drinking water service levels in the context of this dataset. Overall, the results highlight substantial socio-demographic and spatial disparities in access to improved drinking water services across households in Uganda.
Table 5Statistical association between the independent variables and the drinking water serve levels.Independent variablesDependent variable: Drinking water serve levelsSafely managedBasicLimitedUnimprovedSurface water P-values %CI%CI%CI%CI%CI Age of household head 0.189Less than 309.4[7.1,12.3]71.8[67.2,76.0]0.8[0.3,2.2]12.6[8.8,17.7]5.4[3.8,7.5]Between 31**–398.9[6.1,12.6]65.9[56.8,73.9]0.6[0.2,1.5]18.3[10.6,29.8]6.3[4.4,9.0]Between 40– 497.7[5.3,10.9]67.3[57.7,75.7]0.3[0.1,1.0]18.4[10.4,30.4]6.4[4.5,9.0]Between 50–5910.2[7.1,14.5]62.5[49.2,74.2]0.2[0.1,0.5]21.8[10.2,40.8]5.3[3.4,8.0]60 and above8.2[5.9,11.3]70[62.9,76.2]0.8[0.3,1.8]15.1[10.6,21.1]5.9[4.2,8.3] Sex of household head 0.03Female8.9[6.6,11.9]68.3[60.7,75.0]0.6[0.2,1.4]17.1[10.7,26.2]5.1[3.6,7.3]Male8.8[6.7,11.5]67.5[59.8,74.4]0.5[0.3,1.0]16.9[10.2,26.8]6.2[4.5,8.5] Highest education level < 0.01No education1.4[0.6,2.9]75.2[67.9,81.3]016.4[10.9,24.0]7[4.6,10.3]Primary8.4[6.5,10.9]67.4[59.8,74.2]0.6[0.3,1.2]17.4[10.8,26.9]6.2[4.5,8.3]Secondary13.6[9.5,19.0]65.9[55.3,75.1]0.2[0.1,0.7]16.5[7.6,32.4]3.9[2.0,7.2]Higher28.9[21.3,37.8]64.5[56.4,71.9]0.3[0.1,1.6]5[2.2,10.9]1.2[0.3,4.6] Religion of the household 0.544No religion5.3[1.5,17.1]59.1[41.1,75.0]0.4[0.0,2.6]22.4[11.3,39.4]12.9[5.8,26.3]Anglican7.9[5.6,11.0]67.7[61.0,73.8]0.5[0.3,1.1]15.9[10.8,23.0]7.9[5.5,11.3]Catholic9.1[7.1,11.7]67.7[61.5,73.3]0.5[0.2,1.2]17.6[12.4,24.3]5.1[3.6,7.0]Muslim10.4[6.5,16.1]65.5[46.8,80.4]0.9[0.2,4.8]19.6[6.2,47.5]3.6[1.6,7.7]Seventh-day Adventist6.8[3.1,14.6]65.1[53.9,74.8]019.6[11.6,31.1]8.5[4.5,15.3]Born again9.5[6.0,14.5]69.9[60.8,77.7]0.3[0.1,1.2]15.2[8.3,26.1]5.1[3.4,7.7] Cluster altitude (Meters) <0.01*Less than 10001.1[0.4,3.3]90.7[81.2,95.7]0.4[0.0,2.5]4.6[1.9,11.0]3.1[1.0,9.2]Between 1001–150010[7.5,13.1]66.5[57.7,74.3]0.6[0.3,1.2]18[10.3,29.5]5[3.4,7.1]1500 and above6[3.3,10.7]61.5[48.0,73.5]017.3[11.3,25.5]15.2[8.6,25.4] Walk time distance (minutes) < 0.01*On premises40.5[31.0,50.6]45.4[37.1,54.0]1.3[0.5,3.0]11.7[3.0,36.0]1.2[0.5,2.8]Less than 191.7[1.0,2.8]74[67.6,79.6]0.8[0.3,2.2]15[10.8,20.6]8.4[5.5,12.6]Between 20–291[0.2,6.0]72[62.6,79.8]0.3[0.1,1.6]19.8[12.5,29.9]6.9[4.7,10.0]30 and above0.3[0.1,0.8]73.6[65.5,80.4]0.1[0.1,0.3]19.5[13.0,28.2]6.5[4.5,9.2] Region of residence < 0.01Kampala40.3[28.7,53.0]58.7[46.4,70.0]01[0.4,2.8]0South Buganda22.6[14.5,33.6]56.8[41.7,70.7]0.9[0.2,3.5]15.7[6.6,32.8]4[1.5,10.2]North Buganda5[2.5,9.7]55.4[25.2,82.1]1.3[0.4,4.2]34.3[8.9,73.4]4.1[1.3,12.3]Busoga3.9[0.8,16.5]88.2[72.2,95.6]0.9[0.4,2.3]2[0.8,4.6]4.9[0.9,23.9]Bukedi1.7[0.4,6.9]96[92.1,98.0]02.2[1.0,4.6]0.1[0.0,0.9]Bugisu8.3[2.7,23.1]69.4[46.2,85.7]0.1[0.0,0.5]9.2[3.4,22.3]13[4.0,35.2]Teso7.7[1.3,34.7]90.7[67.2,97.9]0.7[0.1,5.0]0.9[0.2,3.7]0Karamoja092.7[84.9,96.6]01.2[0.2,7.7]6.2[2.6,13.8]Lango7.6[2.9,18.7]77[64.7,86.0]013.1[6.3,25.3]2.2[0.8,6.1]Acholi2.6[1.0,6.8]74.6[60.9,84.7]021.2[11.7,35.3]1.5[0.2,9.1]West Nile1[0.3,3.4]82.5[72.6,89.4]014.4[8.5,23.3]2[0.9,4.5]Bunyoro0.8[0.3,2.1]60.2[47.8,71.5]2.1[0.7,5.9]27.4[18.6,38.4]9.5[4.3,19.8]Tooro2.5[1.4,4.4]61.2[49.6,71.7]028.6[19.6,39.7]7.7[3.6,15.5]Ankole8.2[4.4,14.8]51.8[38.2,65.1]0.1[0.0,1.0]21.8[12.8,34.6]18.1[11.9,26.4]Kigezi7.7[4.2,14.0]64.6[52.1,75.3]013.7[7.2,24.5]13.9[7.0,25.9] Household size < 0.01Between 1–*312.6[9.5,16.6]63.3[53.8,71.8]1.3[0.7,2.5]17.8[9.3,31.5]5[3.5,7.1]Between 4– 66.2[4.7,8.2]70.4[63.0,76.9]0.2[0.1,0.5]17.2[10.8,26.2]6[4.4,8.0]7 and above7.8[5.2,11.5]69.7[63.4,75.2]0[0.0,0.1]15.7[11.2,21.4]6.9[4.5,10.3] Household wealth status < 0.01Poor0.6[0.3,1.1]71.2[60.8,79.7]0.4[0.2,0.8]20.5[12.2,32.5]7.4[5.2,10.3]Middle2.7[1.6,4.5]70.8[63.4,77.2]0.9[0.3,2.9]18.5[12.9,25.7]7.1[4.7,10.6]Rich21.6[17.5,26.4]62.3[55.4,68.7]0.6[0.3,1.1]12[6.8,20.3]3.5[2.4,5.1] Place of residence < 0.01Rural3.6[2.6,5.0]67.5[56.9,76.5]0.7[0.3,1.3]21[12.0,33.9]7.3[5.2,10.2]Urban25.7[20.1,32.2]62.9[55.1,70.1]0.3[0.1,0.8]9.2[5.5,14.9]1.9[0.8,4.4]Refugee settlements0.7[0.2,2.5]88.7[73.5,95.7]04.9[1.0,21.5]5.8[1.6,19.0] P-value significant at 0.05, %=percentage, CI = Confidence interval.
Factors associated with sanitation service levels in Uganda
In Table 6, all examined independent variables showed statistically significant associations with sanitation service levels (p < 0.05). The results indicate clear socio-demographic and spatial disparities in access to safely managed sanitation.
Table 6. Statistical association between the independent variables and the sanitation serve levels.Independent variablesDependent variable: Sanitation serve levelsSafely managedBasicLimitedUnimprovedOpen defecationP-values%CI%CI%CI%CI%CI Age of household head < 0.01Less than 3047.3[41.7,53.0]0.3[0.1,0.8]44.2[39.0,49.6]1.3[0.8,2.2]6.8[5.4,8.5]Between 31**–3944.5[38.9,50.3]0.1[0.0,0.5]49.6[43.7,55.5]1.9[1.2,2.9]3.8[2.9,5.1]Between 40– 4942[37.1,47.1]0.1[0.0,0.4]51.5[46.2,56.7]2.4[1.3,4.6]4.0[3.0,5.3]Between 50–**5942.4[36.4,48.7]0.3[0.1,1.0]51.7[44.9,58.4]1.4[0.8,2.4]4.2[3.0,5.8]60 and above40.1[35.4,45.1]0[0.0,0.1]53.5[48.8,58.2]1.5[0.9,2.7]4.8[3.6,6.3] Sex of household head < 0.01Female48.5[43.5,53.6]0.3[0.1,0.6]41.3[36.6,46.2]1.4[0.9,2.4]8.4[6.7,10.6]Male41.4[37.0,46.0]0.1[0.1,0.3]53.4[48.6,58.1]1.9[1.2,2.8]3.2[2.5,4.1] Highest education level < 0.01No education30.2[23.3,38.2]0.3[0.0,1.8]53.3[45.8,60.7]1.5[0.8,2.6]14.8[11.2,19.3]Primary41.5[37.8,45.4]0.1[0.1,0.3]52.1[48.1,56.1]1.8[1.2,2.9]4.4[3.6,5.4]Secondary62[53.1,70.1]0.4[0.1,1.5]35.4[27.3,44.3]1.6[0.8,3.2]0.7[0.3,1.5]Higher82.6[73.0,89.2]0.8[0.1,5.8]14.6[8.9,22.8]0.4[0.1,2.7]1.7[0.3,9.2] Religion of the household 0.02No religion38.6[22.3,57.9]057.6[38.7,74.5]1.6[0.2,10.7]2.2[0.5,8.5]Anglican41.6[37.3,45.9]0.2[0.1,0.4]51.8[47.5,56.2]2.3[1.3,4.2]4.1[3.0,5.6]Catholic41.8[37.4,46.3]0.2[0.1,0.6]49.7[45.3,54.1]1.4[0.9,2.2]6.9[5.5,8.7]Muslim48.3[36.9,59.8]0.2[0.1,0.9]48.1[36.1,60.3]1.2[0.6,2.5]2.3[1.2,4.1]Seventh-day Adventist43.2[31.6,55.5]047.1[33.6,61.0]6.9[1.6,25.6]2.9[0.7,10.6]Born again47.6[42.1,53.2]0.2[0.0,0.7]47.3[41.9,52.8]1.4[0.8,2.3]3.5[2.4,5.1] Cluster altitude (Meters) < 0.01Less than 100053[42.0,63.8]036.9[27.4,47.6]1.8[0.7,4.3]8.3[5.3,12.6]Between 1001**–**150044.3[39.4,49.4]0.2[0.1,0.4]49.7[44.5,54.9]1[0.7,1.6]4.7[3.7,6.0]1500 and above33.7[26.0,42.4]056.6[47.3,65.5]6.9[3.0,14.8]2.9[1.2,6.5] Walk time distance (minutes) < 0.01On premises70.2[61.7,77.6]0.6[0.3,1.1]26.4[18.9,35.4]0.6[0.2,1.5]2.2[1.4,3.6]Less than 1947.6[41.2,54.0]0.1[0.0,0.4]46.8[40.7,53.0]3[1.7,5.4]2.5[1.6,3.9]Between 20**–2936.6[32.3,41.0]0.1[0.0,0.8]57.2[52.6,61.7]1.7[0.9,3.3]4.5[3.0,6.5]30 and above31.5[27.8,35.5]0.1[0.0,0.5]59.5[55.6,63.4]1.6[1.1,2.3]7.2[5.8,9.0] Region of residence < 0.01Kampala86.9[78.4,92.3]2.3[1.2,4.5]10[5.3,18.0]0.3[0.1,1.3]0.5[0.1,3.0]South Buganda65.6[51.3,77.6]033.2[21.6,47.3]0.3[0.1,1.0]0.9[0.3,2.4]North Buganda46[30.5,62.2]052.9[36.1,69.1]1[0.3,3.3]0.2[0.0,1.2]Busoga33.4[21.7,47.7]0.3[0.0,1.8]60.7[47.6,72.3]3.2[1.6,6.5]2.4[1.4,4.3]Bukedi40.9[31.8,50.7]052.6[43.5,61.5]1.8[0.8,4.0]4.7[3.1,7.2]Bugisu46.5[31.2,62.6]052.5[36.3,68.3]0.2[0.0,1.4]0.7[0.2,2.4]Teso19.3[9.1,36.2]063.3[50.4,74.5]0.2[0.0,1.2]17.3[9.9,28.5]Karamoja2.5[0.8,7.6]019.5[10.9,32.5]078.0[63.4,87.9]Lango15[7.9,26.7]080.9[70.7,88.1]04.1[2.5,6.5]Acholi38.8[25.5,54.0]0.2[0.0,1.4]43.1[31.5,55.5]3[1.2,7.3]14.9[8.8,24.2]West Nile44.3[34.0,55.2]046.2[36.4,56.3]0.5[0.2,1.5]9.0[6.5,12.5]Bunyoro30.9[23.8,39.1]066[58.3,72.9]0.7[0.3,1.6]2.4[1.1,5.2]Tooro38.7[25.5,53.7]057.2[42.1,71.1]2.1[0.8,5.1]2.1[0.9,4.5]Ankole46.6[38.1,55.3]0.7[0.2,2.7]46.6[36.8,56.6]5.7[1.8,16.8]0.4[0.1,1.7]Kigezi22.1[16.4,29.1]068.2[59.9,75.5]9.4[4.8,17.7]0.3[0.0,1.9] Household size < 0.01Between 1–*346.1[40.4,51.9]0.2[0.1,0.6]46.2[40.0,52.4]2.2[1.2,3.9]5.4[4.2,6.9]Between 4– 642.5[38.5,46.5]0.1[0.0,0.3]50.3[46.2,54.4]1.6[1.0,2.4]5.5[4.5,6.8]7 and above42.1[37.6,46.7]0.2[0.1,0.6]53.2[48.7,57.8]1.4[0.9,2.3]3.0[2.2,4.2] Household wealth status < 0.01Poor20.7[16.7,25.3]0.1[0.0,0.5]66.9[61.3,72.0]2.1[1.4,3.2]10.3[8.4,12.5]Middle34.1[29.9,38.5]062.7[58.4,66.8]2.2[1.4,3.6]1.0[0.5,1.9]Rich75.4[71.3,79.2]0.4[0.2,0.8]23[19.4,27.1]1.1[0.5,2.4]0.1[0.0,0.3] Place of residence < 0.01Rural32.3[28.7,36.2]059.7[55.5,63.8]2[1.2,3.3]5.9[4.6,7.5]Urban70.8[62.7,77.9]0.6[0.3,1.2]25.9[19.5,33.6]1.1[0.5,2.4]1.5[0.6,3.6]Refugee settlements58.5[44.7,71.1]0.4[0.1,3.2]34.6[22.1,49.6]0.9[0.3,2.7]5.5[3.5,8.6] P-value significant at 0.05, %=percentage, CI = Confidence interval.
Magnitude of association between the independent variables and the drinking water and sanitation service levels
In order to determine the magnitude of association between the independent and the dependent variables (drinking water and sanitation service levels), an ordinal logistic regression was performed and the results are presented in Tables 7 and 8. The ordinal logistic regression analysis provides important insights into how household and contextual characteristics influence progression across the established drinking water and sanitation service levels in Uganda. Overall, positive coefficients indicate a higher likelihood of households accessing better service levels, while negative coefficients signal a greater likelihood of remaining in lower-quality service levels.
Drinking water service levels factors
In Table 7, households headed by males demonstrated higher likelihood of accessing higher water service levels (β = 1.115) compared with female-headed households. Educational attainment showed a more pronounced effect. Households with higher education were significantly more likely to move upward along the service ladder (β = 1.618), suggesting that education enhances the ability to access safer and more reliable water options. Walking distance to the household’s water source emerged as a strong determinant of service level. Households located within 19 min of a water source (β = 2.123) and those between 20 and 29 min (β = 2.143) had substantially higher odds of accessing better service levels relative to households whose water was on the premises. These positive coefficients reflect the fact that many improved water supplies in Uganda, such as boreholes or public taps, are typically off premises. In contrast, households walking 30 min or more recorded a negative coefficient (β = − 2.092), indicating significantly lower likelihood of accessing improved or safely managed water and a greater likelihood of relying on limited, unimproved, or surface water sources. Regional disparities remain pronounced. Households in South Buganda (β = 1.579), North Buganda (β = 1.434), West Nile (β = 0.739), Bunyoro (β = 1.317), Tooro (β = 1.289), and Ankole (β = 1.647) demonstrated higher likelihoods of accessing improved water services. Conversely, households in Bukedi (β = − 0.752), Teso (β = − 0.954), and Karamoja (β = − 0.923) had substantially lower likelihood of moving into higher service levels, reflecting regional inequalities in water infrastructure and service provision.
Household economic status also played a critical role. Middle-income households (β = 0.578) and especially wealthy households (β = 1.155) were more likely to access higher water service levels compared with poor households, highlighting the importance of economic capacity in securing improved water access. Regarding place of residence, households located in urban areas (β = 1.676) had significantly greater likelihood of accessing higher service levels, consistent with the concentration of piped networks and safely managed services in urban centers. In contrast, households in refugee settlements (β = − 1.249) were far less likely to ascend to higher service levels and more likely to rely on limited or unimproved water sources.
Table 7. Ordinal logistic regression analysis for the magnitude of association between the independent variables and household’s water service levels in Uganda.Independent variablesCoefficientstd. err.tP>|t|[95% C.I] Sex of the household head Male1.1150.098-1.180.04*[-0.31,0.08] Highest education level Primary-0.2080.135-1.550.12[-0.47,0.06]Secondary0.1210.170-0.710.48[-0.46,0.21]Higher1.6180.287-2.150.03*[-1.18,0.05] Walk time distance (minutes) Less than 192.1230.8012.65< 0.01*[0.56,3.690]Between 20**–292.1430.7782.76< 0.01[0.61,3.671]30 and above-2.0920.8082.59< 0.01[0.50,3.638] Region of residence South Buganda1.5790.3051.900.04*[-0.02,1.178]North Buganda1.4340.8001.790.04*[-0.141,3.01]Busoga-0.1150.393-0.290.77[-0.888,0.66]Bukedi-0.7520.361-2.090.03*[-1.461,0.042]Bugisu0.5200.5470.950.34[-0.556,1.597]Teso-0.9540.324-2.90< 0.01*[-1.600,0.307]Karamoja-0.9230.424-2.180.03*[-1.758,-0.089]Lango-0.2530.371-0.680.49[-0.983,0.477]Acholi0.4810.3851.250.21[-0.277,1.238]West Nile0.7390.3921.880.04*[-0.033,1.511]Bunyoro1.3170.4153.17< 0.01*[0.500,2.133]Tooro1.2890.4053.18< 0.01*[0.493,2.087]Ankole1.6470.5423.04< 0.01*[0.580,2.713]Kigezi0.9140.6861.330.18[-0.436,2.263] Household size Between 4**–60.1780.1091.640.10[-0.036,0.391]7 and above0.1690.1071.520.13[-0.048,0.372] Household wealth status Middle0.5780.152-3.80< 0.01[-0.878,0.279]Rich1.1550.162-7.13< 0.01[-1.474,0.837] Place of residence Urban1.6760.323-2.100.03*[-1.312,0.416]Refugee settlements-1.2490.273-4.55< 0.01*[-1.789,0.709]* P-value significant at 0.05, std. err.= standard error, t = t-statistic, CI = Confidence interval.
Sanitation service levels factors
The ordinal logistic regression analysis revealed significant gradients in sanitation service levels across household demographic, socioeconomic, and spatial characteristics (Table 8). Age of the household head showed a clear upward progression, with households headed by individuals aged 31–39 (β = 1.198), 40–49 (β = 2.343), and 50–59 (β = 3.248) increasingly more likely to fall within higher sanitation service levels compared with the youngest group. This pattern suggests that older household heads may prioritize or have better resources for improved sanitation. Male-headed households also exhibited a positive association with sanitation access (β = 1.297), indicating a greater likelihood of accessing improved or safely managed facilities compared with female-headed households. Education demonstrated a strong influence on sanitation outcomes. Households headed by individuals with secondary education (β = 1.289) and particularly those with higher education (β = 1.807) were more likely to occupy higher sanitation service levels. This underscores the role of education in promoting sanitation awareness, investment, and adoption of improved technologies.
Walking distance to sanitation facilities also influenced service levels. Households located less than 19 min from a sanitation option had a strong positive association (β = 1.463), and those at a distance of 20–29 min (β = 0.676) also tended toward higher service levels, though to a lesser extent. However, households walking 30 min or more to a water source showed a negative association (β = − 0.657), suggesting that long distances impede access to improved sanitation and increase reliance on unimproved or open defecation options. Regional differences were substantial. Households in Busoga (β = 0.694), Teso (β = 1.315), Karamoja (β = 4.399), Lango (β = 0.909), and Kigezi (β = 1.364) showed positive coefficients, indicating a higher likelihood of accessing improved sanitation. Notably, the very high coefficient for Karamoja reflects substantial regional improvements or service concentration, distinguishing it significantly from other regions.
Socioeconomic status strongly shaped sanitation outcomes. Middle-income households (β = 1.897) and rich households (β = 2.363) exhibited markedly higher tendencies toward higher sanitation service levels, demonstrating the critical role of economic capacity in securing improved and safely managed sanitation. Spatial characteristics also played a role. Households in urban areas (β = 1.452) were more likely to access higher sanitation service levels than rural households, reflecting better infrastructure and greater service availability in urban settings. In contrast, households in refugee settlements (β = − 1.856) had a substantially lower likelihood of accessing improved sanitation, pointing to persistent service challenges and infrastructural limitations in these locations.
Table 8. Ordinal logistic regression analysis for the magnitude of association between the independent variables and household’s access to sanitation service levels in Uganda.Independent variablesCoefficientstd. err.tP>|t|[95% C.I] Age of household head Between 31–391.1980.1071.850.04*[-0.012,0.410]Between 40– 492.3430.1143.00< 0.01*[0.118,0.568]Between 50**–593.2480.0992.49< 0.01[0.052,0.443]60 and above0.1770.0981.800.073[0-0.017,0.372] Sex of the household head Male1.2970.0843.52< 0.01[0.131,0.463] Highest education level Primary-0.1210 0.128-0.940.35[-0.374,0.133]Secondary1.2890.165-1.760.04*[-0.614,0.0347]Higher1.8070.308-2.62< 0.01*[-1.414,0.200] Religion of the household Anglican-0.0810.389-0.210.84[-0.848,0.686]Catholic-0.1430.393-0.360.72[-0.917,0.631]Muslim-0.2500.387-0.650.52[-1.011,0.511]Seventh-day Adventist0.1580.5120.310.76[-0.849,1.166]Born again-0.2310.400-0.580.56[-1.018,0 0.556] Walk time distance (minutes) Less than 191.4630.1283.61< 0.01*[0.211,0.715]Between 20**–290.6760.1285.30< 0.01[0.424,0.927]30 and above-0.6570 0.1125.85< 0.01[0.436,0.878] Region of residence South Buganda0.0270.3790.070.94[-0.719,0.774]North Buganda0.1390.4030.350.73[-0.653,0.932]Busoga0.6940.4001.730.04*[-0.094,1.481]Bukedi-0.1760.410-0.430.67[-0.983,0.631]Bugisu-0.1680.426-0.400.69[-1.007,0.669]Teso1.3150.4512.92< 0.01*[0.428,2.201]Karamoja4.3990.5817.57< 0.01*[3.257,5.543]Lango0.9090 0.3662.48< 0.01*[0.189,1.629]Acholi0.7490.5171.450.15[-0.266,1.766]West Nile0.2830.5010.570.57[-0.703,1.269]Bunyoro0.5980.4081.460.14[-0.205,1.401]Tooro0 0.2430.4270.570.57[-0.598,1.083]Ankole0.5400.3821.410.16[-0.211,1.292]Kigezi1.3640.4622.95< 0.01*[0.456,2.273] Household size Between 4–60.0180.0770.230.82[-0.133,0.169]7 and above-0.1270 0.101-1.260.21[-0.327,0.072] Household wealth status Middle1.8970 0.128-7.00< 0.01*[-1.149,0.645]Rich2.3630.172-13.7< 0.01*[-2.121,2.250] Place of residence Urban1.4520.165-2.75< 0.01*[-0.776,-0.128]Refugee settlements-1.8560.352-5.27< 0.01*[-2.549,-1.162]P-value significant at 0.05, std. err.= standard error, t = t-statistic, CI = Confidence interval.
Model Goodness-of-Fit (Water and Sanitation)
Post-estimation diagnostics indicated that both ordinal logistic regression models demonstrated satisfactory goodness-of-fit. For the drinking water service model, the log-likelihood improved substantially from − 7988.03 in the null model to − 6396.44 in the fitted model, with a McFadden’s pseudo R² of 0.199, indicating acceptable explanatory power. Similarly, the sanitation service model showed strong model performance, with the log-likelihood improving from − 8787.53 (null model) to − 6534.15 in the fitted model and a McFadden’s pseudo R² of 0.256, reflecting robust model fit and explanatory capacity. Overall, these results demonstrate that the fitted models adequately explained variation in water and sanitation service levels and provided a substantial improvement over intercept-only models.
Discussion
This study provides the first national-level assessment of drinking water and sanitation service levels in Uganda using the WHO/UNICEF Joint Monitoring Programme (JMP) classification, combined with ordinal logistic regression to examine their key determinants. The findings reveal significant disparities across regions, settlement types, and socioeconomic groups, highlighting persistent structural barriers to achieving safely managed services. These results mirror broader patterns documented across sub-Saharan Africa (SSA), where inequalities in access remain a central obstacle to meeting SDG 6 targets.
Drinking water service levels
The results reveal substantial disparities in drinking water service levels across Uganda, a pattern widely echoed in recent WASH scholarship across sub-Saharan Africa. The predominance of basic drinking water services (67.8%) aligns with findings from Kampala-based studies by Tumwebaze et al.^25^, which similarly reported heavy reliance on improved but off-premises water sources and very limited access to safely managed services in both slum and peri-urban settings. These findings are further supported by the 2000–2024 WHO/UNICEF Progress on Household Drinking Water, Sanitation and Hygiene reports, which note that safely managed drinking water coverage in SSA remains among the lowest globally, with most households dependent on basic or limited services^28,35^. This persistent reliance reflects broader structural challenges faced by many SSA countries, including Uganda, in expanding piped, on-premises, and quality-controlled water systems to all households. The extremely low share of safely managed services nationally (8.8%), and their near absence in regions such as Karamoja, is consistent with regional analyses indicating slow progress in Eastern and Southern Africa, particularly in rural and semi-arid areas where infrastructural expansion is costly and logistically demanding^18^. Conversely, the concentration of safely managed services in Kampala and parts of central and western Uganda supports evidence that urban centers benefit disproportionately from networked water systems, reinforcing spatial inequalities documented by Beard and Mitlin^42^ and Ssemugabo et al.^23^.
The continued dependence on unimproved and surface water in regions such as Bunyoro, Tooro, and Karamoja underscores long-standing structural vulnerabilities in rural and remote areas of Uganda^27^ and mirrors trends observed across other SSA countries^15,43^. Similar findings from Ethiopia, Tanzania, and northern Uganda suggest that geography, water scarcity, and limited infrastructure investment drive reliance on unsafe water sources, particularly where groundwater is inaccessible or highly variable^44^.These patterns support broader regional evidence indicating that rural communities face disproportionate challenges due to hydrological variability, dispersed settlements, and constrained institutional capacity^44,45^. Notably, however, the higher-than-expected proportion of surface water users in Tooro and Ankole diverges from earlier studies reporting greater dependence on groundwater sources in rural Uganda^43,45^. This difference may reflect local environmental pressures, seasonal depletion of shallow wells, or contamination of traditional water sources, factors that merit further investigation.
Refugee settlements experienced the most severe drinking water deficits, with almost no safely managed services and heightened reliance on unimproved and surface water compared with urban and rural populations. This finding is consistent with studies in Uganda’s refugee-hosting districts, which attribute poor water safety to aging infrastructure, inconsistent funding, and high operational demands^46^. It also aligns with recent WASH assessments in humanitarian settings across SSA, which highlight chronic infrastructural constraints, rapid population turnover, and dependence on emergency water provision, such as trucking and temporary boreholes, as key barriers to sustainable safe water access s^17^. Collectively, these results reinforce the widely documented reality that refugee settlements remain among the most underserved and structurally disadvantaged populations in the region.
Sanitation service levels
The sanitation service results further deepen the picture of widespread inequality across Uganda. The relatively high national proportion of safely managed sanitation (43.6%) contrasts sharply with findings from settlement-level studies in informal urban areas. For instance, Tumwebaze et al.^25^ reported safely managed sanitation as low as 7% in high-density Kampala slums, where overcrowding, shared facilities, and poor waste containment undermine service quality. This contrast suggests that while urban informal settlements perform poorly, many rural and peri-urban households may be achieving safely managed standards through private, improved latrines with adequate containment and disposal mechanisms^26^.
The concentration of safely managed sanitation in regions such as West Nile, Tooro, Ankole, and Acholi is particularly noteworthy, as national assessments, including the most recent census typically classify these regions as having moderate but not exceptional sanitation coverage^9^.This discrepancy implies that service quality within improved rural sanitation systems may be higher than previously recognized, possibly driven by household investment, NGO-led programming, or region-specific sanitation campaigns. These findings highlight the need for further sub-regional analysis to understand the drivers of unexpectedly strong sanitation outcomes in these areas.
The divergence between national-level results and earlier settlement-level studies underscores the substantial variability in sanitation performance across different community types. While slums and other high-density settlements consistently show extremely low safely managed sanitation (often below 10%)^25^, broader nationally representative analyses, including this study, capture a more complex landscape in which some rural and peri-urban households achieve higher service levels. This reinforces the value of national-scale JMP-aligned assessments, which can reveal inequalities that localized case studies might overlook. At the same time, the results remain consistent with regional WASH studies indicating that more than one billion people in Africa still lack safely managed sanitation, despite modest gains in service coverage^18,47^. Persistent structural barriers such as limited faecal sludge management capacity, inadequate sewerage networks, and growing urban populations, continue to hinder progress across many African contexts, including Uganda^15^.
Sanitation conditions in refugee settlements, however, remain critically poor, with only 3.4% of households accessing safely managed sanitation and many relying on inadequate or high-risk options, including open defecation. These results align with regional evaluations of camp-based populations, which consistently document overcrowding, insufficient space for latrine construction, rapid population turnover, and short-term humanitarian planning as major obstacles to achieving sustainable sanitation coverage^17^.The persistence of open defecation, even at low percentages, within refugee settlements underscores the difficulty of eliminating this practice under humanitarian constraints and highlights the need for stronger long-term investment and coordination between humanitarian and government agencies.
Determinants of household drinking and sanitation service levels
Households’ wealth status
A positive association was found between the household wealth status and drinking water and sanitation service levels. Wealthier households are better able to invest in safe water services and improved sanitation facilities, while poorer households often rely on unimproved sources and basic or no sanitation due to financial and infrastructural constraints^37,46,47^. This results mirrors recent research in Kampala, where financial constraints were shown to be a major barrier to adoption of improved sanitation technologies despite awareness of their benefits^25,42^. Other studies have likewise documented high upfront costs for improved latrines, frequent price shocks for piped water, and disproportionate expenditure burdens on low-income households^22,23^. Across SSA, multiple reviews highlight underinvestment, affordability barriers, and unequal cost-sharing arrangements as major obstacles to achieving SDG 6^15,16^. These findings also align with the WHO/UNICEF 2000–2024 global progress assessment, which underscores that safely managed water and sanitation remain heavily skewed toward the richest quintiles in low-income countries^29^. The results from Uganda reaffirm this gradient. Economic stratification determines whether households can move beyond basic or limited services. Low-income and ultra-poor households remain trapped in a cycle of unsafe water and shared sanitation, an inequality pattern consistently observed in both rural and urban SSA contexts^15,16^.
Place of residence
Urban households exhibited the highest probability of accessing higher water and sanitation service levels, mirroring their greater access to piped infrastructure, regulated services, and utility oversight. This finding is supported by numerous Ugandan studies documenting the concentration of safely managed services in Kampala and secondary cities^21,25,42,48^. Rural households, despite dominating the population, remain heavily reliant on basic and limited services consistent with regional evidence showing slower sanitation adoption, infrastructural deficits, and large reliance on communal sources across SSA’s rural regions^44^. This underscores the urgent need for equitable investment in water and sanitation infrastructure, particularly in rural areas, to reduce disparities and improve overall public health outcomes^15,19^. Refugee settlements exhibited the lowest likelihood of accessing improved services for both water and sanitation. This aligns with humanitarian assessments from Uganda, Ethiopia, and South Sudan which document chronic underfunding, aging borehole systems, and rapid population inflows that overwhelm service capacity^15^. IDP and refugee studies across SSA further confirm that camp environments face severe operational, logistics, and sustainability constraints that impede progress toward safely managed services^17^.These findings reaffirm the geographic and structural disadvantages faced by displaced populations and underscore the need for long-term, durable WASH solutions beyond short-term emergency programming.
Sex of household head
The finding that male-headed households had higher likelihood of accessing improved water and sanitation is consistent with a study conducted in rural districts of southern Ghana, where male-headed households were more than twice as likely to have improved waste and sanitation facilities compared to female-headed households^50^. While women shoulder the majority of water collection and household sanitation responsibilities, they often have limited control over financial decision-making, land, and infrastructure investment, which affects their ability to secure high-quality WASH services. Studies in Uganda’s slums have shown that female-headed households tend to experience greater economic vulnerability, more unstable tenancy arrangements, and higher exposure to unsafe or shared facilities^23^. Comparable studies in Kenya, Zimbabwe, and Malawi similarly report that female-headed households face greater access barriers due to income disparities, limited bargaining power with landlords, and lower access to formal water connections^15^. Gendered inequalities in asset ownership and household income also shape sanitation decision-making, with male-headed households more likely to invest in private latrines or pay for desludging services. The JMP 2023 progress reports further highlight that gendered social roles in SSA often place women at the center of WASH burdens while limiting their access to the resources required to upgrade facilities^36^. The results of this study therefore reflect broader structural gender inequities. Despite being disproportionately responsible for water and sanitation management, women in Uganda encounter systemic economic and social barriers that constrain their ability to secure higher service levels. Addressing these inequalities requires integrated gender-responsive WASH programming that improves financial inclusion and asset ownership among women.
Education level of household head
The education level of the household head was found to be significantly associated with drinking water sources and sanitation service levels The results show that households whose heads were highly educated had higher probability of accessing improved toilet facilities compared to households whose heads had no education. Generally, education is a resource factor of quality health outcomes in communities in sub-Saharan Africa^38^. Still, people with higher levels of education are often more aware of the importance proper sanitation practices^49^. This study finding is consistent with results from studies conducted in Ethiopia^50^, rural districts of southern Ghana^51^ and in Kampala Slums, Uganda^24,52^. The JMP 2024 global progress report likewise identifies low educational attainment as a structural factor underpinning persistent inequalities in safely managed water and sanitation across SSA^29^. The findings of this study, therefore, reinforce a consistent regional pattern, i.e., education enhances agency and knowledge, enabling households to achieve higher levels of WASH service despite systemic constraints. In contrast, households with low education remain structurally disadvantaged, often reliant on unimproved or shared facilities, echoing wider SSA trends where educational gradients underpin large intra-country WASH disparities^44^. However, the results contradicts with the study findings from poor peri-urban settlements of Abidjan, Côte d’Ivoire^53^. The contradiction between the findings of this study and the study conducted in Abidjan, Ivory Coast, could be attributed to differences in sample size, as the Abidjan study involved only 556 households. This smaller sample size may limit the generalizability of its findings and could contribute to variability in the results compared to the larger, more diverse sample in this study.
Region of the household
The pronounced regional disparities observed in the regression analysis, i.e., positive coefficients in South Buganda, North Buganda, Tooro, Ankole, and Bunyoro and negative coefficients in Bukedi, Teso, and Karamoja, mirror longstanding geographic inequalities in Uganda’s WASH landscape. These inequalities are deeply rooted in differences in infrastructure investment, hydrological conditions, population density, and governance capacity. Prior research has consistently shown that central and western Uganda benefit from comparatively stronger piped networks and better-maintained sanitation systems^42^. Similarly, northern and eastern regions, including Karamoja, experience persistent service deficits that could be attributed to arid climates, dispersed settlements, groundwater limitations, and chronic infrastructural underfunding. Recent SSA research supports the same pattern. Rural and semi-arid regions exhibit some of the lowest safely managed drinking water and sanitation rates due to logistical difficulty, high operational costs, and weak institutional presence^15,44^. The WHO/UNICEF JMP 2024 progress assessment also notes that regional disparities within countries are among the most persistent obstacles to universal service, often reflecting political prioritization and capital investment patterns^29^. The extremely low coefficients for Teso, Bukedi, and Karamoja further emphasize areas where Uganda is least likely to reach SDG 6 without targeted interventions. These findings align with humanitarian studies showing that Karamoja and other remote regions face seasonal water shortages, dependence on surface water, and higher open defecation rates—all of which compound structural inequalities^15,42^.
Household size
This study further found out that the proportion of households with access to improved toilet facilities was higher and significant in households with less than 3 members compared to those with 4 members and above. This result contradicts various studies. For example, studies conducted in Benin^54^, Ethiopia^50^ and Bangladesh^55^ show that larger families had more access to improved toilet facilities than small families. While studies in Benin, Ethiopia, and Bangladesh have found a positive association between large household size and access to improved toilet facilities in their settings, the socioeconomic and housing dynamics in Uganda may lead to an inverse relationship where smaller, often more affluent households, secure improved sanitation more readily than larger families.
Strength and limitation of the study
A key strength of this study is its use of a nationally representative dataset, which provides the most comprehensive overview to date of drinking water and sanitation service levels across Uganda. Unlike prior research concentrated in Kampala slums or selected districts, these findings offer national generalizability, capturing urban, rural, and refugee settlement contexts. The study also applies the WHO/UNICEF Joint Monitoring Programme (JMP) service ladder framework, marking one of the first attempts to systematically classify Uganda’s water and sanitation services using globally standardized criteria. This enhances comparability across regions and future SDG reporting.
Several limitations should be acknowledged. First, the cross-sectional nature of the dataset restricts causal inference; associations should not be interpreted as definitive causal pathways. Longitudinal data would be needed to assess dynamic changes in service levels over time. Second, the study relies on self-reported household information, including walking time and sanitation type, which may be prone to recall bias or social desiriorability bias. Third, the dataset does not capture seasonal variability, which can affect water availability, quality, and household collection practices in regions experiencing extended dry seasons. Fourth, the JMP classification used here, though globally accepted, may mask micro-level environmental and quality differences within service ladder categories. For example, households classified as having “basic” services may experience different reliability or contamination risks depending on local infrastructure conditions, which could not be fully assessed from the available data. Finally, while refugee settlements were included, data limitations restricted deeper exploration of humanitarian service delivery models, facility age, and operational challenges, factors that uniquely shape WASH outcomes for displaced populations. Future mixed-method or geospatial studies could help address these gaps by integrating system performance data, infrastructure audits, and environmental assessments.
Conclusion
This study provides the first nationally representative analysis of drinking water and sanitation service levels in Uganda using the WHO/UNICEF JMP service ladder framework, offering a comprehensive assessment of both access and the underlying determinants shaping service inequalities. The findings reveal that despite progress in expanding basic services, safely managed drinking water and sanitation remain limited, with pronounced disparities across socioeconomic groups, regions, and residence types. Both rural and Refugee settlements continue to exhibit low positions on the WHO/UNICEF Joint Monitoring Programme (JMP) service ladders. Education, wealth, gender of household head, and geographic location emerge as the strongest and most consistent predictors of service levels, underscoring the structural nature of WASH inequality in the country. Regional differences, particularly those disadvantaging Bukedi, Teso, Karamoja, and refugee settlements, highlight the need for targeted investments and policy interventions that prioritize underserved populations. The persistent disadvantages faced by low-income and female-headed households further demonstrate that progress toward universal WASH access cannot be achieved without addressing broader socioeconomic inequities. By integrating the JMP framework with robust statistical modeling, this study fills a critical evidence gap and provides actionable insights for policymakers, practitioners, and researchers working to advance SDG 6 in Uganda. Strengthening human capital, reducing financial barriers, improving infrastructure in remote regions, and embedding equity-focused approaches within national WASH programming will be essential for accelerating progress. Continued investment in data systems, monitoring, and context-specific research will further support the development of resilient, inclusive, and sustainable WASH services for all Ugandans. Future research should build on this work through longitudinal analyses, geospatial mapping, and mixed-methods studies that uncover how education, wealth, gender, and regional dynamics shape service inequality, ultimately supporting more effective and context-responsive strategies for achieving universal WASH access.
The reference list from the paper itself. Each links out to its DOI / PubMed record.
- 1WHO. Water, Sanitation, hygiene and health: A primer for health professionals. World Heal Organ (2021).
- 2Jeuland, M. A., Fuente, D. E., Ozdemir, S., Allaire, M. C. & Whittington, D. The Long-Term dynamics of mortality benefits from improved water and sanitation in less developed countries. P Lo S One 8, e 74804, 1–16 (2013).10.1371/journal.pone.0074804 PMC 379295324116011 · doi ↗ · pubmed ↗
- 3Mc Caw-Binns, A. & Hussein, J. The millennium development goals. Matern Perinat. Heal Dev. Ctries. 10–24. 10.1079/9781845937454.0010 (2012).
- 4Akrash. Progress on drinking water, sanitation and hygiene in Africa 2000–2020 5 years into the SD Gs. United Nations Child. Fund World Heal Organ (2020).
- 5WHO & UNICEF. Progress on household drinking water, sanitation and hygiene 2000–2020: five years into the SD Gs. Jt Water Supply Sanit. Monit. Program (2021).
- 6Mead, S. State of the world’s. United Nations Child. Fund World Heal Organ. (WHO), (2020).
- 7UNICEF & School Water Sanitation, and hygiene: A systematic review of an effect on Health, Attendance, Regularity, and educational achievements. Sch. J. 1–21. 10.3126/scholars.v 5i 1.55744 (2023).
- 8Hamza, A. et al. Emergency Water, Sanitation, and Hygiene (wash) Management in the Internally Displaced Persons Camps in Sub-Saharan Africa : A Systematic Review. Nigerian Journal of Water, Sanitation, and Hygiene Development, 1, 227–244 (2025).