Optimizing root architecture with nitrogen fertilization to improve nitrogen accumulation and yield in soybean
Yaxin Xu, Jianxin Zhang, Quantong Gao, Cong Wang

TL;DR
Applying 180 kg of nitrogen per hectare improves soybean root growth and nitrogen use efficiency, leading to higher yields in Xinjiang.
Contribution
Identifies optimal nitrogen fertilization rate (180 kg ha-1) for enhancing root architecture and nitrogen use efficiency in soybean.
Findings
180 kg N ha-1 increased root dry weight, length, and surface area density in the 0–60 cm soil layer.
180 kg N ha-1 boosted nitrogen metabolism enzyme activities, improving nitrogen uptake and shoot accumulation.
240 kg N ha-1 inhibited root growth and disrupted nitrogen metabolism, reducing root nitrogen accumulation.
Abstract
Xinjiang is a high-yielding region for soybean in China, but issues such as low nitrogen use efficiency limit yield. Optimizing nitrogen fertilization strategies can effectively alleviate these problems. A two-year field experiment was conducted during the 2022 and 2023 growing seasons using a split-plot design. Two soybean cultivars, the low-yielding Xindadou 27 and the high-yielding Xinnongdou 2, were planted in the main plots. Four nitrogen application rates were applied in the subplots: 0, 120, 180, and 240 kg ha-1. The application of 180 kg ha-1 nitrogen significantly increased root dry weight density, length density, and surface area density in the 0–60 cm soil layer, mainly through increases in the 0–20 cm soil layer. This treatment also enhanced the activities of key nitrogen metabolism enzymes (NR and GS/GOGAT) in roots, promoting nitrogen uptake and translocation to shoots,…
Genes, proteins, chemicals, diseases, species, mutations and cell lines named across the full text — each resolved to its canonical identifier and authoritative record.
Click any figure to enlarge with its caption.
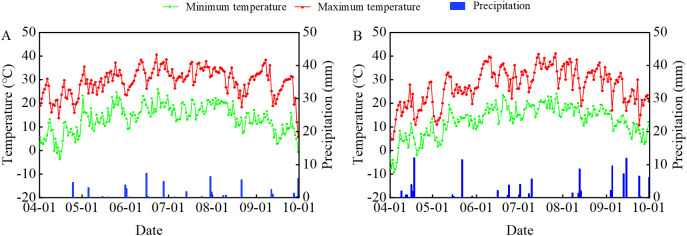 Figure 1
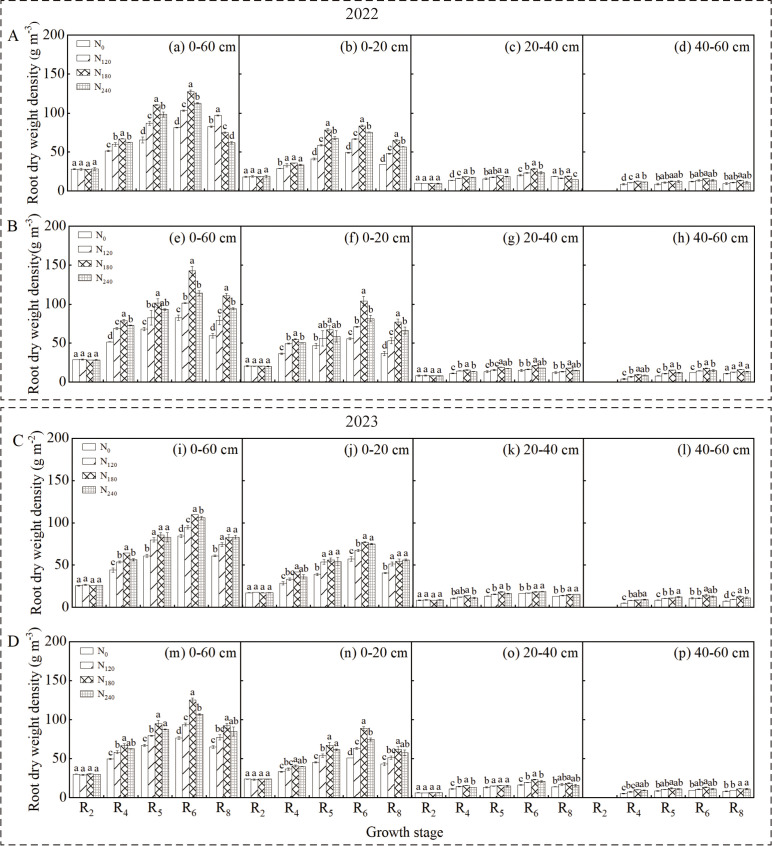 Figure 2
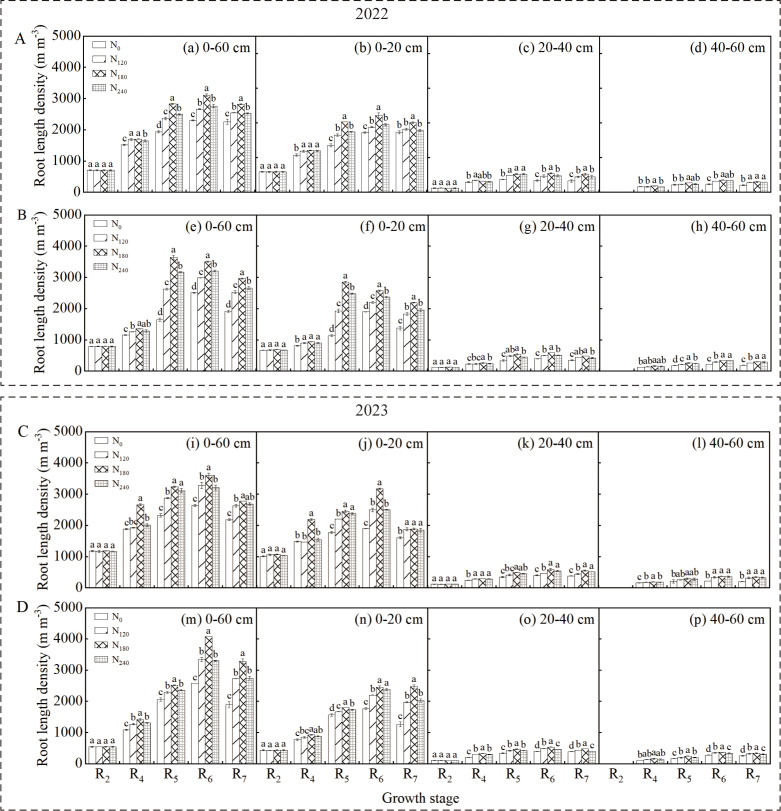 Figure 3
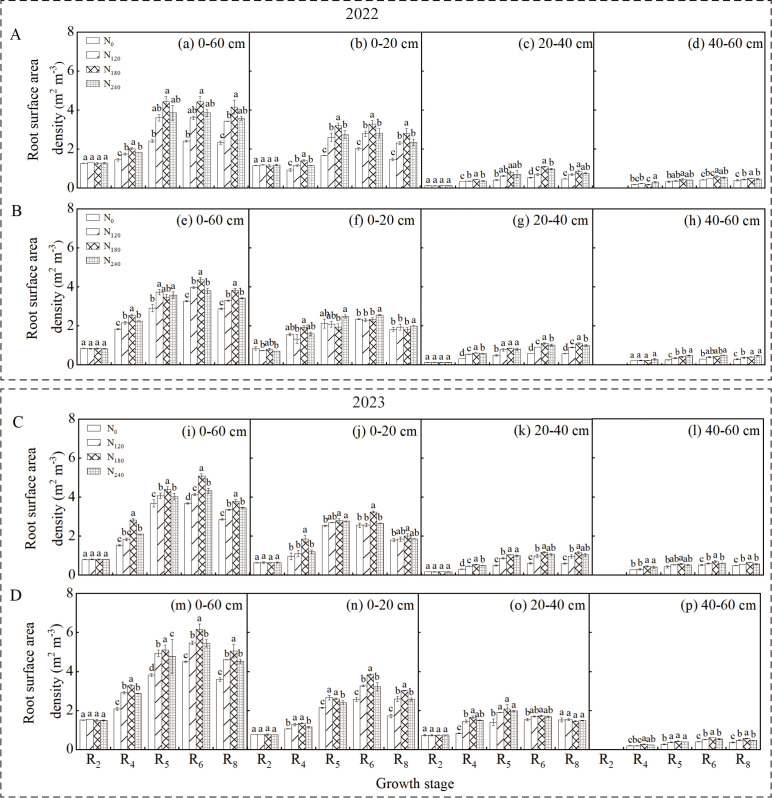 Figure 4
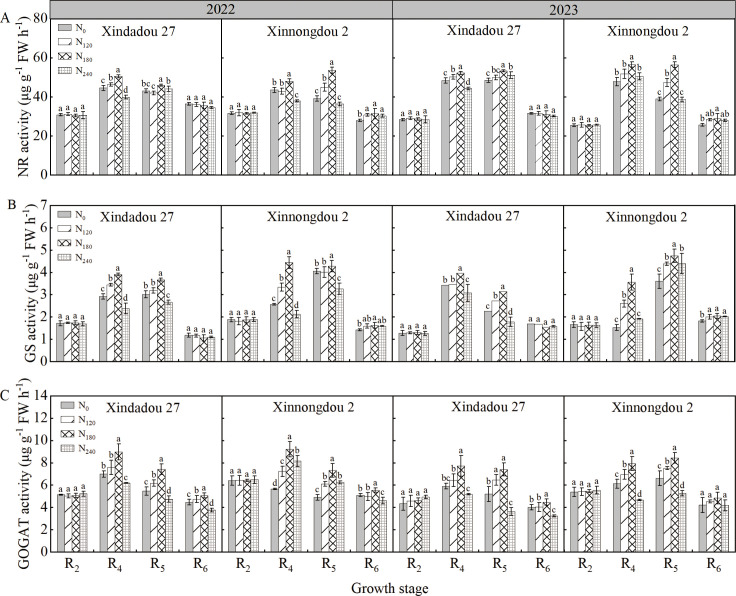 Figure 5
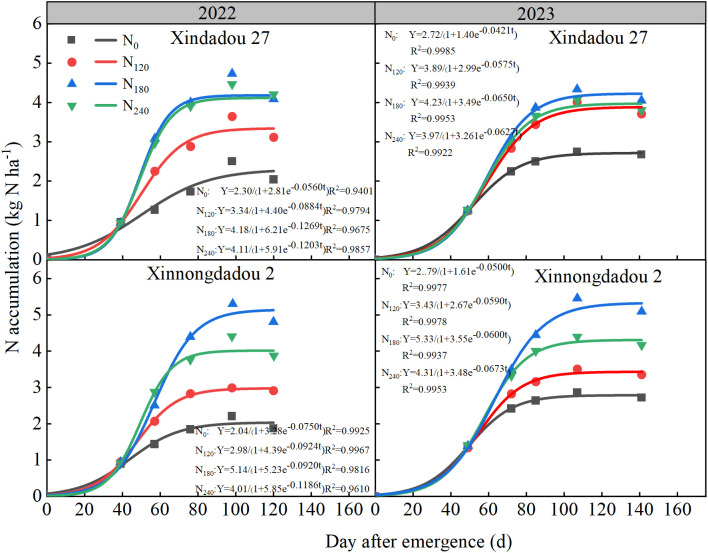 Figure 6
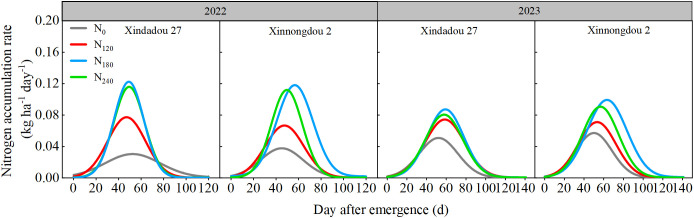 Figure 7
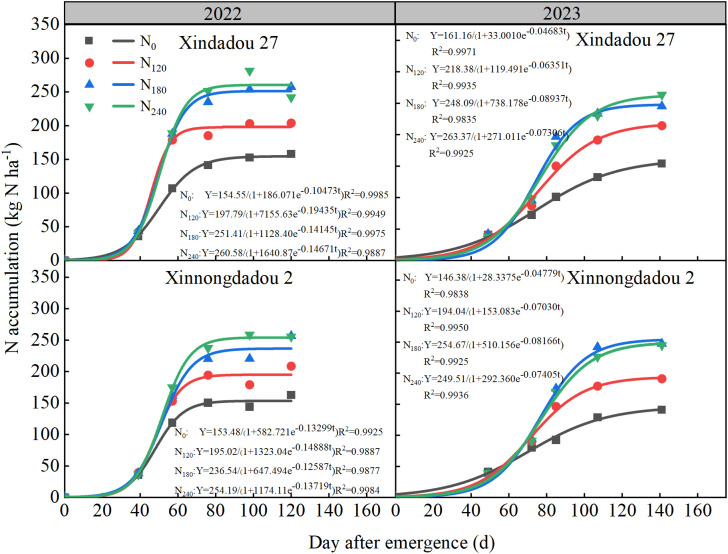 Figure 8
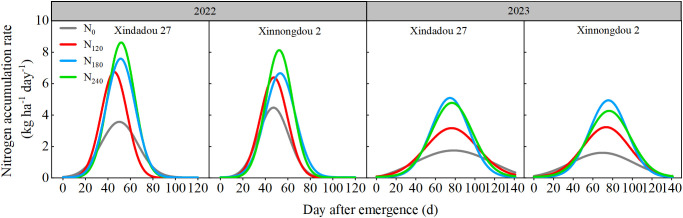 Figure 9
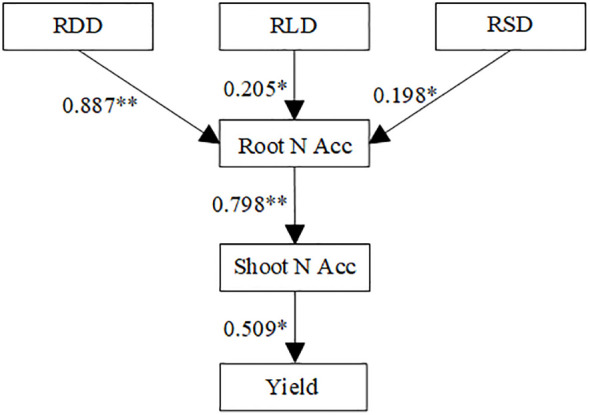 Figure 10
| Soil depth | Source of variation | 2022 | |||||||||
|---|---|---|---|---|---|---|---|---|---|---|---|
| R4 | R5 | R6 | |||||||||
| RDD | RLD | RSD | RDD | RLD | RSD | RDD | RLD | RSD | |||
| 0-60 | C | ** | ** | ** | * | ** | ns | ** | ** | * | |
| T | ** | ** | ** | ** | ** | ** | ** | ** | ** | ||
| C×T | ** | ** | ns | * | ** | ** | ** | ** | ** | ||
| 0-20 | C | ** | ** | ** | ns | ** | * | ** | ** | ** | |
| T | ** | ** | ** | ** | ** | ** | ** | ** | ** | ||
| C×T | ** | * | * | ** | * | ** | ** | ** | ** | ||
| 20-40 | C | ** | ** | ** | ** | ** | * | ** | ns | ** | |
| T | ** | ** | ** | ** | ** | ** | ** | ** | ** | ||
| C×T | ** | ** | ** | ns | ** | ns | * | ** | ** | ||
| 40-60 | C | ** | ** | ** | * | ** | ** | ** | * | ns | |
| T | ** | ** | ** | ** | ** | ** | ** | ** | ** | ||
| C×T | ** | * | ** | ** | ** | ** | ns | * | * | ||
| 2023 | |||||||||||
| 0-60 | C | ** | ** | ** | * | ** | * | * | ** | ** | |
| T | ** | ** | ** | ** | ** | ** | ** | ** | ** | ||
| C×T | ns | ** | ** | * | ** | ** | ** | ** | ** | ||
| 0-20 | C | ** | ** | ns | * | ** | * | ns | ** | ** | |
| T | ** | ** | ** | ** | ** | ** | ** | ** | ** | ||
| C×T | ** | ** | ** | ** | ** | ** | ** | ** | ** | ||
| 20-40 | C | ** | ** | ** | ns | ** | ** | ** | ns | ** | |
| T | ** | ** | ** | ** | ** | ** | ** | ** | ** | ||
| C×T | * | ** | ** | ** | ns | ns | ** | ** | ** | ||
| 40-60 | C | ns | ** | ** | ns | * | ** | ** | * | * | |
| T | ** | ** | ** | ** | ** | ** | ** | ** | ** | ||
| C×T | ** | ns | ** | * | ns | ns | ns | ** | ** | ||
| Years | Cultivar (C) | Treatment (T) | K (kg ha-1) | t1 (d) | t2 (d) | Δt (d) | Vt (kg ha-1 d-1) |
|---|---|---|---|---|---|---|---|
| 2022 | Xindadou 27 | N0 | 2.35g | 26.57e | 51.85d | 25.27b | 0.042f |
| N120 | 3.35e | 33.56c | 60.99b | 27.43ab | 0.080c | ||
| N180 | 4.18b | 38.47b | 67.30ab | 28.82a | 0.132a | ||
| N240 | 4.12c | 38.19b | 60.11b | 21.92d | 0.124b | ||
| Xinnongdou 2 | N0 | 2.05h | 25.50d | 53.26c | 27.76ab | 0.038e | |
| N120 | 2.98f | 33.22c | 61.72b | 28.51a | 0.069d | ||
| N180 | 5.13a | 42.31a | 70.79a | 28.48a | 0.119b | ||
| N240 | 4.02d | 38.18b | 60.46b | 22.29c | 0.119b | ||
| C | ns | * | ns | * | ns | ||
|
| T | ** | ** | ** | ** | ** | |
| C×T | ** | ** | ** | ** | ** | ||
| 2023 | Xindadou 27 | N0 | 2.72e | 42.58b | 65.95c | 23.37d | 0.051f |
| N120 | 3.89c | 46.07a | 70.37bc | 24.30d | 0.077d | ||
| N180 | 4.23b | 41.84c | 77.61b | 35.77b | 0.091b | ||
| N240 | 3.97c | 40.32d | 69.86bc | 29.54c | 0.085c | ||
| Xinnongdou 2 | N0 | 2.79e | 38.84d | 69.75bc | 30.91c | 0.058e | |
| N120 | 3.43d | 42.86ab | 70.32bc | 27.46c | 0.073d | ||
| N180 | 5.33a | 42.28b | 80.28a | 38.00a | 0.103a | ||
| N240 | 4.31b | 36.80d | 75.28b | 38.48a | 0.096b | ||
| C | ** | * | * | ns | * | ||
|
| T | ** | ** | ** | ** | ** | |
| C×T | ** | ** | ** | ** | ** |
| Year | Cultivar | Treatment | K (kg ha-1) | t1 (d) | t2 (d) | Δt (d) | Vt (kg ha-1 d-1) |
|---|---|---|---|---|---|---|---|
| 2022 | Xindadou 27 | N0 | 154.75e | 37.22e | 51.67e | 14.45d | 4.02d |
| N120 | 197.84d | 39.50d | 54.14d | 14.63d | 8.93a | ||
| N180 | 251.43b | 40.42c | 59.00b | 18.58b | 8.97a | ||
| N240 | 260.62a | 41.48ab | 59.44ab | 17.96c | 9.58a | ||
| Xinnongdou 2 | N0 | 153.68e | 37.97e | 54.95d | 16.98c | 5.12c | |
| N120 | 194.99d | 39.50d | 57.11c | 17.61c | 7.40b | ||
| N180 | 236.45c | 41.07bc | 62.12a | 21.05a | 7.55b | ||
| N240 | 254.21ab | 41.93a | 61.13a | 19.20ab | 8.73a | ||
| C | * | * | * | ** | * | ||
|
| T | ** | ** | ** | ** | ** | |
| C×T | ns | ns | ** | ** | ** | ||
| 2023 | Xindadou 27 | N0 | 163.29e | 45.63d | 78.73d | 33.10c | 1.82e |
| N120 | 219.04c | 54.55b | 96.42ab | 41.88a | 3.46d | ||
| N180 | 248.42b | 59.16a | 98.78a | 39.62a | 5.54a | ||
| N240 | 263.51a | 58.74a | 94.73ab | 35.99b | 4.85bc | ||
| Xinnongdou 2 | N0 | 148.23f | 41.08e | 73.48e | 32.40d | 1.67e | |
| N120 | 197.82d | 52.91c | 90.45c | 37.55ab | 3.43d | ||
| N180 | 254.72ab | 60.16a | 93.48b | 33.32d | 5.19ab | ||
| N240 | 249.56b | 58.85a | 94.5b | 35.65b | 4.61c | ||
|
|
|
|
|
|
| ||
|
| T | ** | ** | ** | ** | ** | |
| C×T | * | ** | ** | * | ns |
| Year | Cultivar | Treatment | Pods per plant | Seeds per plant | 100-grain weight | Yield | NUE |
|---|---|---|---|---|---|---|---|
| (Y) | (C) | (T) | (g) | (kg ha-1) | |||
| 2022 | Xindadou 27 | N0 | 25.25e | 77.85e | 18.40c | 3433.36f | |
| N120 | 30.40d | 85.9cd | 19.67b | 3721.68e | 2.40c | ||
| N180 | 37.60b | 95.65b | 19.87b | 4096.68b | 3.69b | ||
| N240 | 33.95c | 89.45c | 20.94a | 3857.54cd | 1.77d | ||
| Xinnongdou 2 | N0 | 33.40c | 79.40e | 15.37e | 3418.34f | ||
| N120 | 37.80b | 89.40c | 16.60d | 3827.51d | 3.41b | ||
| N180 | 42.80a | 99.95a | 17.17d | 4292.54a | 4.86a | ||
| N240 | 38.25b | 93.35b | 18.53c | 3932.52c | 2.14cd | ||
|
| C | ** | ** | ** | * | * | |
| T | ** | ** | ** | ** | ** | ||
| C×T | ns | ns | ns | * | * | ||
| 2023 | Xindadou 27 | N0 | 28.40e | 77.85e | 18.44c | 3525.94d | |
| N120 | 32.95d | 85.9cd | 19.26b | 3881.50c | 2.96b | ||
| N180 | 36.90c | 95.65b | 19.87ab | 4021.50b | 4.13a | ||
| N240 | 34.00d | 89.45c | 20.29a | 3911.13c | 1.60b | ||
| Xinnongdou 2 | N0 | 37.60c | 79.40e | 16.58e | 3810.39c | ||
| N120 | 41.80b | 89.40c | 17.54d | 4396.32b | 4.88a | ||
| N180 | 47.65a | 99.95a | 18.00cd | 4641.50a | 4.62a | ||
| N240 | 42.95b | 93.35b | 17.94cd | 4333.35b | 2.18b | ||
|
| C | ** | ns | ** | * | * | |
| T | ** | ** | ** | ** | ** | ||
| C×T | ns | ns | ns | ns | * |
| Item | χ²/df | RMSEA | SRMR | CFI |
|---|---|---|---|---|
| Evaluation criterion | <3 | <0.05 | <0.05 | close to 1 |
| Result | 0.649 | 0.029 | 0.031 | 1.000 |
Peer Reviews
No public reviews on file for this paper yet. If you reviewed it on a platform where reviews are public (OpenReview, ICLR, NeurIPS, ICML), you can paste yours below so the community can read it here.
Videos
No videos yet. Explain this paper in a talk, walkthrough, or lecture? Add one.
Taxonomy
TopicsPlant nutrient uptake and metabolism · Soybean genetics and cultivation · Legume Nitrogen Fixing Symbiosis
Introduction
1
As a major high-yielding soybean region in China, Xinjiang achieved a record soybean yield of 7126.2 kg ha^-1^ in 2025. The average soybean yield in China was only 1995 kg ha^-1^ (Li and Yang, 2025). This large gap highlights the substantial potential for increasing soybean yield in China. In the Xinjiang high-yield cultivation system, advanced mulched drip irrigation technology and precise nitrogen input have been instrumental in achieving this record yield (Zheng et al., 2021). However, excessive nitrogen application can limit soybean nitrogen use efficiency (He et al., 2025). Nitrogen is a key element regulating both root growth and yield formation in soybean (He et al., 2025). As the primary organ for nitrogen uptake, root system growth directly determines nitrogen acquisition efficiency and utilization potential. This ultimately affects yield potential (Walch-Liu et al., 2005). Thus, developing nitrogen management strategies that optimize root growth and enhance nitrogen absorption, translocation, and utilization efficiency is of great practical importance. Achieving both maximum nitrogen use efficiency and yield is crucial for sustainable agricultural practices and efficient soybean production.
The morphological structure of plant roots in the soil reflects their potential capacity for absorbing water and nitrogen, thereby supporting crop metabolism and growth (Dai et al., 2014). It has been demonstrated that an optimal root system architecture is conducive to the accumulation of nitrogen in the aboveground parts of the plant, thereby contributing to the formation of a high yield (Rotundo et al., 2014; Niu et al., 2020). Research indicates that high-yielding soybean varieties generally possess more fine roots, greater root length density, and deeper soil distribution—advantages that directly determine the crop’s nutrient acquisition potential (Jones and Jacobsen, 2005; Lynch and Brown, 2011; Symeou et al., 2012). Crop root architecture is closely related to the soil environment, particularly the supply of soil nitrogen. Appropriate nitrogen application promotes root extension into deeper soil layers and delays root senescence. This process not only facilitates the efficient allocation of photosynthetic products to reproductive organs but also promotes biomass and nitrogen accumulation in these organs (Jiang et al., 2017), ultimately enhancing nitrogen use efficiency (Fehr et al., 1971; Xu et al., 2012). Under nitrogen-deficient conditions, plant nitrogen metabolism significantly declines, markedly downregulating the glutamine synthetase (GS)/glutamate synthase (GOGAT) cycle, which accelerates leaf senescence and shortens the duration of crop photosynthesis (Takahashi et al., 2005), thereby inhibiting plant growth and limiting yield potential. Previous studies have shown that soybean yield under zero nitrogen treatment is 11% lower than that under nitrogen fertilizer application (Cafaro La Menza et al., 2017). In contrast, excessive nitrogen application leads to ammonium nitrogen accumulation in the soil, significantly reduces nitrate reductase (NR) and GS activities, causes root damage or even degeneration, and impairs soybean symbiotic nitrogen fixation (Guan et al., 2016). Extensive studies have confirmed significant positive correlations among soybean root architecture, nitrogen accumulation, and yield (Jin et al., 2006; He et al., 2017). Thus, optimizing soybean root architecture through rational nitrogen application is a crucial approach to enhancing nitrogen absorption efficiency and achieving high yields.
High-yielding soybean demands substantial nitrogen, requiring approximately 300 kg of nitrogen per 3 t ha^-^¹ of grain produced (Hungria, 2006; Salvagiotti et al., 2008; Tamagno et al., 2017). Notably, studies indicate that about 50% of the nitrogen in mature soybean grains derives from soil and fertilizer nitrogen (Salvagiotti et al., 2008). If nitrogen assimilation during the grain-filling stage is constrained by insufficient soil nitrogen supply or reduced symbiotic nitrogen fixation, plants are highly susceptible to nitrogen deficiency. This can lead to decreased pod number, increased abortion rate, and ultimately pose a serious threat to grain yield (Ortez et al., 2019). To achieve the synergistic maximization of nitrogen use efficiency and yield in soybean, it is essential to thoroughly investigate nitrogen supply patterns during reproductive growth and the interaction mechanisms between root growth, metabolism, and nitrogen absorption and utilization.
Under mulch drip irrigation, plastic mulch has significantly improved the temperature and moisture conditions in the soybean rhizosphere, promoting root growth and facilitating high-yield formation in soybeans (Wang et al., 2000). Currently, the influence patterns of nitrogen application rates on root architecture, nitrogen uptake in spring soybeans, and their relationship with yield formation in mulch drip irrigation areas of Xinjiang have not been reported. Under drip irrigation with plastic mulch, this study established different nitrogen application levels to elucidate the relationships among soybean root growth and metabolism, nitrogen uptake and utilization, and yield. We hypothesized that excessive nitrogen application at the beginning pod stage would inhibit root growth, suppress the GS/GOGAT pathway, and nitrogen translocation to shoots, thereby reducing soybean yield. Our results provide new insights into efficient nitrogen use and the regulation of precision nitrogen application for soybean in arid regions.
Materials and methods
2
Experimental field and meteorological conditions
2.1
The experiment was carried out in 2022–2023 at the Sanping Experimental Farm (116°41′E, 39°91′N; Urumqi, Xinjiang, China). Meteorological data (temperature and precipitation) for the soybean growing seasons are shown in Figure 1. The soil is classified as sandy loam, with initial properties as follows: organic matter content 13.8 g kg^-1^, total N 0.82 g kg^-1^, mineral N 56.65 mg kg^-1^, available P 14.1 mg kg^-1^, and available K 200.6 mg kg^-1^.
Daily minimum temperature, maximum temperature and rainfall from April to October in 2022 (A) and 2023 (B).
Experimental design and crop husbandry
2.2
The field experiment followed a split-plot arrangement over two consecutive growing seasons. The main plots consisted of two soybean cultivars: Xindadou 27 (a low-yielding cultivar) and Xinnongdou 2 (a high-yielding cultivar). The subplots comprised four nitrogen application levels: 0 (N_0_), 120 (N_120_), 180 (N_180_), and 240 kg ha^-1^ (N_240_). Among these, 0 kg N ha^-1^ served as the nitrogen-free control; 240 kg N ha^-1^ represented the conventional high-yield application rate used by local farmers under plastic mulching with drip irrigation; 180 kg N ha^-1^ was identified as the optimized threshold based on preliminary experiments, which maintained yield potential while significantly improving nitrogen use efficiency; and 120 kg N ha^-1^ represented a moderate nitrogen reduction treatment. All nitrogen fertilizer was applied in a single dose at the beginning pod stage via drip irrigation. Each plot measured 48 m² (4.8 m × 10 m). Each treatment was replicated three times, with a 2 m buffer zone between adjacent plots. Before tillage, superphosphate (containing 19% P_2_O_5_) was applied at 300 kg ha^-^¹. Soybeans were sown on April 27 and harvested from September 6 to 26. The experiment was conducted over two consecutive years. A uniform row spacing of 40 cm was used with a planting density of 33×10^4^ plants ha^-^¹. The field was covered with 140 cm wide black plastic mulch, and drip irrigation tapes were laid beneath the mulch at 40 cm intervals (Φ16 mm with a discharge rate of 2.5–3.5 L h^-1^). Irrigation was conducted annually from June 17–27 to August 5–15, once every 10–13 days, totaling six events with each irrigation applying 600–700 m³ ha^-1^. The total irrigation volume was 3900 m³ ha^-1^. Potassium dihydrogen phosphate (containing 34% K_2_O and 52% P_2_O_5_) was applied through fertigation. The total nutrient application rates were 51 kg K_2_O ha^-1^ and 78 kg P_2_O_5_ ha^-1^, applied in a 1:2 ratio at the initial flowering stage and the beginning of the pod stage, respectively. Two manual weeding were performed during the soybean growing season. All other management practices were consistent with conventional field production.
Root architecture
2.3
Root sampling was carried out at five key growth stages: full flowering stage (R_2_), full pod stage (R_4_), beginning pod stage (R_5_), full seed stage (R_6_), and full maturity stage (R_8_). For each treatment, the profile trench method was used for sampling. The experiment employed a planting pattern with four rows under a single plastic film. To systematically control the influence of root overlap between adjacent plants, all root samples were collected from the two middle rows. The specific sampling location was centered on a single plant selected from the middle row of plants. From this center point, sampling extended 10 cm along the row direction in both directions (total length 20 cm) and 20 cm perpendicular to the row direction in both directions (total width 40 cm). The excavation depth was 20 cm, resulting in a single-layer soil sampling volume of 16,000 cm^3^. This volume was determined based on the local sandy loam soil texture and the characteristic that soybean roots are primarily distributed in the 0–60 cm soil layer, ensuring both representativeness of the root samples and practicality for field operation and subsequent root separation. Root samples were collected from the 0–20 cm, 20–40 cm, and 40–60 cm soil layers separately. They were placed on a 2 mm mesh sieve and rinsed with gently flowing water. All root residues retained on the sieve were collected (pre-experiment verification indicated root loss during this operation was minimal, not affecting data accuracy). The roots were then sorted, re-screened, and washed, and the taproots and lateral roots were separated. The root samples were placed in a transparent glass box filled with water. Each root was carefully extended and flattened with forceps to avoid overlap and crossing. Before scanning, the WinRHIZO-2004a system was calibrated using its standard root images to ensure accurate measurement of root length and surface area. The root samples were then scanned using the root scanning analyzer to obtain the relevant parameters. After scanning, the root samples were placed in a 105°C oven for 30 minutes to deactivate enzyme activity, then dried at 80°C to a constant weight, and the root dry weight was recorded. Based on the sampling volume of each soil layer, the root dry weight density (RDD, Equation 1), root length density (RLD, Equation 2), and root surface area density (RSD, Equation 3) were calculated.
Sample collection
2.4
During the full flowering stage (R_2_), full pod stage (R_4_), beginning pod stage (R_5_), full seed stage (R_6_), and full maturity stage (R_8_), ten representative plants were collected from each treatment. Root systems were carefully excavated and rinsed with tap water. Five plants were then separated into constituent organs and dried in an oven at 60°C until constant weight was achieved for biomass assessment. The dried plant material was ground to pass through a 1 mm sieve and stored under dry conditions. Roots from the remaining five plants were preserved at –80°C for later biochemical analysis.
Enzymatic activities
2.5
Fresh roots were extracted with an appropriate buffer, and the supernatant was collected for the determination of the following enzyme activities: nitrate reductase (NR), glutamine synthetase (GS), and glutamate synthase (GOGAT). NR activity was measured using the method of Ogawa et al (Ogawa et al. (1999)). with slight modifications: the reaction mixture contained 100 mM KNO_3_, 5 mM NaHCO_3_, 25 mM PBS, and 0.2 mM nicotinamide adenine dinucleotide (NADH). After the mixture had reacted thoroughly for 30 minutes, 250 μL of 1% sulfanilamide reagent and 250 μL of 1% α-naphthylamine reagent were sequentially added. A standard curve was prepared using sodium nitrite. GS activity was determined according to the method of O’Neal and Joy (O’Neal and Joy (1974)): the reaction system contained 50 mM Tris-HCl (pH 7.5), 4 mM ATP, 80 mM sodium glutamate, 30 mM MgSO_4_, 10 mM NH_2_OH, and 30 mM cysteine, with γ-glutamyl hydroxamate used to prepare the standard curve. GOGAT activity was assayed by the method of Singh and Srivastava (Singh and Srivastava (1986)): the reaction medium consisted of 100 mM potassium phosphate buffer (pH 7.6), 0.1% (v/v) 2-mercaptoethanol, 100 μM NADH, 2.5 mM 2-ketoglutarate, and 100 mM glutamine.
Total N accumulation amount and rate
2.6
Plant nitrogen content was determined using the Kjeldahl method: plant organs were digested with concentrated H_2_SO_4_ and H_2_O_2_, and nitrogen content was measured using a K9840 automatic Kjeldahl nitrogen analyzer. The total N accumulation in the samples was calculated using the following formula (Equation 4):
Where DMA represents dry matter accumulation, and Nc represents the total nitrogen concentration.
The dynamics of total nitrogen accumulation in soybean were fitted using the Logistic equation as follows (Gao et al., 2021):
Where t is the days after emergence (DAE, d), Y is the plant biomass or total nitrogen amount (kg) at time t, K is the maximum biomass or total nitrogen accumulation (kg), and a and b are constants.
Using differential calculus on Equation 5 yields the following:
Where Δt is the fast accumulation period (FAP) of total nitrogen, t_1_ is the start time, t_2_ is the end time, and Vt is the mean accumulation rate during this FAP (Equation 6).
With reference to the methodology described by Mao et al. (2018) for quantifying biomass accumulation rates, the beta growth function (Equation 7) was employed to simulate the unimodal curve dynamics of total nitrogen accumulation in both roots and shoots.
Where V (kg ha^-1^ d^-1^) represents the total nitrogen accumulation rate at days after emergence (DAE) t (d); Te (d) denotes the termination time of accumulation, i.e., the accumulation duration; Tm (d) represents the occurrence time of the maximum accumulation rate Vm (kg ha^-1^ d^-1^). Tm and Te can be obtained by fitting the total nitrogen accumulation data using Equation 8, while Vm can be calculated using Equation 9.
Where W (kg ha^-1^) and Wmax (kg ha^-1^) represent the total nitrogen accumulation at days after emergence t and the maximum total nitrogen accumulation, respectively.
Yield
2.7
At the full maturity stage, ten uniform, disease-free plants per treatment were sampled in three replicates to determine yield components, including pods per plant, grains per plant, and 100-grain weight. Grain yield was measured by harvesting a central area of 6.4 m² (1.6 m × 4 m) per plot, excluding border rows and the first meter at both ends, also with three replicates. The harvested grains were air-dried, weighed, and the yield was adjusted to a standard moisture content of 13%.
Nitrogen use efficiency
2.8
The nitrogen use efficiency (NUE) is calculated as follows (Equation 10):
Statistical analysis
2.9
Statistical analyses were performed using SPSS 20.0 (SPSS Inc., Chicago, IL, USA). One-way ANOVA was used to evaluate the effects of year, cultivar, growth stage, and nitrogen treatment on root architecture and enzyme activities. Two-way ANOVA was applied to examine the interactions between cultivar and nitrogen application rate on root architecture, nitrogen accumulation parameters, yield, and nitrogen use efficiency (NUE). Data are presented as means. Structural equation modeling (SEM) was implemented in IBM SPSS AMOS 26 to quantify the relationships among root architecture, nitrogen accumulation, and yield. Chi-square (χ^2^/df), root mean square error of approximation (RMSEA), standardized root mean square residual (SRMR), and comparative fit index (CFI) were used to evaluate the applicability of SEM (Noll et al., 2022). If an index did not meet the SEM evaluation criteria, the model was adjusted by adding significant relationships or removing non-significant relationships until all indices met the evaluation criteria.
Results
3
Root dry weight density
3.1
Analysis of variance (Table 1) revealed that cultivar, nitrogen application rate, and their interaction significantly influenced root dry weight density (RDD) in the 0–60 cm soil layer during the R_4_~R_6_ stages in both growing seasons (p < 0.05). The RDD in the 0–60 cm and 0–20 cm layers exhibited a consistent pattern, initially increasing and then decreasing with growth progression, peaking at the R_6_ stage (Figure 2). Significant differences were observed among cultivars and nitrogen treatments (p < 0.05), with the N_180_ treatment consistently exhibiting the highest RDD. Compared to other treatments, the N_180_ treatment significantly increased RDD for both cultivars in both years. The trend in the 0–20 cm soil layer was consistent with that in the 0–60 cm layer.
Effect of nitrogen application rate on soybean root dry weight density (RDD) in 2022 and 2023. Panels (A, C) represent the RDD of Xindadou 27, while Panels (B, D) represent that of Xinnongdou 2. Bars represent means and error bars standard error (n = 3). Different letters represent significant differences (p < 0.05) between treatments at the same growth stage.
Root length density
3.2
Analysis of variance (Table 1) indicated that cultivar, nitrogen application rate, and their interaction significantly affected soybean root length density (RLD) in the 0–60 cm soil layer during the R_4_~R_6_ stages in both growing seasons (p < 0.05). The RLD in both the 0–60 cm and 0–20 cm soil layers showed an initial increase followed by a decrease during the growth period, reaching maximum values at the R_6_ stage (Figure 3). Significant differences were observed among different cultivars and nitrogen treatments (p < 0.05), with the N_180_ treatment consistently exhibiting significantly higher RLD than other treatments across both cultivars and years. The changing pattern of RLD in the 0–20 cm soil layer was generally consistent with that in the 0–60 cm layer.
Effect of nitrogen application rate on soybean root length density (RLD) in 2022 and 2023. Panels (A, C) represent the RLD of Xindadou 27, while Panels (B, D) represent that of Xinnongdou 2. Bars represent means and error bars standard error (n = 3). Different letters represent significant differences (p < 0.05) between treatments at the same growth stage.
Root surface area density
3.3
Analysis of variance revealed that cultivar, nitrogen application rate, and their interaction significantly affected soybean root surface area density (RSD) in the 0–60 cm soil layer during the R_4_~R_6_ stages across both growing seasons (p < 0.05). The RSD in both the 0–60 cm and 0–20 cm soil layers exhibited a pattern of initial increase followed by a decrease during the reproductive growth period, reaching maximum values at the R_6_ stage (Figure 4). Significant differences were observed among different cultivars and nitrogen treatments (p < 0.05), with the N180 treatment consistently showing significantly higher RSD than other treatments for both cultivars in both years. The RSD trend in the 0–20 cm soil layer was essentially consistent with that in the 0–60 cm layer.
Effect of nitrogen application rate on soybean root surface area density (RSD) in 2022 and 2023. Panels (A, C) represent the RSD of Xindadou 27, while Panels (B, D) represent that of Xinnongdou 2. Bars represent means and error bars standard error (n = 3). Different letters represent significant differences (p < 0.05) between treatments at the same growth stage.
Root enzyme activities
3.4
As shown in Figure 5, during both the 2022 and 2023 growing seasons, the activities of NR, GS, and GOGAT in roots of Xindadou 27 and Xinnongdou 2 showed an initial increase followed by a decrease during the reproductive growth period, peaking at the R_4_ stage. Nitrogen application significantly increased the activities of root NR, GS, and GOGAT during the R_4_ and R_5_ stages (p < 0.05). The trends of enzyme activities in 2023 were generally consistent with those observed in 2022.
Effect of nitrogen application rate on soybean root enzyme activities in 2022 and 2023. Bars represent means and error bars standard error (n = 3). Different letters represent significant differences (p < 0.05) between treatments at the same growth stage.
Root total nitrogen
3.5
During both the 2022 and 2023 growing seasons, the root nitrogen accumulation of both soybean cultivars exhibited a slowfast-slow pattern (Figure 6). The root nitrogen accumulation rate showed a typical single-peak curve, rising first and then falling (Figure 7). In 2022, as the nitrogen application rate increased, the total root nitrogen accumulation (K) and average accumulation rate (Vt) of both cultivars initially increased, and then decreased (Table 2). Nitrogen application significantly prolonged the fast accumulation period (FAP, Δt) of total root nitrogen. Compared to the N_0_ treatment, the K value and Vt values of Xindadou 27 in the N_120_, N_180_, and N_240_ treatments increased significantly by 42.55%~75.32% and 90.48%~214.29%, respectively; while those of Xinnongdou 2 increased by 45.37%~150.24% and 81.58%~213.16%, respectively.
Effect of nitrogen application rate on soybean root nitrogen accumulation in 2022 and 2023. Points represent the measured mean values, while lines represent the logistic fitting.
Effect of nitrogen application rate on soybean root nitrogen accumulation rate in 2022 and 2023 based on β-equation fitting.
Shoot nitrogen accumulation
3.6
Over the 2022 and 2023 growing seasons, aboveground nitrogen accumulation in both soybean cultivars followed a typical sigmoidal curve (Figure 8). The aboveground nitrogen accumulation rate showed a typical single-peak curve, rising first and then falling (Figure 9). As shown in Table 3, key accumulation parameters increased with the application of nitrogen. Notably, the N_180_ treatment significantly enhanced the final accumulation potential (K), prolonging the rapid accumulation duration (Δt) by 23.97%~28.58% and substantially increasing the average accumulation rate (Vt) compared to the N0 control. This trend was consistent across both years, with the N_180_ rate consistently promoting the most favorable nitrogen uptake dynamics for each cultivar.
Effect of nitrogen application rate on soybean aboveground nitrogen accumulation in 2022 and 2023. Points represent the average of measurements, while the lines represent logistic fits.
Effect of nitrogen application rate on soybean aboveground nitrogen accumulation rate in 2022 and 2023 based on β-equation fitting.
Yield and nitrogen use efficiency
3.7
The ANOVA results (Table 4) indicated that both cultivar and nitrogen application rate significantly affected pods per plant, seeds per plant, 100-seed weight, yield, and nitrogen use efficiency (NUE). Yield consistently reached its peak under the N_180_ treatment for both cultivars across both years. Compared to N_0_, the yield increases for Xindadou 27 were 19.32% in 2022 and 25.57% in 2023, and for Xinnongdou 2, they were 24.92% in 2022 and 21.81% in 2023. This yield advantage at N_180_ was associated with a significant increase in both the number of pods per plant and the number of seeds per plant. Notably, while 100-seed weight often reached its maximum under the N_240_ treatment, this increase in individual seed mass did not lead to higher overall yield beyond the optimum achieved at N_180_. For NUE, both cultivars reached their maximum under N_180_ in 2022. In 2023, the highest values for Xindadou 27 and Xinnongdou 2 were 4.13 kg kg^-1^ under N_180_ and 4.88 kg kg^-1^ under N_120_, respectively.
Structural equation model
3.8
As shown in Table 5, all fit indices were within the acceptable range, with χ²/df=0.649, RMSEA = 0.029, SRMR = 0.031, and CFI = 1.000. All fit parameters of the initial model indicated a good fit. Structural equation modeling (SEM) was applied to evaluate the effects of root architecture and nitrogen accumulation on yield (Figure 10). Root dry weight density (RDD), root length density (RLD), and root surface area density (RSD) significantly and positively influenced root nitrogen accumulation, with path coefficients of 0.887, 0.205, and 0.198, respectively. Root nitrogen accumulation demonstrated a highly significant positive effect on aboveground nitrogen accumulation. Furthermore, aboveground nitrogen accumulation exhibited a significant positive effect on yield, with a path coefficient of 0.509.
Structural equation modeling (SEM) of the relationships between root system architecture, nitrogen accumulation and yield at R6 stage in 2022 and 2023. Solid and dashed arrows indicate significant and nonsignificant path coefficients, respectively. RDD, root dry weight density; RLD, root length density; RSD, root surface area density; Root N Acc, nitrogen accumulation in root; Shoot N Acc, nitrogen in the shoot. Values above arrows represent standardized path coefficients. ** denote significance at the 0.01 probability levels, * denote significance at the 0.05 probability levels.
Discussions
4
In high-yield environments, the external nitrogen supply serves as the primary approach to meet soybean nitrogen demand, with root morphology and distribution determining nitrogen acquisition the capacity (Luo et al., 2020; Suo et al., 2024). Extensive studies have shown that the R_3_~R_6_ stages, particularly the R_4_~R_5_ stages, represent the peak nitrogen demand stage in soybeans, whereas external nitrogen application during early flowering stages has no significant effect on seed yield (Moreno et al., 2018; Ortez et al., 2019; De Borja Reis et al., 2021). Therefore, in this study, nitrogen was applied at the R_3_ stage. As a result, during the R_2_ stage across two growing seasons, no significant differences were observed in root length density (RLD), root dry weight density (RDD), or root surface area density (RSD) in the 0–60 cm soil layer among treatments (Figures 2-4). However, as growth progressed to the R_4_~R_6_ stages, significant differences in these root parameters emerged (Table 1), with the N_180_ treatment exhibiting higher values than other treatments. Some studies suggest that plants enhance root biomass under low nitrogen conditions by increasing nutrient allocation to roots (Gao et al., 2015; Kramer-Walter and Laughlin, 2017). In contrast, this study found that root biomass did not increase under low nitrogen but rather increased with nitrogen application up to a certain level before declining significantly. Low nitrogen supply likely inhibited root development by failing to meet basic growth demands, particularly in the zero-nitrogen treatment. Excessive nitrogen fertilizer also negatively affected root growth. The inhibition of root growth by high nitrogen (240 kg ha^-^¹) was directly associated with the simultaneous decline in key nitrogen metabolic enzyme activities. The significant reductions in NR, GS, and GOGAT activity led to decreased nitrogen assimilation efficiency in the roots. This resulted in the accumulation of absorbed ammonium nitrogen, which potentially triggered ammonium toxicity (Zhang et al., 2017; Chen et al., 2020). Some research indicates that nitrogen deficiency can promote root elongation to enhance spatial nitrogen availability (Sun et al., 2020), whereas other studies suggest that optimal external nitrogen levels stimulate lateral root growth, with both extremely low and high nitrogen levels suppressing root development (Walch-Liu et al., 2006; Zhu et al., 2022). This study supports these conclusions: nitrogen application at 180 kg ha^-1^ significantly improved shallow root traits (RLD, RDD, RSD). At the R_6_ stage, the N_180_ treatment increased RLD in the 0–60 cm soil layer by 9.9%~36.5% for Xindadou 27 and 9.2%~58.0% for Xinnongdou 2, and root surface area by 14.5%~84.1% and 10.2%~36.9%, respectively, compared to other treatments. Furthermore, averaged over two years during the R_4_~R_6_ stages, Xinnongdou 2 showed higher RLD, RDD, and RSD than Xindadou 27, indicating that its more developed root system facilitates more efficient soil resource absorption and utilization (Figure 10).
Previous studies have indicated that crop root growth is closely related to nitrogen accumulation and seed yield (Cafaro La Menza et al., 2019). Low nitrogen stress reduces nitrogen content and yield in field-grown plants (Lawlor et al., 2001), but high-yielding cultivars demonstrate higher nitrogen accumulation and yield under low nitrogen conditions due to greater nitrogen uptake efficiency and more extensive root systems (Ju et al., 2015; Su et al., 2019). The present study observed that root GS and GOGAT activity peaked during the R_4_ stage, representing an active physiological adaptation by plants to meet the nitrogen demands of rapid pod and grain development (Zhou et al., 2023). The rapid formation of pods and grains during the R_4_ stage generates intense nitrogen demand, driving the root system to efficiently synthesize transportable nitrogen compounds such as glutamine through upregulation of the core nitrogen assimilation pathway GS/GOGAT. This phenomenon occurs under conditions of sufficient carbon skeleton supply, thereby ensuring nitrogen availability for grain development (Andrews et al., 2004; Lyu et al., 2024). This study observed that appropriate external nitrogen supply significantly promotes root nitrogen assimilation, thereby increasing nitrogen accumulation, while excessively high or low nitrogen levels inhibit this process. These effects correspond to the activity trends of key nitrogen assimilation enzymes (NR, GS, GOGAT), in agreement with the results reported by Xu et al. (2012). In this study, nitrogen accumulation in both roots and aboveground canopies followed a “slow-fast-slow” pattern across all treatments (Figure 6, Tables 2, 3). Analysis of nitrogen accumulation parameters revealed significant effects of cultivar and nitrogen fertilizer (p < 0.05). Although the rapid accumulation period for root and canopy nitrogen in the N_0_ treatment started 3.516.8 d and 3.419.1 d earlier, respectively, compared to other treatments, it also ended 10.517.5 d and 2.221.0 d earlier, resulting in shorter rapid accumulation durations by 0.812.4 d and 4.18.8 d, respectively. Meanwhile, the maximum accumulation rates for root and canopy nitrogen in the N0 treatment were 42.9%~68.2% and 41.4%~67.8% lower than other treatments. Consequently, root nitrogen accumulation followed N_180_>N_240_>N_120_>N_0_, while canopy nitrogen accumulation showed N_240_>N_180_>N_120_>N_0_. While N_240_ treatment resulted in the greatest canopy nitrogen accumulation, this could potentially lead to excessive vegetative growth and subsequent yield reduction. In comparison with Xinnongdou 2, Xindadou 27 demonstrated higher canopy nitrogen accumulation under conditions of elevated nitrogen availability. However, this was accompanied by a substantial reduction in pods per plant, resulting in a consequent decline in yield.
Nitrogen application rate serves as a primary method for regulating plant nitrogen accumulation and distribution, playing a crucial role in plant growth and yield potential (Anas et al., 2020; Wang et al., 2024). Both excessively high and low nitrogen supply levels can reduce soybean yield. In this study, the maximum soybean yield was achieved at the nitrogen application rate of 180 kg ha^-1^, primarily due to increased pod and seed numbers, as an appropriate nitrogen supply during reproductive growth can compensate for plant nitrogen deficiency (Tamagno, 2018). Yield reduction under high nitrogen application was mainly attributed to enhanced vegetative growth, which inhibited flower and pod formation (Li et al., 2024). Comparative analysis between cultivars revealed that Xinnongdou 2 yielded significantly higher than Xindadou 27. This difference was primarily attributed to the more developed root system of Xinnongdou 2, which contributed to its stronger soil nutrient uptake capacity. Subsequently, through more efficient nitrogen conversion and allocation, a greater proportion of the absorbed nitrogen was directed toward pod and seed formation, enabling the plants to achieve higher yield and NUE. Therefore, in future breeding for high yield and high efficiency, emphasis could be placed on selecting traits related to superior root architecture and high pod and seed number potential. This provides important phenotypic and physiological foundations for developing new soybean varieties that combine high yield with efficient nutrient use. We conducted a structural equation modelling analysis to evaluate the relationships among root morphological traits, nitrogen accumulation and yield at the R_5_ stage. The analysis revealed that RDD, RLD, and RSD positively regulated root nitrogen accumulation with path coefficients of 0.887, 0.205, and 0.198, respectively, explaining why superior root morphological characteristics facilitate nitrogen absorption and utilization from soil (Li et al., 2016). Root nitrogen accumulation positively regulated aboveground canopy nitrogen accumulation, which in turn positively influenced yield, accounting for yield variations among different soybean cultivars (Kiba and Krapp, 2016).
Conclusion
5
This study demonstrates that nitrogen application at 180 kg·ha^-^¹ during the beginning pod stage significantly promoted root development in both soybean cultivars, substantially increasing root length density, root dry weight density, and root surface area density in the 0–60 cm soil layer, while enhancing the activity of key nitrogen assimilation enzymes (NR, GS/GOGAT) in the roots. In contrast, either excessive or insufficient nitrogen supply inhibited root growth and reduced root mass. Root morphological traits exhibited a significant positive regulatory effect on plant nitrogen accumulation, promoting efficient nitrogen uptake and translocation, thereby increasing soybean yield. The high-yielding cultivar Xinnongdou 2, with its greater root mass and nitrogen uptake capacity, not only ensured the material supply required for high yield but also effectively mitigated the risks of growth imbalance associated with excessive nitrogen application.
The reference list from the paper itself. Each links out to its DOI / PubMed record.
- 1Anas M. Liao F. Verma K. K. Sarwar M. A. Mahmood A. Chen Z.-L. . (2020). Fate of nitrogen in agriculture and environment: agronomic, eco-physiological and molecular approaches to improve nitrogen use efficiency. Biol. Res. 53, 47. doi: 10.1186/s 40659-020-00312-4, PMID: 33066819 PMC 7565752 · doi ↗ · pubmed ↗
- 2Andrews M. Lea P. J. Raven J. A. Lindsey K. (2004). Can genetic manipulation of plant nitrogen assimilation enzymes result in increased crop yield and greater N‐use efficiency? An assessment. Ann. Appl. Biol. 145, 25–40. doi: 10.1111/j.1744-7348.2004.tb 00356.x · doi ↗
- 3Cafaro La Menza N. Monzon J. P. Specht J. E. Grassini P. (2017). Is soybean yield limited by nitrogen supply? Field Crops Res. 213, 204–212. doi: 10.1016/j.fcr.2017.08.009 · doi ↗
- 4Cafaro La Menza N. Monzon J. P. Specht J. E. Lindquist J. L. Arkebauer T. J. Graef G. . (2019). Nitrogen limitation in high-yield soybean: Seed yield, N accumulation, and N-use efficiency. Field Crops Res. 237, 74–81. doi: 10.1016/j.fcr.2019.04.009 · doi ↗
- 5Chen J. Liu L. Wang Z. Zhang Y. Sun H. Song S. . (2020). Nitrogen fertilization increases root growth and coordinates the root–shoot relationship in cotton. Front. Plant Sci. 11. doi: 10.3389/fpls.2020.00880, PMID: 32655605 PMC 7324761 · doi ↗ · pubmed ↗
- 6Dai X. Xiao L. Jia D. Kong H. Wang Y. Li C. . (2014). Increased plant density of winter wheat can enhance nitrogen–uptake from deep soil. Plant Soil 384, 141–152. doi: 10.1007/s 11104-014-2190-x · doi ↗
- 7De Borja Reis A. F. Moro Rosso L. Purcell L. C. Naeve S. Casteel S. N. Kovács P. . (2021). Environmental factors associated with nitrogen fixation prediction in soybean. Front. Plant Sci. 12. doi: 10.3389/fpls.2021.675410, PMID: 34211487 PMC 8239404 · doi ↗ · pubmed ↗
- 8Fehr W. R. Caviness C. E. Burmood D. T. Pennington J. S. (1971). Stage of development descriptions for soybeans, glycine max (L.) merrill. Crop Sci. 11, 929–931. doi: 10.2135/cropsci 1971.0011183 X 001100060051 x · doi ↗