Mechanistic investigation into the differences in growth performance and resistance to spring viremia of carp virus in common carp
Kai Lei, Qiang Li, Jian Zhou, Yong-Qiang Deng, Ping Ouyang, Yang Feng, Sen-Yue Liu, Yan Liu, Hua Ye, Cheng-Yan Mou

TL;DR
This study explores how faster-growing carp are more vulnerable to a virus, uncovering genetic and metabolic links between growth and disease resistance.
Contribution
The study identifies specific genes and metabolites associated with growth and resistance to SVCV in common carp using multi-omics approaches.
Findings
Fast-growing carp showed significantly lower survival rates after SVCV infection compared to slow-growing carp.
Genes in the Grey module were positively linked to growth but negatively to resistance, with key hub genes gsta4, adh8b, and gimap7.
Metabolite modules Florawhite and Grey60 were associated with growth and survival, highlighting nutrient and detoxification pathways.
Abstract
Spring viremia of carp virus (SVCV) is a highly infectious pathogen threatening common carp (Cyprinus carpio). Hence, implementing protective measures is crucial to safeguard aquatic species and minimize economic impacts, including pharmaceuticals, vaccines, and breeding of resistant varieties. Common carp is a major aquaculture species, with breeding programs primarily focused on enhancing growth performance. However, evidence indicates that accelerated growth may compromise disease resistance, suggesting a trade-off between these traits. We challenged two carp populations with contrasting growth rates using SVCV and performed integrated multi-omics analyses. Survival analysis showed that fast-growing carp had significantly lower survival than slow-growing carp, with growth negatively correlated with resistance (r = -0.83). RNA-seq analysis of head kidney tissues identified a Grey…
Genes, proteins, chemicals, diseases, species, mutations and cell lines named across the full text — each resolved to its canonical identifier and authoritative record.
Click any figure to enlarge with its caption.
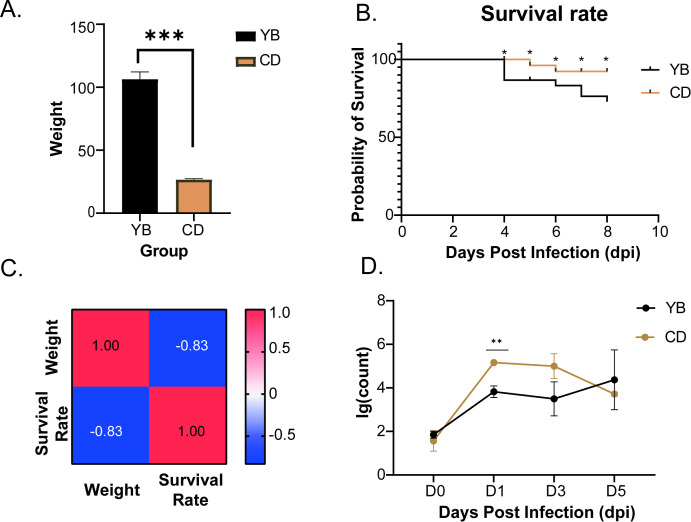 Figure 1
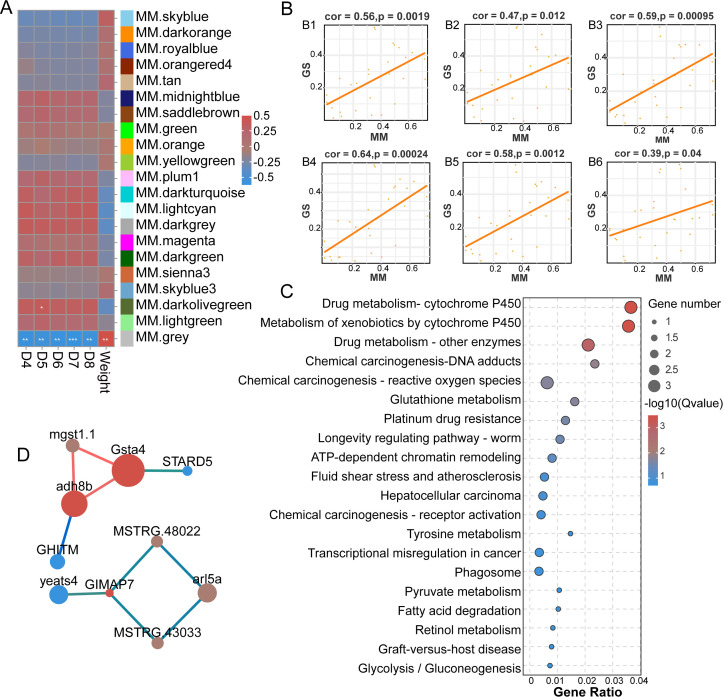 Figure 2
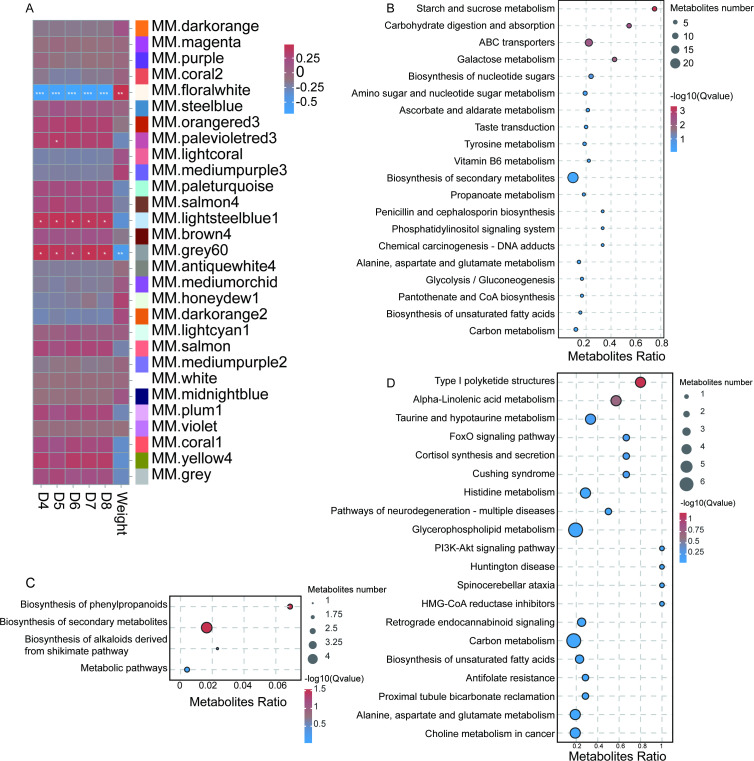 Figure 3
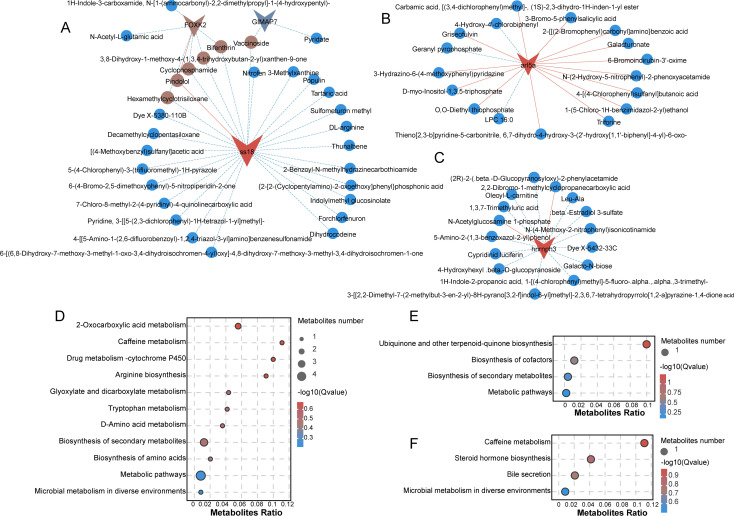 Figure 4
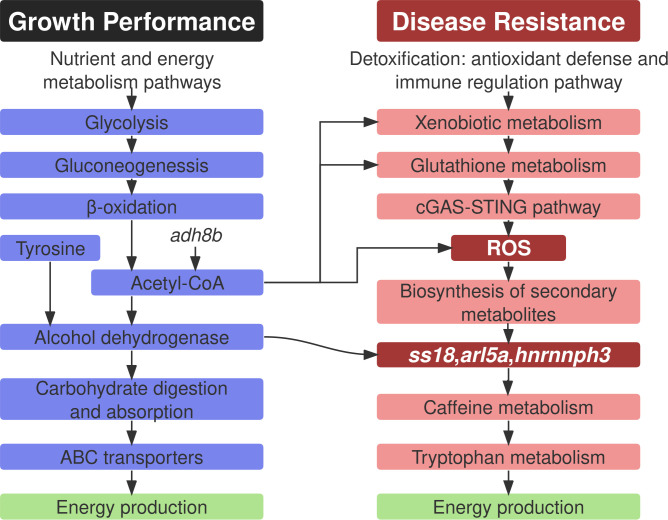 Figure 5
Peer Reviews
No public reviews on file for this paper yet. If you reviewed it on a platform where reviews are public (OpenReview, ICLR, NeurIPS, ICML), you can paste yours below so the community can read it here.
Videos
No videos yet. Explain this paper in a talk, walkthrough, or lecture? Add one.
Taxonomy
TopicsAquaculture disease management and microbiota · Invertebrate Immune Response Mechanisms · Aquaculture Nutrition and Growth
Introduction
1
The common carp, a representative species of the family Cyprinidae within the order Cypriniformes, is one of the most extensively farmed freshwater fish worldwide (1). According to the Food and Agriculture Organization of the United Nations (FAO) The State of World Fisheries and Aquaculture 2024 (SOFIA 2024), global carp production reached 31,788 thousand tons in 2022. This accounted for 51.7% of all finfish species (2). In China, carp is recognized as one of the major freshwater aquaculture species. Based on the 2025 China Fisheries Statistical Yearbook, carp production in 2024 was approximately 2,939 thousand tons, ranking fourth among all cultured fish species nationwide. The rapid growth rate and strong environmental adaptability of carp have contributed to its status as one of the most important freshwater aquaculture species globally (3). Over the past decades, selective breeding and hybridization have been widely implemented to improve growth performance in carp (4, 5). However, increasing evidence suggests that fast-growing individuals often exhibit reduced resistance to pathogens and environmental stressors (6, 7). In coho salmon (Oncorhynchus kisutch), for instance, fast-growing strains have been shown to allocate fewer resources to immune defense. Molecular evidence further indicates crosstalk between the growth hormone/insulin-like growth factor (GH/IGF) axis and innate immune signaling pathways (8). “Similarly, studies in carp have revealed that fast-growing individuals are enriched in metabolic pathways such as Glycolysis, Nucleotide metabolism, and Riboflavin metabolism. In contrast, slow-growing individuals display higher expression of genes associated with immune-related pathways, including Th17 cell differentiation, NOD-like receptor signaling, C-type lectin receptor signaling, and Autophagy (9). These findings underscore the complexity of balancing growth and immunity in aquaculture breeding programs. Consequently, breeding for immunocompetence has emerged as a pivotal strategy to simultaneously enhance growth performance and disease resistance in genetic improvement initiatives (10).
SVCV, a member of the Rhabdoviridae family, is the causative agent of spring viremia of carp (SVC). This disease is highly contagious and lethal, affecting cyprinid fish. SVC is characterized by acute hemorrhage and septicemia. It has been reported globally and often results in significant mortality and substantial economic losses in aquaculture. Due to its severe impact on fish farming, SVC has been classified as a Category I animal disease in China. It is also listed by the World Organization for Animal Health (WOAH) in the aquatic animal disease catalog. In recent years, increasing attention has been paid to the molecular mechanisms underlying SVCV infection. High-throughput approaches such as transcriptomics and proteomics have revealed that SVCV infection leads to the upregulation of numerous immune- and autophagy-related genes (11–13). In zebrafish embryos, SVCV infection induces interferon (IFN) expression. Overexpression of IFN enhances resistance to SVCV (14, 15). Moreover, overexpression of zebrafish mitochondrial antiviral signaling protein (MAVS) in fish cells significantly promotes IFN production. This, in turn, suppresses SVCV replication (16). Interestingly, splicing variants of zebrafish MAVS can inhibit RIG-I-mediated IFN induction within the RLR signaling pathway (17, 18). In common carp challenged with SVCV, immunoglobulin classes IgM and Ings were markedly upregulated in the head kidney following infection (19). These studies have primarily focused on the virology, epidemiology, diagnostics, and single-gene molecular and immunological responses to SVCV. However, the mechanisms linking host growth traits and disease resistance remain largely unexplored. Elucidating these integrative host-pathogen interactions is essential for advancing genetic improvement strategies and enhancing disease resilience in aquaculture species.
This study investigates the mechanistic basis of variation in SVCV resistance across common carp populations with divergent growth rates. The analysis is conducted from an immunogenetic breeding perspective. By integrating phenotypic assessments with molecular-level analyses, we reveal the potential immunological trade-offs associated with rapid growth. Our findings provide a theoretical foundation for the coordinated improvement of growth performance and disease resistance in aquaculture breeding programs.
Materials and methods
2
Fishes and virus
2.1
One-year-old common carp for experimentation were obtained from commercial breeding farms in Yibin (YB) and Chengdu (CD), Sichuan Province, China. The SVCV strain used in this study was provided by Professor Ouyang Ping (Sichuan Agricultural University). All procedures followed protocols and ethical guidelines approved by the Sichuan Fisheries Research Institute (Approval No. 20220323001A).
Construction of SVCV infection model
2.2
Fish from the YB (106.4 ± 5.82 g) and CD (26.66 ± 0.75 g) populations were randomly allocated into six groups per population, each consisting of 15 individuals. All groups were maintained in sealed aquaria measuring 65 cm × 55 cm × 45 cm. Experimental groups from each population were intraperitoneally injected with 200 μL of SVCV filtrate. Control groups received an equal volume of phosphate-buffered saline (PBS). The water temperature was consistently maintained at 18 ± 0.5 °C. Continuous filtration and daily water exchanges were performed to ensure optimal water quality. Mortalities were promptly removed from the tanks throughout the experiment.
Sample collection
2.3
Sampling was performed at four timepoints: prior to infection (0 days post infection, dpi), and at 1, 3, and 5 dpi. At each designated timepoint, five fish were randomly selected from each population. For euthanasia, fish were immersed in a solution of tricaine methanesulfonate (MS-222; Sigma-Aldrich, USA) at a concentration of 350 mg/L. The solution was buffered with an equimolar amount of sodium carbonate. Fish were maintained in the solution until complete cessation of opercular movement was observed. This typically occurred within 10–15 minutes and ensured humane euthanasia. Immediately following euthanasia, fish were dissected using sterile surgical instruments. The following tissues were collected: head kidney, liver, spleen, and trunk kidney. All samples were rapidly frozen in liquid nitrogen and subsequently stored at -80 °C for downstream molecular analyses. Additionally, liver and spleen tissues were immersion-fixed in 4% paraformaldehyde (PFA; Biosharp, Hefei, China) at 4 °C for 24 hours.
Histological analysis
2.4
Tissues fixed in 4% PFA were paraffin-embedded, sectioned at 4 µm, stained with hematoxylin and eosin (H&E), and digitized using a pathology scanner (SQS-40R; Shengqiang Technology, Shenzhen, China).
RNA-seq library construction, sequencing
2.5
Total RNA was extracted from head kidney tissues of YB and CD common carp populations at 0,1,3, and 5 days post-infection using TRIzol reagent (Invitrogen, USA). RNA integrity and concentration were evaluated using the Agilent 2100 Bioanalyzer (Agilent Technologies, Palo Alto, USA). Polyadenylated mRNA was enriched using magnetic mRNA capture beads and subsequently fragmented by heat treatment. The resulting RNA fragments were reverse-transcribed into cDNA. The cDNA was purified and processed using the Hieff NGS^®^ Ultima Dual-mode mRNA Library Prep Kit. Library preparation steps included end repair, A-tailing, and ligation of Illumina-compatible sequencing adapters. Size selection of ligation products was performed via agarose gel electrophoresis. PCR amplification was then conducted to enrich the final libraries. Sequencing was conducted on the Illumina HiSeq™ 2500 platform (Gene Denovo Biotechnology Co., Guangzhou, China).
Gene annotation
2.6
Raw sequencing data were processed using CLC Genomics Workbench (CLC bio, Denmark) to remove adapter sequences. Adapter sequences, low-quality reads (Q score < 20), ambiguous nucleotides, and short reads shorter than 30 bp were removed. This resulted in high-quality clean reads. These clean reads were then aligned to the common carp reference genome (ASM1834038v1) using HISAT2 (version 2.2.1). Transcript assembly was performed with StringTie (version 2.1.7), and gene expression levels were quantified using RSEM (version1.3.3), with transcript abundance expressed as transcripts per million (TPM).
WGCNA analysis
2.7
WGCNA was conducted using relevant R packages, including edgeR (version 3.36.0). The analysis assumed a scale-free topology for the gene co-expression network. A gene co-expression similarity matrix and adjacency function were constructed to model network connections. Topological overlap coefficients (TOC) between nodes were calculated to measure network interconnectedness. Hierarchical clustering was then performed to generate a dendrogram. Finally, the relationships between gene significance (GS) and module membership (MM) were assessed. This analysis was used to identify modules with potential biological relevance.
Extraction, quantitative and qualitative analysis of metabolites
2.8
Fresh tissue samples (70 mg) were accurately weighed and placed into 2 mL centrifuge tubes. Each sample was mixed with 1,000 μL of pre-chilled methanol (−20 °C), vortexed for 1 minute, and centrifuged at 12,000 rpm for 10 minutes at 4 °C. A total of 450 μL of the resulting supernatant was transferred into a new 2 mL tube and completely dried using a vacuum concentrator. The dried residue was reconstituted in 150 μL of 80% methanol containing 4 ppm 2-chlorophenylalanine (pre-chilled at −20 °C). The solution was then filtered through a 0.22 μm membrane. The filtrate was transferred into LC-MS vials for subsequent analysis.
Quality control (QC) samples were prepared by pooling 20 μL aliquots from each test sample. Metabolite profiling and relative quantification were performed using a liquid chromatography–mass spectrometry (LC-MS) system equipped with an AB SCIEX Triple TOF 6600 mass spectrometer (Shanghai, China). Raw mass spectrometry data were processed using the XCMS package in R, including peak detection, filtering, alignment, normalization, noise reduction, scaling, and imputation of missing values. A quantitative metabolite matrix was generated, and compound identification was carried out using public databases such as HMDB, MassBank, LipidMaps, mzCloud, KEGG, as well as an in-house spectral library.
To minimize systematic bias, LOESS signal correction was applied based on QC samples. Metabolites with a relative standard deviation (RSD) greater than 30% in QC samples were excluded from further analysis. Multivariate statistical analysis was performed using R software. Partial least squares discriminant analysis (PLS-DA) was employed for dimensionality reduction and visualization of metabolic differences among groups. Prior to analysis, data were scaled, and score plots were generated to illustrate group separation. Statistical significance of metabolites was determined based on P-values (<0.05), variable importance in projection (VIP > 1), and fold change (FC) between groups. Metabolites meeting all criteria were considered statistically significant and selected as potential biomarkers.
Combined transcriptomic and metabolomics analysis
2.9
An integrated analysis of transcriptomic and metabolomic data was conducted using KEGG pathway mapping to investigate the functional relationships between genes and metabolites. Pearson correlation coefficients were calculated to evaluate the associations between genes and metabolites. Gene–metabolite pairs with an absolute correlation coefficient greater than 0.5 were ranked. The top 200 pairs were selected for network visualization. This approach facilitated the identification of key genes and metabolites occupying central roles within the regulatory network.
Statistical analysis
2.10
All numerical data from the experiments were analyzed by calculating the mean and the Standard Error of the Mean (SEM) from three independent replicates. Statistical significance between groups was assessed using one-way analysis of variance (ANOVA). Post hoc multiple comparisons were then performed with SPSS software version 26.0 (IBM Corp., Armonk, NY, USA).
Result
3
Differences in disease resistance between common carp populations with different growth rates
3.1
To investigate the relationship between growth and disease resistance, we collected two common carp populations with distinct growth rates and conducted artificial SVCV infection experiments. Fish in the experimental groups showed obvious clinical symptoms, including exophthalmia, abdominal distension, hemorrhages on the skin and fin bases, and a swollen, protruding anus (Supplementary Figure S1A). Histopathological analysis of head-kidney tissues revealed autophagy and necrosis in the livers of infected fish, as well as necrosis in their spleens after SVCV infection (Supplementary Figures S1B, C). The growth rate of the common carp population from YB was significantly higher than that of the population from CD (p < 0.05) (Figure 1A). To determine whether growth rate correlates with disease resistance, both populations were infected with SVCV and monitored over eight days. The YB population exhibited a survival rate of 72.8%, whereas the CD population reached 92.3%. The YB population experienced its first mortality on day 4, followed by continuous deaths from days 6 to 8. In contrast, the CD population showed initial mortality on day 5, with deaths occurring only on 5 dpi and 6 dpi (Figure 1B). Correlation coefficient analysis indicated a negative correlation between growth and disease resistance in common carp, with a Pearson correlation coefficient of –0.83 (Figure 1C). Viral copy numbers in the head-kidney tissues of the two populations were detected at different time points (Figure 1D). Apart from the first day post infection, when the viral copy number in the CD population was significantly higher than that in the YB population, no significant differences were observed on other days. Interestingly, the viral copy number in the CD population peaked on the first day of infection and then gradually decreased. In contrast, the viral copy number in the YB population continued to rise. Collectively, these findings indicate that the YB population exhibits superior growth performance but reduced disease resistance.
*Basic differences between the YB population and the CD population. (A) There is an extremely significant difference in weight between the two groups. (B) Changes in the survival rates of the two groups over time. (C) Heatmap of the correlation between body weight and survival. (D) The relationship between the viral copy numbers of the two groups over time. (*p < 0.05, **p < 0.01, **p < 0.001).
Transcriptional correlation analysis of growth and disease resistance in common carp populations
3.2
In order to elucidate the antiviral mechanisms underlying the distinct growth rates observed in two common carp populations, we performed transcriptome sequencing of head-kidney tissues. From the full set of expressed genes identified in both populations, a total of 22,175 genes with an FPKM ≥ 5 in at least one sample were selected for subsequent WGCNA (Supplementary Table S1; Figure 2). Interestingly, we identified a module—designated as the Grey module—that exhibited a significant positive correlation with growth traits, while showing a significant negative correlation with survival rate (Figures 2A, B). A total of 28 genes were identified within the Grey module (Supplementary Table S2). KEGG enrichment analysis revealed that these genes were involved in several pathways primarily focused on xenobiotics biodegradation and metabolism (Drug metabolism - cytochrome P450, Metabolism of xenobiotics by cytochrome P450, and Drug metabolism - other enzymes), Human Diseases, and other nutrient metabolism (Glutathione metabolism, Tyrosine metabolism, Fatty acid degradation, and Glycolysis/Gluconeogenesis) (Figure 2C). The Human Diseases category mainly included pathways associated with cancer. To further reveal the interactions among these genes, we performed a PPI network analysis. This analysis identified three hub genes—gsta4, gimap7, and adh8b—which exhibited the highest degree of connectivity, indicating their central roles within the network (Figure 2D). Altogether, these findings suggest that the observed differences in growth performance and disease resistance between the two populations may be primarily attributed to variations in pathways related to xenobiotic metabolism, energy metabolism, cell proliferation, and apoptosis.
Gene analysis of head kidney transcriptome sequencing in two populations of common carp. (A) The heat map of the relationship between each module and the Weight with survival rate through WGCNA analysis. (B) MM-GS scatter plots of the Grey module with survival rates (B1-B5: D4-D8) and Weight (B6). (C) The KEGG enrichment bubble chart of genes in Grey module. (D) PPI network diagram of key genes.
Metabolomics correlation analysis of growth and disease resistance in common carp populations
3.3
To further elucidate the antiviral mechanisms underlying the divergent growth rates observed in two common carp populations, we performed metabolomic profiling of liver tissues. From the full set of identified metabolites, 22,682 were selected for WGCNA (Supplementary Table S3; Supplementary Figure S2; Figure 3). Consistent with transcriptomic findings, the Florawhite module showed a highly significant positive correlation with body weight and a significant negative correlation with survival rate (Figure 3A). In contrast, the Grey60 module showed a negative correlation with body weight and a positive correlation with survival rate. The Lightsheelblue module showed only a positive correlation with survival rate (Figure 3A). A total of 1,686, 185, and 1,856 metabolites were identified in the Florawhite, Lightsheelblue, and Grey60 modules, respectively (Supplementary Tables S4–S6). KEGG pathway analysis indicated that the metabolites in the Florawhite module were significantly enriched in four pathways: Starch metabolism and Sucrose metabolism, Galactose metabolism, and ABC transporters (p < 0.05) (Figure 3B). Metabolites in the Lightsheelblue module showed significant enrichment in two pathways, namely Biosynthesis of phenylpropanoids and Biosynthesis of secondary metabolites (p < 0.05) (Figure 3C). Similarly, in the Grey60 module, significant enrichment was observed for two pathways: Type I polyketide structures and Alpha-linolenic acid metabolism (p < 0.05) (Figure 3D). Taken together, these findings suggest that the divergent growth performance and disease resistance between the two common carp populations primarily stem from distinct metabolic strategies. These strategies govern the synthesis, trafficking, and functionalization of key molecules, as well as differences in the organisms’ intrinsic digestive and absorptive capacities.
metabolites analysis of liver metabolomic in two populations of common carp. (A) The heat map of the relationship between each module and the Weight with survival rate through WGCNA analysis. (B–D) The KEGG enrichment bubble chart of metabolites in module. (B) Florawhite module. (C) Lightsheelblue module. (D) Grey60 module.
Association between genes and metabolites
3.4
To further elucidate how genes interact with metabolites to regulate growth and disease resistance, we performed correlation analysis between the genes in the aforementioned Grey module and all metabolites. As shown in Figure 4, the gene with the highest number of associated metabolites is ss18, while the metabolites linked to foxk2 largely overlap with those of ss18 (Figure 4A). Subsequently, arl5a (Figure 4B) and hnrnph3 (Figure 4C) exhibited the greatest enrichment of metabolites. Other genes, including thap11, cep44, mhcII, yeats4, stard5, dipk2ab and mgst1.1, showed intermediate levels of metabolite associations (Supplementary Figure S3). In contrast, prkd4, gsta4, tc1a, nfic, mpx, ghith, gimap7 and Gene adh8b, were associated with relatively few metabolites (Supplementary Figure S3). These findings suggest that ss18, arl5a, and hnrnph3 may play critical roles in balancing growth and disease resistance in common carp. Subsequently, KEGG enrichment analysis was performed on their associated metabolites. The metabolites correlated with ss18 were significantly enriched in pathways related to essential growth substrates, such as Metabolic pathways, Arginine biosynthesis, and Biosynthesis of amino acids. They were also enriched in energy metabolism pathways, including 2-Oxocarboxylic acid metabolism and Glyoxylate and dicarboxylate metabolism (Figure 4D). Additionally, enrichment in Caffeine metabolism, Drug metabolism – cytochrome P450, and Biosynthesis of secondary metabolites suggests a role in detoxification and antioxidant defense. Pathways such as Tryptophan metabolism and D-Amino acid metabolism further imply involvement in immune regulation. These findings indicate that ss18 may contribute to both growth performance and disease resistance in fish through multifaceted metabolic regulation. The enrichment of arl5a-associated metabolites in general biosynthesis pathways—specifically in Ubiquinone and other terpenoid-quinone biosynthesis and Cofactor biosynthesis—underscores their critical roles in both energy metabolism and antioxidant defense (Figure 4E). Metabolites correlated with hnrnph3 were enriched in diverse metabolic processes, including Caffeine metabolism, Steroid hormone biosynthesis, Bile secretion, and Microbial metabolism in diverse environments (Figure 4F). This indicates that hnrnph3 may play a critical role in digestion and nutrient absorption, environmental adaptation, and immune modulation.
Integrated analysis of Grey module gene–metabolite associations. (A–C) Correlation networks between key genes and associated metabolites: (A) ss18, foxk2, and gimap7; (B) arl5a; (C) hnrmph3. (D–F) KEGG pathway enrichment of metabolites identified in (A–C), respectively: (D) metabolites associated with genes in (A); (E) metabolites associated with genes in (B); (F) metabolites associated with genes in (C).
Discussion
4
It is well documented that different breeds exhibit distinct growth performances (20, 21), a phenomenon that plays a pivotal role in the selective breeding of high-yield aquaculture species. However, populations with enhanced growth traits often display reduced tolerance to environmental stressors (22), a trend consistent with our findings. In this study, we observed that the YB population demonstrated significantly higher growth performance but lower disease resistance compared to the CD population. Body weight is a key indicator of growth performance, with higher weight at the same age reflecting superior growth capacity (23). In our experiment, both populations were one year old, yet the average body weight of the YB population was 106.4 g, while that of the CD population was only 26.7 g-a highly significant difference. Post-SVCV challenge mortality metrics, including time to first death and overall mortality rate, are critical indicators of disease resistance (24). The YB population exhibited earlier onset of mortality—one day ahead of the CD population—and a significantly higher mortality rate. Viral load in tissues is another important measure of disease resistance, as lower viral titers typically indicate stronger antiviral responses and better immunocompetence (25). Additionally, our results showed that the CD population, which exhibited stronger disease resistance, had higher viral loads at 1 and 3 DPI. This phenomenon may be explained by the fact that all fish were injected with the same volume of viral suspension regardless of body weight. Given that CD individuals were significantly smaller than YB individuals, the initial viral dose per gram of body weight was substantially higher in the CD group This factor potentially contributed to the elevated viral load.
Through transcriptomic, metabolomic, and integrative analyses, this study systematically elucidates the molecular mechanisms underlying the divergent growth performance and disease resistance between two common carp populations. Multi-omics results consistently point to two major functional modules driving these phenotypic differences: (1) nutrient and energy metabolism pathways associated with growth performance, (2) detoxification, antioxidant defense, and immune regulation pathways associated with disease resistance.
Rapid growth in fish requires efficient nutrient absorption and energy conversion. Transcriptomic analysis revealed that activation of glycolysis facilitates the utilization of dietary polysaccharides, thereby enhancing feed conversion efficiency (26). Gluconeogenesis complements glycolysis to maintain glucose homeostasis and ensures a stable energy supply (27). Fatty acid degradation via β-oxidation in mitochondria or peroxisomes generates acetyl-CoA. This metabolite enters the tricarboxylic acid (TCA) cycle, which is an essential process for sustained energy production (28). The alcohol dehydrogenase gene Adh8b, highly expressed in the YB population, catalyzes the oxidation of alcohols. It contributes to pyruvate metabolism and fatty acid degradation, increasing acetyl-CoA production and supporting rapid cell proliferation (29). Tyrosine, a semi-essential amino acid derived from phenylalanine, serves as a precursor for growth-related hormones such as adrenaline, noradrenaline, triiodothyronine (T3), and thyroxine (T4) (30). Dietary supplementation with tyrosine has been shown to significantly improve growth rate and weight gain in triploid rainbow trout (Oncorhynchus mykiss) (31).
Metabolomic analysis further supports these findings. In the Florawhite module, which was positively correlated with growth, pathways related to carbohydrate digestion and absorption—such as starch and sucrose metabolism and galactose metabolism—were significantly enriched. Carbohydrates are a major energy source for fish under aquaculture conditions (32). Efficient Starch metabolism and Sucrose metabolism enhances feed utilization, and forms the basis for rapid growth. Galactose, derived from lactose hydrolysis, is converted into glucose through a series of enzymatic reactions (33). UDP-galactose, an intermediate product, is a key substrate for glycosylation reactions. It contributes to the synthesis of membrane glycoproteins and glycolipids, which are essential for signal recognition and immune function (34). ABC transporters, which rely on ATP hydrolysis, were also enriched. They are known to facilitate transmembrane transport of nutrients and drugs, supporting both nutrient uptake and energy metabolism (35).
Integrative analysis revealed that metabolites associated with ss18 and arl5a were significantly enriched in arginine biosynthesis, biosynthesis of amino acids, 2-oxocarboxylic acid metabolism, and glyoxylate and dicarboxylate metabolism. Amino acids are fundamental building blocks for protein synthesis, which is essential for muscle development and cellular growth. Arginine, an essential amino acid for fish, has been shown to improve feed conversion efficiency and promote growth (36). The 2-oxocarboxylic acid metabolism pathway connects the degradation of multiple amino acids to the TCA cycle. This indicates its dual role in amino acid utilization and energy production. Glyoxylate and Dicarboxylate metabolism pathway, typically active in plants and microorganisms, enables cells to metabolize two-carbon compounds such as ethanol and acetate when monosaccharides are unavailable (37). This pathway can generate glucose from acetyl-CoA, supporting cell growth (38). These findings suggest that the activation of these genes may promote growth performance through coordinated regulation of amino acid synthesis and energy metabolism.
Enhanced disease resistance depends on robust detoxification mechanisms and immune regulation. Transcriptomic analysis identified significant enrichment of xenobiotic metabolism pathways, including drug metabolism via cytochrome P450 and other phase I and II enzymes such as UDP-glucuronosyl transferases (UGTs) and sulfotransferases (SULTs). These enzymes convert exogenous compounds into water-soluble metabolites for excretion (39–41). These pathways collectively protect fish from xenobiotic toxicity and contribute to stress resilience. In fish, xenobiotic metabolism is not limited to the detoxification of pollutants or drugs but also regulates endogenous stress responses triggered by viral infection. Tort and Balasch (42) noted that the fish immune system must remain sensitive to both xenobiotics and pathogens, since pollutants and other exogenous compounds in aquatic environments, together with pathogen exposure, impose stress on the immune system. Sánchez Velázquez (43) further emphasized that under chronic environmental stress, fish activate detoxification and antioxidant systems such as cytochrome P450, glutathione peroxidase, and catalase, which not only participate in xenobiotic metabolism but also modulate oxidative stress and cytokine production, thereby influencing immune responses. Key genes such as gsta4 and mgsta1, members of the glutathione S-transferase (GST) family, were consistently enriched in cancer-related pathways including chemical carcinogenesis, hepatocellular carcinoma, and platinum drug resistance. These enzymes catalyze the conjugation of glutathione with electrophilic compounds. This reaction facilitates detoxification and protects cells during immune activation (44). Activation of the Glutathione metabolism pathway further enhances cellular responses to oxidative stress (45). Beyond cancer, Glutathione metabolism is also a critical pathway during viral infection. It removes reactive oxygen species (ROS) and inflammation-associated molecules, thereby maintaining redox homeostasis and supporting host defense (46). Evidence from influenza virus studies shows that viruses can down−regulate antioxidant systems, such as G6PD activity, to promote oxidative stress and facilitate replication, highlighting the importance of glutathione in antiviral protection (47). More broadly, viral infections are associated with increased ROS and impaired antioxidant responses, which lead to inflammation and tissue damage. This further underscores the central role of glutathione metabolism in mitigating infection-induced stress (48).DNA adducts formed during viral infection can be recognized by the cGAS-STING pathway, triggering type I interferon responses (49). Reactive oxygen species (ROS) not only eliminate pathogens but also activate the RIG-I/MAVS pathway, promoting antiviral immunity (50). Gimap7, predominantly expressed in immune organs and T cells, has been shown to correlate positively with CD4^+^ and CD8^+^ T cell infiltration and immune checkpoint activity, highlighting its immunoregulatory potential (51).
Metabolomic analysis revealed that ABC transporters act synergistically with detoxification enzymes such as CYP450, enhancing the elimination of harmful substances (52). Several secondary metabolite biosynthesis pathways were enriched in modules positively correlated with disease resistance. Type-I polyketide structures, primarily produced by fungi, include bioactive compounds such as antibiotics (e.g., erythromycin) with antimicrobial properties (53, 54). Alpha-linolenic acid (ALA, 18:3n-3), an ω-3 polyunsaturated fatty acid, has demonstrated antiviral effects in grouper (Epinephelus lanceolatus) by activating NF-κB and Nrf2 signaling pathways to suppress SGIV infection (55). Phenylpropanoids, synthesized from phenylalanine, possess diverse biological activities including antioxidant, anti-inflammatory, antimicrobial, antidiabetic, neuroprotective, and anticancer effects (56). Secondary metabolites, derived from endogenous synthesis, symbiotic microbes, feed additives, or environmental stimuli, play multifaceted roles in antimicrobial defense, oxidative stress mitigation, and immune enhancement (57–59). Activation of the biosynthesis of secondary metabolites pathway may therefore enhance the adaptability of fish to environmental challenges.
Integrative analysis further highlighted the enrichment of caffeine metabolism, tryptophan metabolism, and D-amino acid metabolism pathways in metabolites associated with ss18, arl5a, and hnrnph3. Caffeine metabolism is linked to purine metabolism and redox regulation, contributing to antioxidant defense. In Nile tilapia (Oreochromis niloticus), caffeine supplementation has been shown to reduce oxidative damage and improve hepatic antioxidant enzyme activity under hypoxic stress (60). Tryptophan metabolism plays a critical role in immune regulation. In European seabass (Dicentrarchus labrax), dietary tryptophan supplementation enhanced the expression of anti-inflammatory cytokines and modulated macrophage activity during chronic inflammation (61). D-amino acids, primarily produced by bacteria, are metabolized by D-amino acid oxidase (DAO). This enzyme generates hydrogen peroxide (H_2_O_2_), which exhibits antimicrobial activity (62). In common carp, DAO is highly expressed in the intestine, hepatopancreas, and kidney, indicating its role in mucosal defense against exogenous D-amino acids (63). These findings suggest that the activation of these pathways may contribute to enhanced disease resistance through coordinated regulation of detoxification and immune-related metabolic processes.
To visualize the integrative multi-omics findings, we constructed a mechanistic diagram summarizing the key metabolic and immune pathways associated with growth performance and disease resistance (Figure 5). The left panel illustrates how nutrient absorption and energy metabolism via glycolysis, gluconeogenesis, and fatty acid β-oxidation support rapid growth, with adh8b contributing to acetyl-CoA production. The right panel highlights detoxification and immune pathways, in which ss18, arl5a, and hnrnph3 regulate secondary metabolite biosynthesis. Central nodes such as ROS and acetyl-CoA bridge metabolic and immune functions, reflecting the coordinated regulation of phenotype-specific traits.
Schematic representation of the molecular mechanisms underlying divergent growth performance and disease resistance in two common carp populations. The diagram is divided into two functional modules: Growth Performance (left) and Disease Resistance (right). Arrows indicate functional interactions and metabolic flow between pathways.
Conclusion
5
In summary, the phenotypic divergence in growth performance and disease resistance between the two carp populations is primarily driven by two functional modules: nutrient and energy metabolism, and detoxification, antioxidant defense, and immune regulation. The consistency across transcriptomic, metabolomic, and integrative analyses reinforces the reliability of these findings and underscores the central role of these pathways in shaping phenotypic outcomes. Future studies should explore the interactions among these pathways to provide deeper insights into population optimization and health management in aquaculture.
The reference list from the paper itself. Each links out to its DOI / PubMed record.
- 1Noureen A De Marco G Rehman N Jabeen F Cappello T . Ameliorative hematological and histomorphological effects of dietary trigonella foenum-graecum seeds in common carp (cyprinus carpio) exposed to copper oxide nanoparticles. Int J Environ Res Public Health. (2022) 19:13462. doi: 10.3390/ijerph 192013462, PMID: 36294038 PMC 9603639 · doi ↗ · pubmed ↗
- 2FAO . The state of world fisheries and aquaculture 2024. Blue transformation in action. Rome, Italy: FAO (2024). p. 264. doi: 10.4060/cd 0683 en · doi ↗
- 3Song Y Zhang W Song Y Zhang W . Balancing growth and sustainability in China’s carp aquaculture: Practices, policies, and sustainability pathways. Sustainability. (2025) 17. doi: 10.3390/su 17125593 · doi ↗
- 4Dong Z Nguyen NH Zhu W . Genetic evaluation of a selective breeding program for common carp cyprinus carpio conducted from 2004 to 2014. BMC Genet. (2015) 16:94. doi: 10.1186/s 12863-015-0256-2, PMID: 26219567 PMC 4518635 · doi ↗ · pubmed ↗
- 5Su S Raouf B He X Cai N Li X Yu J . Genome wide analysis for growth at two growth stages in a new fast-growing common carp strain (cyprinus carpio L.). Sci Rep. (2020) 10:7259. doi: 10.1038/s 41598-020-64037-w, PMID: 32350307 PMC 7190712 · doi ↗ · pubmed ↗
- 6Vandeputte M Gagnaire P-A Allal F . The european sea bass: A key marine fish model in the wild and in aquaculture. Anim Genet. (2019) 50:195–206. doi: 10.1111/age.12779, PMID: 30883830 PMC 6593706 · doi ↗ · pubmed ↗
- 7Morshedi V Hamedi S Pourkhazaei F Torfi Mozanzadeh M Tamadoni R Ebadi M . Larval rearing and ontogeny of digestive enzyme activities in yellowfin seabream (acanthopagrus latus, houttuyn 1782). Comp Biochem Physiol Part A: Mol Integr Physiol. (2021) 261:111044. doi: 10.1016/j.cbpa.2021.111044, PMID: 34371185 · doi ↗ · pubmed ↗
- 8Causey DR Kim J-H Stead DA Martin SAM Devlin RH Macqueen DJ . Proteomic comparison of selective breeding and growth hormone transgenesis in fish: Unique pathways to enhanced growth. J Proteomics. (2019) 192:114–24. doi: 10.1016/j.jprot.2018.08.013, PMID: 30153513 PMC 7086150 · doi ↗ · pubmed ↗