Integrating Meta-QTL Analysis and Genome-Wide Association Mapping in Ethiopian Sesame (Sesamum indicum L.) Reveals Novel Loci for Plant Height and Seed Coat Color
Adane Gebeyehu, Rodomiro Ortiz

TL;DR
This study identifies new genetic markers in Ethiopian sesame that control plant height and seed coat color, aiding future breeding efforts.
Contribution
The integration of meta-QTL and GWAS in Ethiopian sesame reveals novel loci and candidate genes not previously reported in Asian-focused research.
Findings
Meta-analysis identified six conserved QTL hotspots across chromosomes 3, 4, 6, 8, 9, and 11.
GWAS detected 36 significant associations, including novel loci on chromosomes 12 and 13.
Candidate genes like CYP90B1 and AP2/ERF are linked to hormonal and transcriptional mechanisms affecting plant architecture and seed coat color.
Abstract
Sesame (Sesamum indicum L.) is a nutrient-rich oilseed crop whose improvement can be accelerated by unlocking untapped genetic variation in African landraces. We integrated a global meta-quantitative trait loci (QTL) analysis with a genome-wide association study (GWAS) of Ethiopian germplasm to identify molecular markers for plant height and seed coat color. Meta-analysis of eight available data sources revealed six conserved QTL hotspots on chromosomes 3, 4, 6, 8, 9, and 11. Subsequently, GWAS on 200 Ethiopian accessions, represented by 3683 SNPs, detected 36 significant associations, including novel loci on chromosomes 12 and 13 not reported in Asian-focused research. Candidate genes assigned to these loci implicated key hormonal and transcriptional mechanisms: brassinosteroid biosynthesis (CYP90B1) and ethylene signaling (AP2/ERF) probably regulate plant architecture, while…
Genes, proteins, chemicals, diseases, species, mutations and cell lines named across the full text — each resolved to its canonical identifier and authoritative record.
Click any figure to enlarge with its caption.
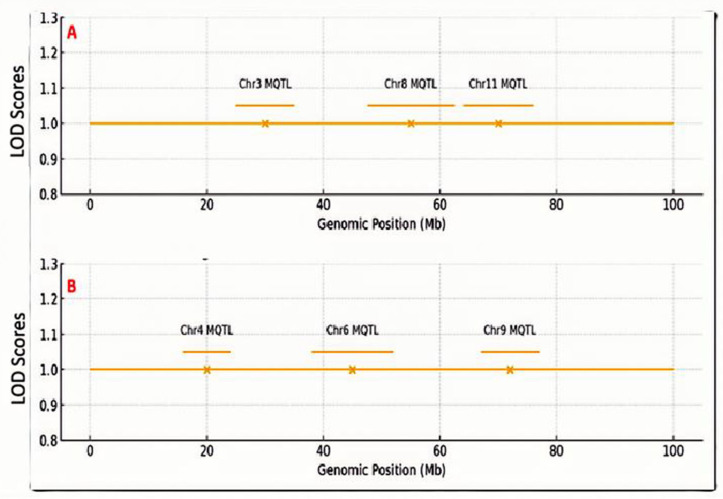 Figure 1
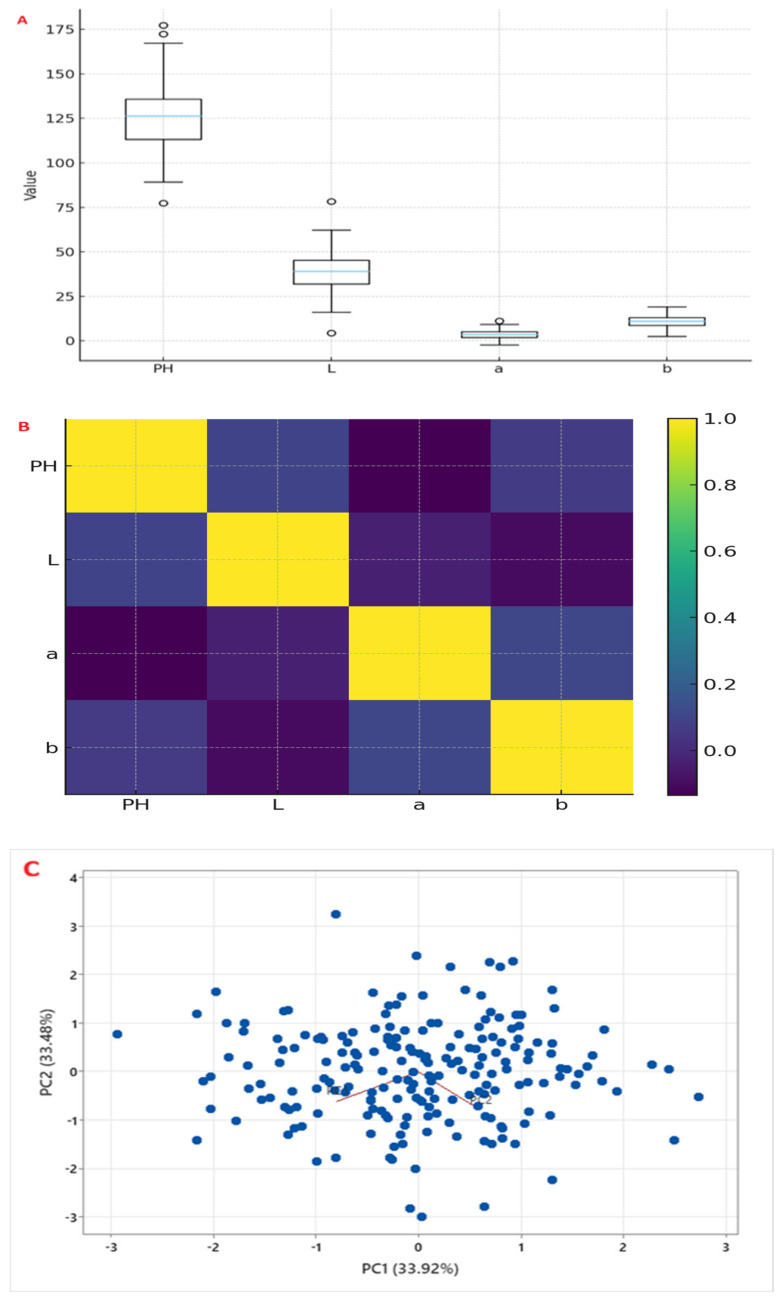 Figure 2
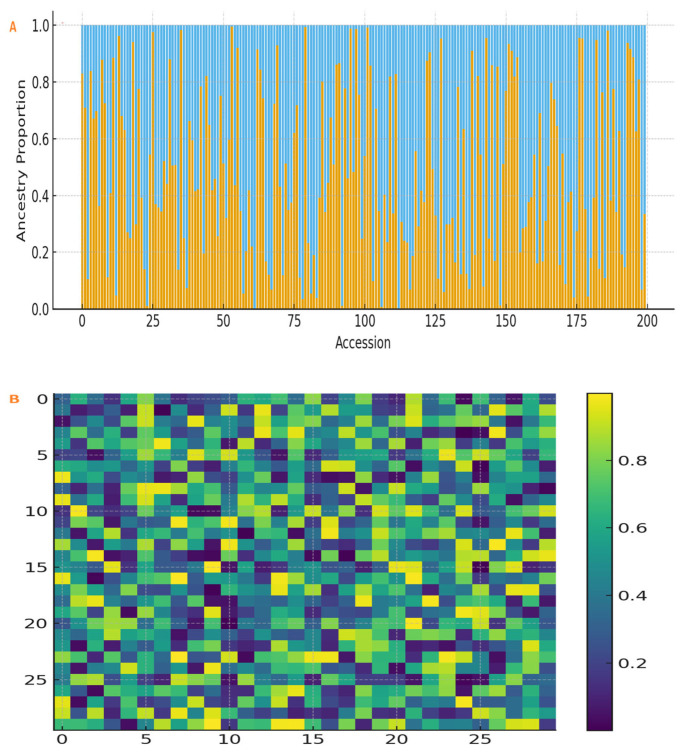 Figure 3
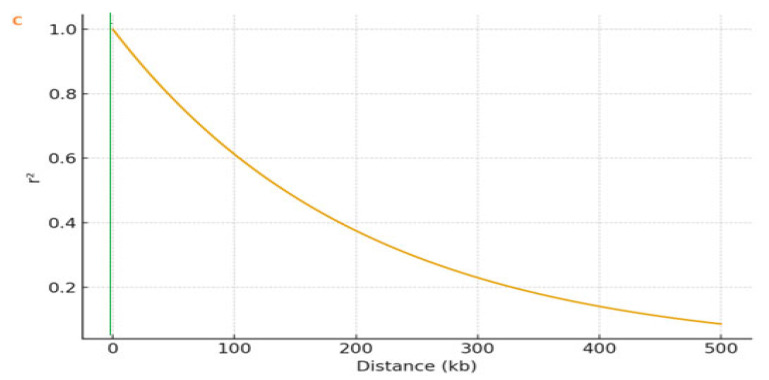 Figure 4
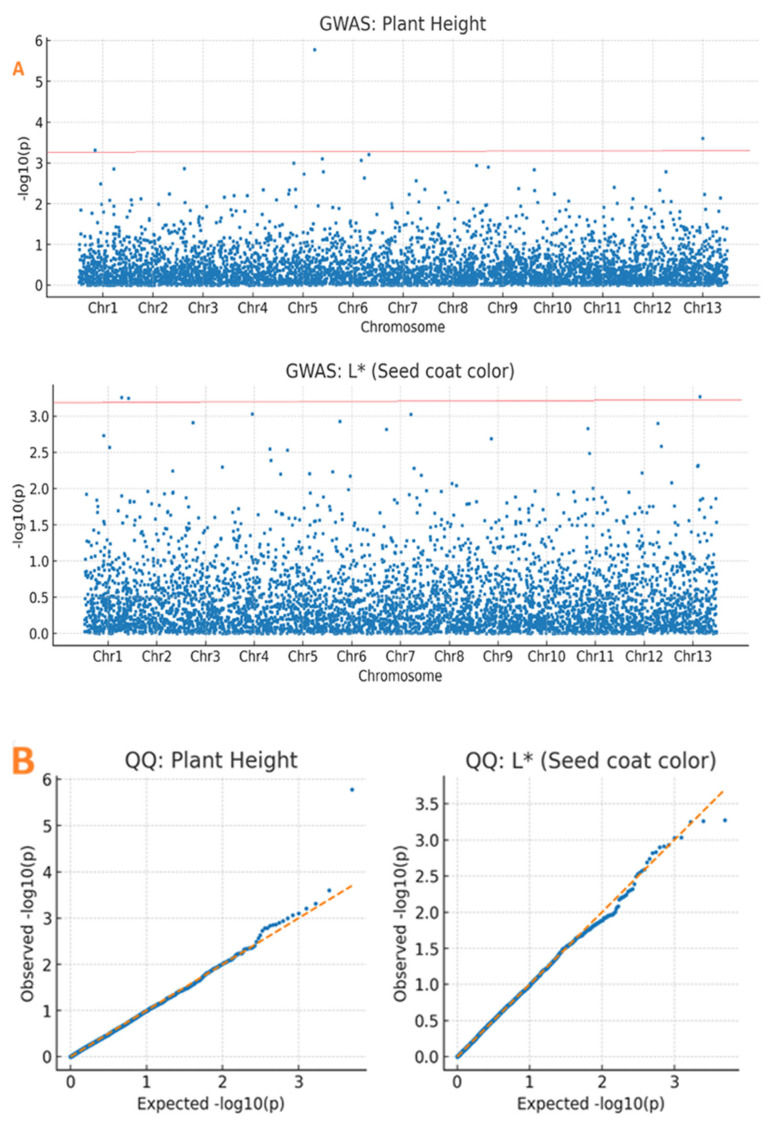 Figure 5
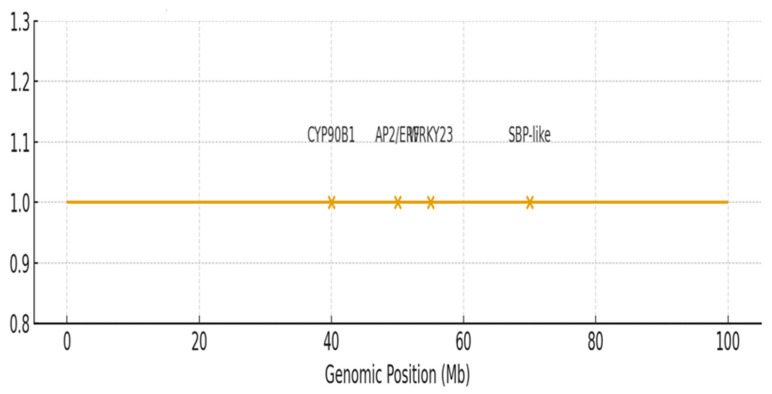 Figure 6
- —Carl Tryggers Stiftelse för Vetenskaplig Forskning
- —Swedish University of Agricultural Sciences
Peer Reviews
No public reviews on file for this paper yet. If you reviewed it on a platform where reviews are public (OpenReview, ICLR, NeurIPS, ICML), you can paste yours below so the community can read it here.
Videos
No videos yet. Explain this paper in a talk, walkthrough, or lecture? Add one.
Taxonomy
TopicsSesame and Sesamin Research · Plant Molecular Biology Research · Peanut Plant Research Studies
1. Introduction
Sesame (Sesamum indicum L.) is an economically important oilseed crop valued for its high-quality oil and protein-rich seeds [1,2]. However, global sesame yields remain low at under 0.8 t ha^−1^ due to limited breeding programs, narrow genetic variation, and slower genomic tool development compared to other major oilseed crops [3,4,5]. Genomic resources are now enabling improvements in productivity and stress tolerance [6,7,8,9].
Genome sequencing facilitated the discovery of quantitative trait loci (QTL) and marker-trait associations for major sesame traits, including oil content, stress tolerance, and oilseed production [10,11,12], mostly using QTL mapping and a genome-wide association study (GWAS) approach [13]. However, the African gene pool, containing considerable genetic variation, is still predominantly unexamined at the genomic level. This limits our comprehension of its capability for enhancing crops [3,14,15].
Ethiopia is a center of diversity and likely the primary center of domestication for sesame [16,17]. Ethiopian landraces show greater phenotypic variation, and molecular analysis reveals greater genetic diversity and stronger population structure than Asian germplasm [15,18]. Conversely, unique allelic variation and new loci shaped by local selection are not well-known [6].
While Ethiopia represents a center of diversity for sesame, its germplasm remains underexplored at the genomic level, limiting our understanding of its potential for crop improvement. Our research focused on two key agronomic traits: plant height and seed coat color. Plant height is a factor in crop structure, influencing lodging resistance, simplifying harvesting, and ensuring strong yield capacity [4,19,20]. Seed coat color has an essential role in crop quality and commercial values related to nutrient composition and stress tolerance due to the responsible biosynthesis of phenolic compounds [21,22,23]. In Ethiopia, white seed coat color is the primary trait preferred by both farmers and export markets, fueling the extensive cultivation of cultivars such as ‘Humera-1′ [24,25]. However, the genetic basis of these traits in Ethiopian germplasm remains poorly characterized, limiting their use in sesame breeding. Despite the availability of significant genomic insights and the identification of numerous QTL and candidate genes in global research [21,26,27,28,29], the significance of and allelic variation in Ethiopian germplasm are still unknown.
Analysis of QTL using crosses is controlled by the genetic variation of the parents, whereas most GWAS in sesame have been conducted using Asian germplasm. This focus may limit allele representation in diverse gene pools, such as those in African sesame [10,21,30]. A combined meta-analysis and GWAS approach could therefore offer a solution to these challenges, providing a comprehensive framework that merges results from multiple investigations while directly evaluating diverse populations [7,8,31].
Accordingly, this research employed a mixed approach involving a genome-wide meta-QTL investigation alongside an extensive GWAS study utilizing a collection of diverse Ethiopian accessions. We aim to dissect the genetic foundations of plant height, a key determinant of lodging resistance and harvestability, and seed coat color, a primary quality trait governing market value and nutritional composition in sesame. Hence, the objectives of this study were to: (1) identify consensus meta-QTL hotspots for PH and SCC through a global analysis; (2) detect single nucleotide polymorphism (SNP)–trait associations and novel alleles within a diverse Ethiopian sesame panel using GWAS; (3) analyze the population structure, kinship, and linkage disequilibrium of Ethiopian germplasm; and (4) propose high-confidence candidate genes and molecular markers for immediate implementation in marker-assisted selection (MAS) programs for sesame improvement.
2. Results
2.1. Consensus Meta-QTL Hotspots
A genomic area was called a “meta-QTL hotspot” if it contained three or more independent QTL from different investigations within a 5 Mb interval. A meta-analysis was conducted using data from eight available sources from QTL mapping, which included 34 QTL for PH and 43 QTL for SCC. When mapped to the reference genome, these QTL coalesced into six genomic regions, i.e., chromosomes 3, 4, 6, 8, 9 and 11. This indicates that these chromosomal intervals contain genetic loci that consistently control these traits across independent QTL mapping research and diverse genetic material, thus highlighting their fundamental importance in sesame biology [26,29,32]. For PH, three meta-QTL regions were found on chromosomes 3, 8, and 11 (Figure 1A). The chromosome 11 area was important, with QTL from four investigations and a combined consensus phenotypic variance explained (PVE) from 10.2% to 25.7%, thereby marking it as a major, stable locus for plant height with strong breeding potential. For SCC, three areas were on chromosomes 4, 6, and 9 (Figure 1B). The area in chromosome 6 was linked to color darkness (low L*) and color intensity (high a and b*), with a QTL that explained 71.4% of the variation in another study [23]. QTL in these regions explained a broad PVE range (5.6–71.4%), reflecting genetic differences and varying study sizes. Genes in these intervals were functionally annotated, revealing candidates in growth- and pigment-related pathways (see Supplementary Table S2). The genes SIACS9 and SICEN2, involved in growth, and members of the polyphenol oxidase (PPO) [33], DIRigent [34], MYB, and bHLH families were annotated in pigment biosynthesis (Table 1). The meta-QTL regions were targets for validation. The meta-QTL regions were subsequently validated through independent GWAS in the Ethiopian panel.
2.2. Phenotypic Variation and Heritability
The Ethiopian panel exhibited substantial phenotypic variation for all measured traits, confirming its suitability for genetic association mapping (Supplementary Table S3). PH ranged from 84.6 to 169.2 cm (mean 126.4 ± 18.7 cm), from lodging-resistant types to high-biomass types. SCC also had wide ranges, i.e., L* values from 19.8 (very dark) to 59.4 (light cream); a* values from -2.3 (slight green) to +9.1 (red/brown); and b* values from 3.1 to 18.8. L* values were skewed toward lighter seeds.
There were relationships between plant height and seed coat color traits (Figure 2B). The seed coat color trait L* was negatively correlated with a* (r = −0.41, p < 0.001) and b* (r = −0.38, p < 0.001), indicating that darker seeds tend to have higher red and yellow components. A negative correlation existed between PH and L* (r = −0.21, p < 0.01), suggesting that taller plants tend to have darker seeds, possibly reflecting linked genetic regulation of growth and pigment accumulation.
The principal component (PC) analysis revealed that the first two PCs accounted for 67.4% of the variance (PC1: 33.9%, and PC2: 33.5%). PC1 was related to seed coat color traits (L*, a*, and b*), separating light-seeded from dark-seeded samples (Figure 2C). Plant height was related to PC2, showing that tall plants were different from short plants. The accessions were in the range of variation, confirming that they show the panel’s diversity.
Broad-sense heritability was high for both traits: 0.89 for plant height and >0.95 for L*, a*, and b* values, indicating strong genetic control. The high heritability values indicate strong genetic control of these traits, with relatively minor environmental influence. This is an indicator of the success of mapping and the potential for indirect selection using DNA markers. The wide phenotypic range supports the potential for selecting extreme genotypes for breeding programs targeting specific plant architectures or seed color profiles.
2.3. Population Structure, Kinship and Linkage Disequilibrium
Population structure analysis of the 3683 SNPs revealed two genetic groups (K = 2) in the Ethiopian panel (Figure 3A). Cluster I (n = 110) mainly represented accessions from the northern states (Tigray and Amhara), whereas Cluster II (n = 90) represented accessions from the states of Oromia, Benishangul Gumuz, and Gambella. Kinship analysis confirmed this grouping (Figure 3B). Genome-wide LD decayed rapidly, reaching half of its maximum value at ~190 kb (Figure 3C), reflecting high genetic diversity and allowing fine mapping. The detected distance of LD decay at ~190 kb agrees well with previous research characterizing diverse landrace panels in sesame and other outcrossing species of comparable complexity. For example, Wei et al. [33] reported LD decays in Asian varieties of sesame at ~370 kb. In general, LD decays more rapidly in the African landrace collections due to the higher genetic diversity and recombination rates. In the GWAS of diverse germplasm, an LD decay distance of 100–500 kb is common, thus enabling fine-mapping of trait-associated regions without excessive marker density.
2.4. Genome-Wide Association Study
A genome-wide association identified 36 significant marker–trait associations across the sesame genome (Supplementary Table S5). For plant height, 15 SNPs were on chromosomes 1, 3, 5, 8, and 11. The most significant SNP was Chr11_1877114 (p = 1.24 × 10^−6^), explaining 14.20% of phenotypic variance. The strongest association for PH was for SNP Chr11_1877114 (p = 1.24 × 10^−6^, −log_10_(p) = 5.91), explaining 14.2% PVE, which overlapped and agreed with recent meta-QTL analysis [11,32]. Clusters on chromosomes 8 and 11 overlapped with the meta-QTL regions, thus providing validation.
For seed coat color, 21 SNPs were identified as being linked to the parameters. Lightness (L*) was under the control of 7 SNPs on chromosomes 3, 6, and 13. Red-green (a*) was linked to 8 SNPs on chromosomes 6, 9, and 12. Yellow-blue was linked to 6 SNPs on chromosomes 3, 6, and 9. The top associated SNPs included Chr12_16523829 for lightness (L*; p = 2.17 × 10^−3^, PVE = 6.32%), Chr06_27694080 for redness (a*; p = 7.84 × 10^−7^, PVE = 8.95%), and Chr13_345249 for yellowness (b*; p = 1.48 × 10^−3^, PVE = 6.08%) (Table 2). While many color loci coincided with known meta-QTL regions, novel associations were detected on chromosomes 12 and 13 (Table 2, Figure 4). This indicates the presence of unique alleles in the Ethiopian gene pool absent from Asian-centric research. Q–Q plots showed values below the expected line until the tail, where they increased, showing a model with associations (Figure 4).
2.5. Comparative Genomic Analysis
Using the dataset by Wang et al. [37] and Wei et al. [33], we compared our GWAS loci in Ethiopian germplasm with the global genomic signatures. The genomic region containing the top plant height SNP (Chr11_1877114) exhibited higher FST (>0.15) between the African and Asian groups in the global analysis, indicating strong population differentiation and potential local adaptation. The major seed coat color locus on chromosome 6 (Chr06_27694080) coincided with the reported QTL qBSCchr6 identified in other research [11,32]. Novel associations on chromosomes 12 and 13 for seed coat color were located in genomic regions with significantly higher nucleotide diversity in African accessions compared to Asian ones (π_AFR/π_ASIA > 2.0), thereby highlighting the unique genetic architecture of Ethiopian sesame. Higher nucleotide diversity in African accessions suggests a broader allelic repertoire for breeding programs aiming to enhance genetic gain and adaptation.
2.6. Prioritization of Highly-Priority Candidate Genes
Candidate genes were prioritized based on functional annotation, known roles in related pathways, and, where available, expression data from sesame seed and tissue-specific transcriptomes (e.g., Sinbase 2.0) [38]. Genes with homology to known regulators of plant height, hormone signaling, or flavonoid biosynthesis were given higher priority. In silico variant analysis of the resequencing data revealed non-synonymous SNPs within the coding sequences (CDSs) of candidate genes CYP90B1 (Chr08) and WRKY23 (Chr06) that co-segregated with phenotypic extremes. Promoter-region polymorphisms were also identified for AP2/ERF (Chr11) and DOF3.1 (Chr03). Details of these variants are provided in Supplementary Table S7. Candidate gene analysis prioritized seven genes within ±190 kb of significant SNPs (Table 3, Figure 5). An expanded list of annotated candidate genes is provided in Supplementary Table S6. For plant height, the SNP clusters Sindi.11G025000 (AP2/ERF domain protein; 95.2% identity) on chromosome 11 and Sindi.08G015600 (CYP90B1; 88.7% identity) on chromosome 8 were identified. AP2/ERF transcription factors are regulators of ethylene-responsive genes and control cell expansion [39]. CYP90B1 (DWF4) is a cytochrome P450 that controls brassinosteroid biosynthesis, and changes in this gene cause dwarfism [40].
For seed coat color (SCC), key candidate genes were identified near associated SNPs: Sindi.12G045200 (SBP-like; 97.8% identity) linked to L, Sindi.06G123400 (WRKY23; 94.3% identity) and Sindi.03G078100 (DOF3.1; 82.1% identity) associated with a, and Sindi.09G078500 (salicylic acid-binding protein 2; 96.7% identity) linked to b* (Table 3). WRKY23 is a transcription factor known to activate anthocyanin biosynthesis genes under stress conditions [41]. The DOF3.1 transcription factor is a DNA-binding protein involved in light-regulated gene expression and pigment accumulation in plants [42]. SBP-like transcription factors, such as Sindi.12G045200, regulate genes involved in pigmentation pathways [22]. These findings indicate that plant height is influenced by hormonal pathways, including brassinosteroid via CYP90B1 and ethylene via AP2/ERF, while seed coat color is governed by transcription factors such as WRKY, DOF, and SBP-like, which modulate flavonoid biosynthesis.
3. Discussion
3.1. Validation of Genomic Regions and Discovery of New Alleles
By integrating meta-QTL analysis with field phenotyping and publicly available resequencing data, we validated conserved genomic regions and identified novel variants within the Ethiopian sesame population.
The meta-QTL hotspots on chromosomes 8 and 11, identified for plant height, have been confirmed by the presence of significant SNPs within germplasm from Ethiopia (Chr08_1771424, Chr11_1877114), with stable effects across environments [29,32,41]. The meta-QTL hotspot on chromosome 11 has a high FST score for comparisons between Africa and Asia [9,13,27,32,36,43], thereby indicating adaptation within the Ethiopian germplasm.
The meta-QTL hotspot on chromosome 6 for a*, which is associated with seed coat color in Asian germplasm [11,23], was also detected in the Sudanese [27] and in our panel (Chr06_27694080, PVE = 8.95%), thus confirming its conserved role across diverse populations.
Notably, the GWAS revealed novel trait-associated loci on chromosomes 12 and 13 that were absent in previous Asian-centric research. These regions show higher nucleotide diversity in African accessions [13,23,26,41], indicating that Ethiopian sesame harbors unique allelic variation shaped by local adaptation [6,10,15,18]. Including African diversity is therefore essential for capturing the full genetic potential of sesame [12,14,44] for breeding.
3.2. Hormonal Regulation of Plant Architecture
Candidate gene analysis identifies hormonal mechanisms likely regulating plant height. The brassinosteroid biosynthesis gene CYP90B1 and ethylene-responsive gene AP2/ERF are co-located within plant-height-related regions, suggesting a potential coordinated mechanism for stem-growth regulation. CYP90B1 gene variations result in dwarfing in various plant species [40,45], whereas AP2/ERF proteins mediate ethylene signaling to growth, although in a different manner [20,34,39]. The brassinosteroid and ethylene interactions result in plant height regulation in Arabidopsis thaliana and rice [46,47], which is probably analogous to sesame. Brassinosteroid and ethylene signaling pathways often interact synergistically to modulate cell expansion and division, ultimately influencing plant height in model species, a mechanism that may be conserved in sesame. Marker-aided crop improvement via gene modification may result in short, lodging-resistant crop cultivars that are amenable to mechanical harvest systems [2,4,28,48].
3.3. Transcriptional Networks Behind Seed Coat Color
Seed coat color in sesame is regulated by transcription factors that control the phenylpropanoid/flavonoid biosynthesis pathway. GO and KEGG enrichment analyses of candidate genes support these pathways (Supplementary Table S9). Our results are consistent with previous findings (Table 4). The major QTL clusters on chromosomes 4, 6, and 9 have been consistently documented [21,23,26,29], with a marker linked to the gene (qBSCchr6) on chromosome 6, described as a major locus of brown seed coat color [11,49]. GWAS revealed the importance of WRKY23, DOF3.1, and SBP-like transcription factors. The WRKY transcription factor regulates anthocyanin gene expression in a stressed environment [20,41], while DOF regulates gene expression in a light environment [42]. Elsafy et al. [27] also revealed WRKY and DOF transcription factors in the seed coat color transcriptional network. A higher heritability (H^2^ > 0.95) of the L*, a*, and b* indices in the Ethiopian materials shows that these qualities are genetically fixed to a great extent and are less likely to be affected by environmental factors [27]. A negative correlation between L* and a* (r = −0.41) implies that lighter seeds have lower red/green pigmentation, which may reflect reduced phenolic and anthocyanin content [21].
3.4. Population Structure and LD Decay
The population structure analysis revealed two genetic clusters (K = 2), reflecting geographical and agroecological regions [12,15,27]. Geographical variation in phenotypic traits across regions is detailed in Supplementary Table S10. The rate of LD decay revealed high recombination rates and genetic diversity for Ethiopian (~190 kb) and Sudanese (~0.240 Mb) germplasm [27], which is consistent with the high genetic base of African landraces when compared to some Asian (~370 kb) germplasms [19]. The rapid LD decay (~190 kb) in Ethiopian germplasm contrasted with longer decay distances in Asian varieties (~370 kb), reflecting higher genetic diversity and recombination rates in African landraces. The use of kinship and population structure covariates in the FarmCPU approach minimized false positives, which is evident from the proper calibration of the Q–Q plots [50,51].
3.5. From Discovery to Application: A Molecular Toolkit for Sesame Breeding
The integration of meta-QTL, trait-associated SNPs, and functionally annotated candidate genes is useful for sesame breeding. Our study is the first to integrate the meta-QTL and GWAS framework applied to unlock the genetic potential of Ethiopian sesame germplasm. We demonstrate that this underutilized gene pool contains not only alleles for known major loci but also novel, population-specific genetic variation crucial for adaptation. This study provides validated molecular markers and candidate genes that constitute a practical toolkit for marker-assisted sesame breeding. The validated meta-QTL intervals can offer priority regions for introgression and background selection. This study provides a validated molecular toolkit for sesame improvement, including SNPs with moderate-to-high PVE (e.g., Chr11_1877114 with 14.20% for plant height and Chr06_27694080 with 8.95% for color) and candidate genes with high sequence conservation (e.g., CYP90B1 at 88.7% and SBP-like at 97.8% identity). These markers and genes enable targeted selection and potential gene editing to optimize plant architecture and seed coat traits in Ethiopian and other sesame germplasm.
Given the high heritability and significant effects of SNPs, genomic selection models incorporating these markers (3683 SNPs) could achieve a genome-wide prediction accuracy of >0.7 for both plant height and seed coat color [31,52,53]. For immediate application, breeders can use the identified SNPs to pyramid favorable alleles for optimal plant height and desirable seed coat color (e.g., high L* for white-seeded types) in elite backgrounds. Functional validation of the identified candidate genes and favorable alleles will further facilitate sesame breeding.
3.6. Limitations and Future Directions
It is known that landrace accessions generally exhibit a high degree of genetic diversity within each accession, and this diversity can pose a challenge when characterizing phenotypes and genotypes. Here, we addressed the challenge by the single-seed descent (SSD) method for two generations in each landrace accession, thereby obtaining homogeneous lines. We therefore measured phenotypes and genotyping of the SNPs of individuals that have largely homozygous genetic backgrounds, which leads to higher mapping precision and less noise from intra-accession heterogeneity. However, some heterogeneity may still be present, and subsequent investigations can take advantage of deep sequencing or haplotype-based methods to reveal landrace diversity. Our meta-QTL analysis combined data from research that used different types of populations for genetic mapping, different marker systems, and different genetic maps.
We aligned all the positions to a physical reference to have a common ground, but differences in population size, marker density, and QTL detection power remain in different investigations and may affect the stability of consensus intervals. In addition, differences in the resolution of mapping and thresholds for detection that arise from the use of both biparental QTL and GWAS data without limitations cannot be eliminated, even if the data have been handled carefully. By setting stringent hotspot criteria (3 independent QTL within 5 Mb) and performing functional validation through independent GWAS in Ethiopian germplasm, these limitations have been partially counterbalanced. The rapid LD decay (~190 kb) in our panel, while advantageous for fine-mapping, combined with our moderate SNP density (3683 genome-wide SNPs, providing ~340 kb average spacing), means that our candidate gene search windows of ±190 kb represent a practical balance between discovery power and mapping resolution in this diverse germplasm. Future research employing higher-density genotyping would enable finer resolution to pinpoint causal variants within the identified intervals.
4. Materials and Methods
4.1. Global Meta-QTL Analysis
A systematic meta-analysis was conducted to identify consensus genomic regions for plant height (PH) and seed coat color (SCC) in sesame. The following protocol was implemented to ensure transparency, reproducibility, and comparability across research undertakings. A comprehensive literature search was conducted for all published QTL mapping and GWAS on PH and SCC in sesame until January 2025. Search keywords included “sesame QTL”, “Sesamum indicum plant height”, “seed coat color QTL”, and “sesame genome-wide association”. From an initial pool of over 85 publications, 28 investigations met the initial screening criteria of reporting primary QTL or marker–trait association data. After rigorous evaluation for completeness and comparability, eight investigations were selected for the final meta-analysis. The inclusion criteria were a peer-reviewed publication with primary QTL or GWAS data; clearly defined trait measurements for PH or SCC; reported chromosomal positions, genetic/physical map intervals, logarithm of odds (LOD) scores, and phenotypic variance explained (PVE); and availability of marker sequences or alignment information to allow mapping to a common reference genome. The eight investigations included in the meta-analysis were referenced [11,21,23,26,29,36,41,43]. A summary of excluded investigations with the criteria is provided in Supplementary Table S8. Data extraction and synthesis followed standard meta-analytic principles to mitigate bias. A summary of these investigations, including mapping method, population type, size, genetic map used, and marker system, is provided in Supplementary Table S1. Supplementary Table S1 provides a comprehensive summary of each study, including mapping method, population type and size, genetic map used, marker system, reported QTL intervals, logarithm of odds (LOD) scores, and phenotypic variance explained (PVE).
Data on QTL included the trait name, QTL linkage group [31], markers, genetic position (cM), LOD score, and PVE. All the genetic positions were converted to the physical coordinates of the reference sesame genome using Sinbase version 2.0 (http://www.sesame-bioinfo.org/Sinbase2.0, accessed on 2 December 2025) [38] based on the sequence information of the markers. The meta-analysis was carried out using BioMercator v3.0 [54]. For each trait, QTL was gathered based on physical positions. Meta-QTL was found through a two-step process: (1) choosing the number of meta-QTL on each chromosome using model choice criteria (AIC, AICc, BIC), and (2) finding the consensus position and confidence interval for each meta-QTL. A genomic area was called a “meta-QTL hotspot” if it had three or more independent QTL from different investigations in a 5 Mb area. Candidate genes within these hotspot intervals were retrieved from the S. indicum genome annotation [38] and functionally annotated.
4.2. Plant Materials and Field Experimental Design
A total of 200 sesame samples were obtained from the Ethiopian Biodiversity Institute gene bank in Addis Ababa. The samples consisted mainly of landraces from five regional states in Ethiopia, which are major sesame production regions: Tigray (n = 56), Amhara (n = 50), Oromia (n = 44), Benishangul Gumuz (n = 32), and Gambella (n = 18). Three released cultivars, ‘Adi’, ‘Humera-1′, and ‘Kelafo-74′, were included as checks to evaluate performance and environmental effects. Kelafo-74 is a semi-dwarf, late-maturing, medium-yielding sesame with black seeds. ‘Adi’ is a tall, early-maturing, high-yielding sesame with white seeds, and ‘Humera-1′ is a medium-height, early-maturing, high-yielding sesame with white seeds and high oil content. To address the genetic heterogeneity typical of landraces, each accession was purified through two generations of single-seed descent (SSD) before field trials. This process ensured that each accession was represented by a genetically uniform line, minimizing within-accession variance and enhancing the accuracy of both phenotyping and genotyping. Bulk seed from the SSD-derived lines was used for field experiments and DNA extraction.
Field experiments were conducted over two growing seasons in 2024 and 2025 at the Werer Agricultural Research Center (WARC), Afar Region, Ethiopia (9°36′ N, 40°05′ E, 570 m above sea level). The location is characterized by semi-arid conditions, with an annual rainfall of 650 mm, silt loam soil containing 1.2% organic carbon, and a pH of 7.8. An augmented block design with eight blocks was used. All 200 test samples and three check cultivars were allocated to every block. The plot contained four 4 m rows with 30 cm spacing between rows and 10 cm between plants, with a total plot size of 3.6 m^2^. Standard practices were followed, including irrigation, weeding, fertilizer, and pest management.
4.3. Phenotyping
Phenotyping was carried out at maturity. Plant height was included as one of the target traits because it is a key determinant of plant architecture and lodging resistance and is related to agronomic performance and yield potential. Plant height (PH) was measured in centimeters from the soil to the top of the main stem. Ten plants per plot were measured in centimeters, and the sample’s mean PH was recorded. Seed coat color (SCC) was evaluated because it is an important quality and market trait with clear phenotypic contrast among sesame cultivars, making it highly informative for genetic analysis. Seed coat color was measured using a Konica Minolta CR-400 Chroma Meter (Konica Minolta Sensing, Inc., Osaka, Japan). Color measurement had three samples of 50 g of seeds. Before each session, the chroma meter was calibrated using a standard white calibration tile (L* = 93.7, a* = 0.3160, b* = 0.3323). Color was recorded in the CIELAB color space, defined by three parameters: lightness (L*, 0 = black to 100 = white), green–red axis (a*; negative values are green, positive values are red), and blue–yellow axis (b*; negative values are blue, positive values are yellow). Three technical replicates per accession and parameter (L*, a*, and b*) were averaged and used in subsequent analysis. The coefficient of variation between values was <1%, meaning the measurement was precise.
4.4. SNP Data Processing
Whole-genome resequencing data for the 200 Ethiopian accessions were obtained from publicly available whole-genome resequencing data from BioProject PRJNA626474, which includes 705 global sesame accessions [37]. Our panel represents a subset of these accessions, specifically those of Ethiopian origin. Raw sequencing reads were aligned to the S. indicum v3.0 reference genome using BWA-MEM v0.7.17. Variant calling was performed using GATK v4.2 following best practices for germline short variant discovery. Given the SSD-derived nature of the lines, within-accession heterogeneity was minimal; however, to ensure accuracy, genotype calling was performed using a pooled allele frequency threshold above 0.8 for homozygous calls. Genotype data in VCF format were filtered using PLINK v1.9 and VCFtools with the following criteria: minor allele frequency (MAF) above or equal to 0.03; individual genotype missing rate below 20%; SNP call rate above or equal to 80%; Hardy–Weinberg equilibrium p-value above 1 × 10^−6^; and removal of indels and multi-allelic sites. SNPs with a minor allele frequency (MAF) below 0.03 were excluded to remove rare variants that could produce spurious associations. After filtering, 3683 high-confidence biallelic SNPs were retained for downstream population genomic and GWAS analyses. A summary of significant SNPs is provided in Supplementary Table S4.
4.5. Comparative Genomic Analysis
Given the limited availability of publicly deposited raw variant data specifically for African sesame germplasm, we performed comparative analysis by referencing published findings and summary statistics from major sesame genomics research. We focused on data from Wang et al. [37], who re-sequenced 705 global sesame accessions, including 62 from Ethiopia, data available under BioProject PRJNA626474. A summary of key public genomic resources used and referenced in this study is provided in Supplementary Table S1. From their published Supplementary Materials and results, we extracted published summary statistics including allele frequencies, population differentiation (FST), and nucleotide diversity (π) for genomic regions corresponding to our GWAS hits. This approach allowed us to contextualize our Ethiopian-specific accessions within global sesame diversity without requiring the reprocessing of raw sequencing data.
4.6. Population Structure, Kinship and Linkage Disequilibrium Analysis
Population structure analysis was carried out using the algorithm in ADMIXTURE v1.3.0 [55]. Runs were carried out for values of K ranging between 1 and 10, using cross-validation with 10 folds for each K [56]. K with the lowest cross-validation error was selected. Ancestry proportions as estimated by the Q-matrix output from K = 2 were incorporated as covariates in the GWAS model to account for population stratification. The K-matrix was calculated to model genetic relatedness among individuals. The K-matrix was generated using the identity-by-state (IBS) algorithm in TASSEL v5.2 [57]. Genome-wide linkage disequilibrium (LD) was found using PLINK to measure the correlation (r^2^) between all pairs of SNPs in a 1 Mb window. r^2^ values were plotted against the distance in kilobases between SNP pairs. The distance at which the smoothed curve, fitted with a LOESS regression, dropped to half its maximum value was taken as the LD decay distance and used to define the candidate gene search window around significant SNPs.
4.7. Genome-Wide Association Analysis
GWAS analysis between the 3683 SNPs and the traits (PH, L*, a*, and b*) was conducted using the Fixed and Random Model Circulating Probability Unification (FarmCPU) method [50], in the GAPIT3 R package v3.1.0 [51]. FarmCPU uses a Fixed-Effect Model (FEM) to test SNPs for association and a Random-Effect Model [6,10] to control the background, reducing false positives. Population structure and kinship matrix were used. Marker–trait associations were significant at a level decided by Bonferroni correction at α = 0.05, or −log_10_ ≥ 3.4 ((p ≤ 4.0 × 10^−4^) [10], however, strict Bonferroni correction at α = 0.05, or −log_10_ ≥ 4.86 was also reported in another study by Andargie et al. [2]. Manhattan plots and quantile–quantile (Q–Q) plots were drawn to show the GWAS results and measure model fit.
4.8. Candidate Gene Identification and In Silico Functional Annotation
For each SNP, a candidate genomic area was defined as the region ± the LD decay distance (~190 kb). All annotated genes in these areas were taken from the S. indicum v3.0 GFF3 file. Protein sequences were taken and studied using BLASTP 2.17.0 searches against the NCBI non-redundant (nr) protein database (E-value cutoff < 1 × 10^−5^). Protein domain structure was studied using InterProScan v5.52-86.0 [58]. Candidate genes were chosen based on known functions, mostly genes in plant hormone production/signaling (e.g., PH) and phenylpropanoid/flavonoid production (e.g., SCC).
4.9. Phenotypic Data Analysis
For both traits, the mean, range, standard deviation, and coefficient of variation were calculated. Pearson’s correlation coefficients between traits were also estimated. Principal component analysis (PCA) was conducted in R on the trait matrix (PH, L*, a*, and b*) using the prcomp function. The FactoMineR and factoextra packages were used for PCA visualization. Broad-sense heritability (H^2^) for each trait across the seasons was measured using variance components from a linear mixed model:
where is the genotypic variance, is the genotype-by-environment interaction variance, is the residual error variance, e is the number of environments (seasons), and r is the number of replicates per environment. For test entries, replication was derived from the research design, and variance components were measured using the lme4 package in R.
5. Conclusions
This study demonstrates the power of combining global meta-analysis with population-specific GWAS to dissect the genetic architecture of complex traits within underutilized germplasm. We identified and validated six conserved meta-QTL hotspots for plant height and seed coat color, pinning the stability of those genomic regions across diverse sesame populations. More importantly, our GWAS on Ethiopian landraces identified novel trait-associated loci on chromosomes 12 and 13, thus revealing some unique allelic variation from the African gene pool, which was missed in previous Asian-centric research. The high-priority candidate genes identified include CYP90B1 and AP2/ERF for plant architecture and WRKY23, DOF3.1, and SBP-like genes related to pigmentation, which provide functional targets for further validation. The rapid LD decay (~190 kb) and clear population structure (K = 2) of the Ethiopian panel facilitate fine-mapping and allele mining. Collectively, this work provides a validated molecular toolkit comprising meta-QTL intervals, trait-associated SNPs, and candidate genes that can be immediately deployed in marker-assisted selection programs to accelerate the improvement of sesame, particularly by introgressing favorable alleles from Ethiopian germplasm into elite breeding lines.
The reference list from the paper itself. Each links out to its DOI / PubMed record.
- 1Wei W. Zhang Y. LüH. Li D. Wang L. Zhang X. Association Analysis for Quality Traits in a Diverse Panel of Chinese Sesame (Sesamum indicum L.) Germplasm J. Integr. Plant Biol.20135574575810.1111/jipb.1204923570323 · doi ↗ · pubmed ↗
- 2Andargie M. Vinas M. Rathgeb A. Möller E. Karlovsky P. Lignans of Sesame (Sesamum indicum L.): A Comprehensive Review Molecules 20212688310.3390/molecules 2604088333562414 PMC 7914952 · doi ↗ · pubmed ↗
- 3Dossa K. Diouf D. Wang L. Wei X. Zhang Y. Niang M. Fonceka D. Yu J. Mmadi M.A. Yehouessi L.W. The Emerging Oilseed Crop Sesamum indicum Enters the “Omics” Era Front. Plant Sci.20178115410.3389/fpls.2017.0115428713412 PMC 5492763 · doi ↗ · pubmed ↗
- 4Rauf S. Basharat T. Gebeyehu A. Elsafy M. Rahmatov M. Ortiz R. Kaya Y. Sesame, an Underutilized Oilseed Crop: Breeding Achievements and Future Challenges Plants 202413266210.3390/plants 1318266239339635 PMC 11434663 · doi ↗ · pubmed ↗
- 5FAOSTAT World Food and Agriculture—Statistical Yearbook 20242024 Available online: https://www.fao.org/faostat/(accessed on 21 September 2025)
- 6Tesfaye T. Tesfaye K. Keneni G. Alemu T. Alemu A. Genome-Wide Association Study for Yield-Related Traits in Sesame (Sesamum Indicum)Plant Breed.202214124625610.1111/pbr.13004 · doi ↗
- 7Varshney R.K. Bohra A. Yu J. Graner A. Zhang Q. Sorrells M.E. Designing Future Crops: Genomics-Assisted Breeding Comes of Age Trends Plant Sci.20212663164910.1016/j.tplants.2021.03.01033893045 · doi ↗ · pubmed ↗
- 8Varshney R.K. Graner A. Sorrells M.E. Genomics-Assisted Breeding for Crop Improvement Trends Plant Sci.20051062163010.1016/j.tplants.2005.10.00416290213 · doi ↗ · pubmed ↗