Normalization Challenges Across Adipocyte Differentiation and Lipid-Modulating Treatments: Identifying Reliable Housekeeping Genes
Zhenya Ivanova, Valeria Petrova, Toncho Penev, Natalia Grigorova

TL;DR
This paper identifies the most reliable reference genes for normalizing RT-qPCR data in adipocyte studies involving differentiation and lipid treatments.
Contribution
The study introduces a reliable normalization panel of housekeeping genes (Ppia, 36b4, B2M) for adipocyte research.
Findings
Commonly used reference genes like Gapdh and Actb show high variability in adipocyte differentiation and lipid treatments.
Ppia, 36b4, and B2M consistently display low variability across multiple analytical methods.
A combination of algorithmic and statistical methods is recommended for reliable normalization in complex adipocyte models.
Abstract
Accurate normalization of RT-qPCR data requires selecting stable internal control genes, particularly in models characterized by dynamic metabolic transitions, such as 3T3-L1 adipocytes. The current study compares the expression stability of nine widely used housekeeping genes (HKGs) (peptidylprolyl isomerase A (Ppia), glyceraldehyde-3-phosphate dehydrogenase (Gapdh), beta-2 microglobulin (B2M), ribosomal protein, large, P0 (36b4), hydroxymethylbilane synthase (Hmbs), hypoxanthine guanine phosphoribosyl transferase (Hprt), tyrosine 3-monooxygenase/tryptophan 5-monooxygenase activation protein, zeta polypeptide (Ywhaz), 18S ribosomal RNA (18S), and β-actin (Actb)) across key stages of differentiation (days 0, 9, and 18) and under treatments with palmitic acid and docosahexaenoic acid. Stability was assessed using four classical algorithms—geNorm, NormFinder, BestKeeper, and…
Genes, proteins, chemicals, diseases, species, mutations and cell lines named across the full text — each resolved to its canonical identifier and authoritative record.
Click any figure to enlarge with its caption.
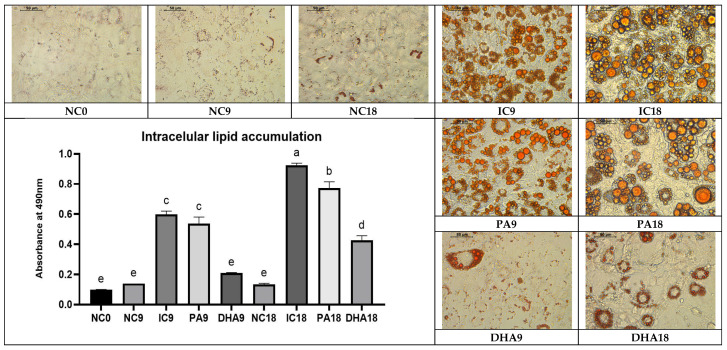 Figure 1
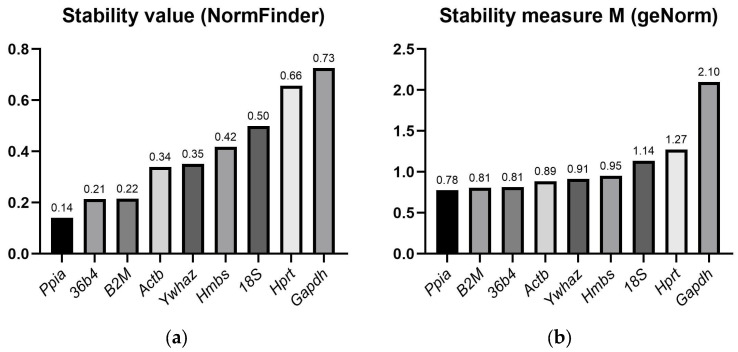 Figure 2
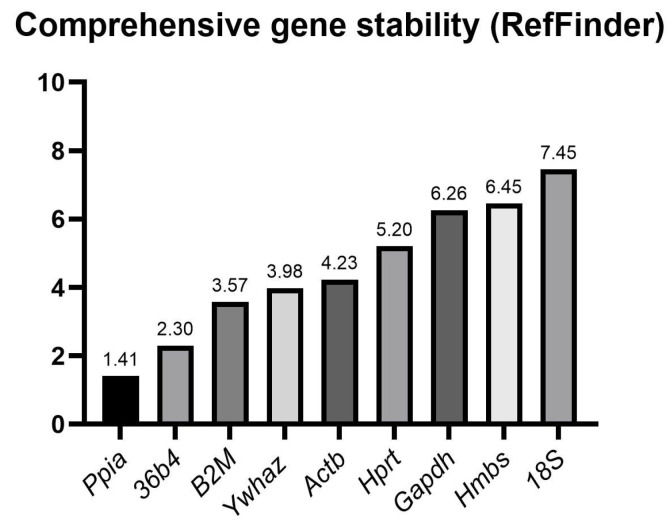 Figure 3
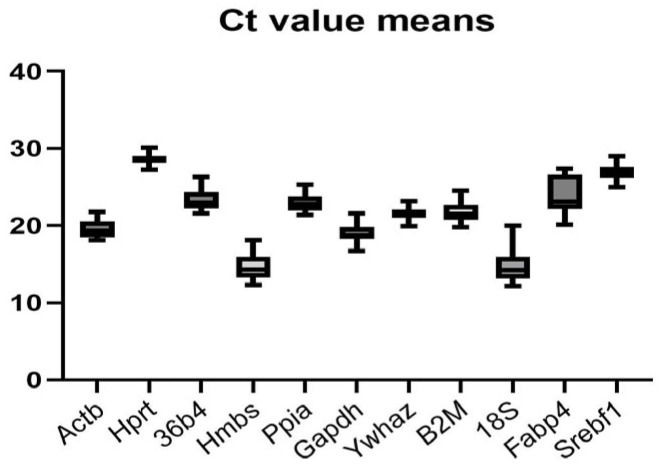 Figure 4
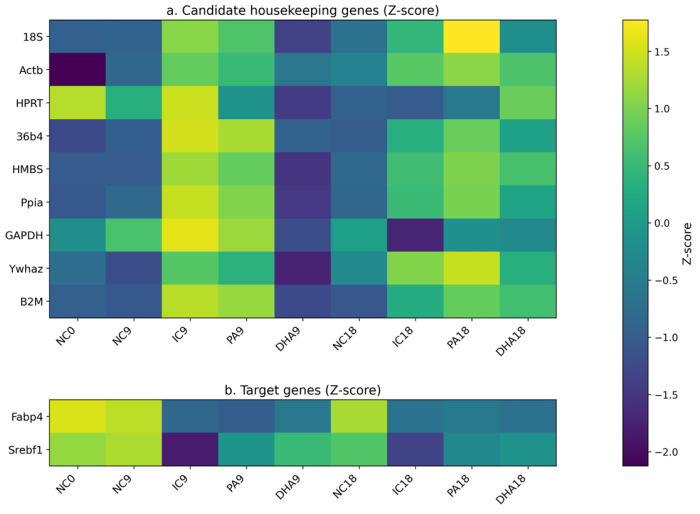 Figure 5
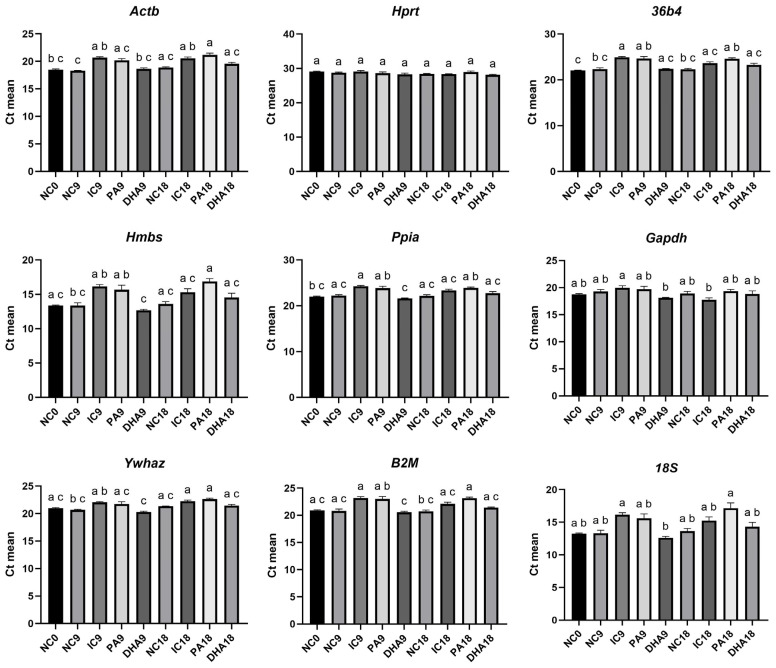 Figure 6
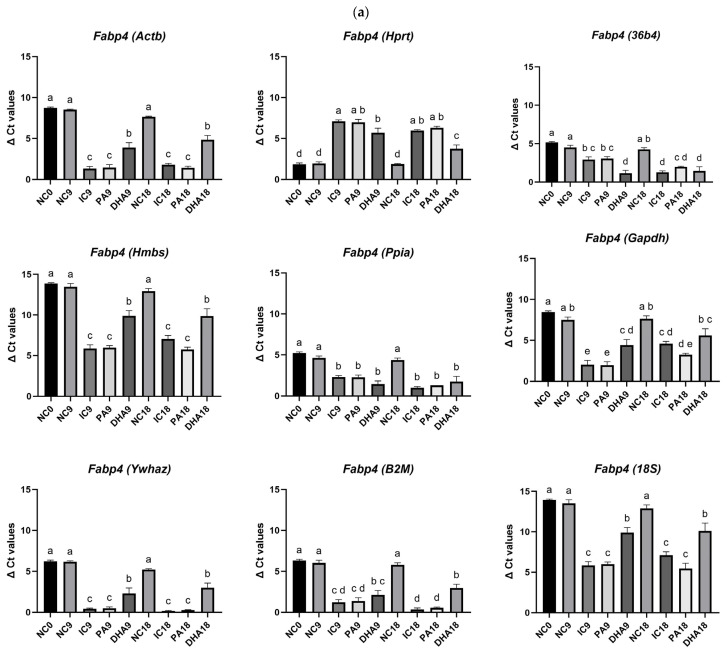 Figure 7
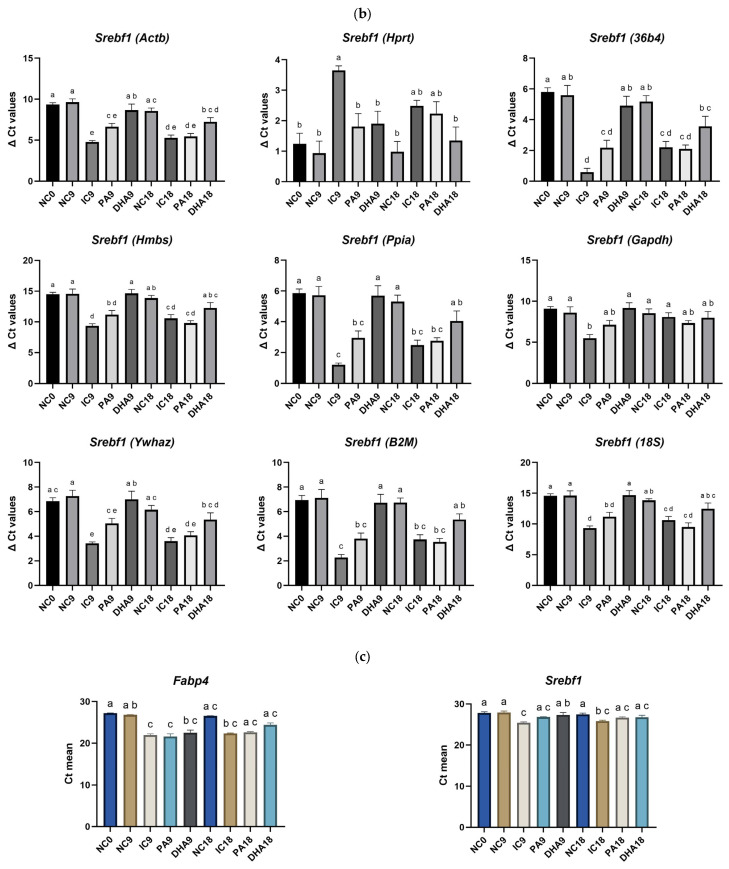 Figure 8
- —Faculty of Veterinary Medicine, Trakia University, Stara Zagora, Bulgaria
- —Bulgarian Ministry of Education and Science (MES)
Peer Reviews
No public reviews on file for this paper yet. If you reviewed it on a platform where reviews are public (OpenReview, ICLR, NeurIPS, ICML), you can paste yours below so the community can read it here.
Videos
No videos yet. Explain this paper in a talk, walkthrough, or lecture? Add one.
Taxonomy
TopicsMolecular Biology Techniques and Applications · Adipokines, Inflammation, and Metabolic Diseases · Adipose Tissue and Metabolism
1. Introduction
Obesity and obesity-provoked metabolic disorders, such as dyslipidemia, insulin resistance, type 2 diabetes, and hepatic steatosis, represent some of the most critical and extensively researched health challenges [1,2,3,4]. Over a third of the world’s population is overweight or obese, and unfortunately, there is a clear, alarming trend of expansion across all age groups. In general, these conditions represent a complex interaction between genetic, epigenetic, hormonal, and environmental factors that disrupt the body’s energy balance. However, an increasingly stressful and sedentary lifestyle triggers similar conditions even in individuals who are not prone to them [5,6]. Although this topic has been explored for decades, recent years have seen a steady rise in studies focused on clarifying the detailed mechanisms of adipogenesis [7,8] and examining how various drugs, nutritional supplements, and bioactive molecules influence the metabolic regulation of adipocytes [9,10,11]. The 3T3-L1 cell line has become a classic model for studying cell differentiation and lipid accumulation. It is widely used in functional research related to obesity, insulin resistance, and lipid homeostasis [12,13,14,15,16]. This model offers the opportunity to precisely track the morphological, biochemical, and molecular changes associated with adipogenesis, as well as to assess the effects of various pharmacological agents, nutrients, and biologically active molecules on the metabolic activity of adipocytes [17,18,19]. Its reproducible experimental conditions have made the 3T3-L1 cell line a key tool in modern in vitro investigations of fat biology and metabolic homeostasis [12,20]. However, the dynamic changes occurring during differentiation introduce specific methodological challenges for molecular analyses, particularly for techniques such as reverse transcription quantitative polymerase chain reaction (RT-qPCR), where data interpretation is highly sensitive to experimental variability [9,14].
RT-qPCR, one of the most widely used molecular methods for gene expression analysis, enables precise quantification of gene expression but requires highly reliable normalization to ensure the accuracy and comparability of results. In this respect, selecting suitable housekeeping genes (HKGs) that remain consistently expressed across various experimental conditions is a crucial step for obtaining reliable results [14,21,22]. During adipogenesis, cells undergo dramatic shifts in metabolic activity, morphology, cytoskeletal organization, and overall gene expression. As a result, there is considerable variability in the expression of traditionally used HKGs, such as glyceraldehyde-3-phosphate dehydrogenase (Gapdh) and β-actin (Actb), as their levels are highly dependent on lipogenic level, cytoskeletal remodeling, and overall energy metabolism [22,23,24,25]. If we add strong antiadipogenic and lipid-modulating agents to this already complex scenario, the stability of many conventional reference genes may be further compromised. Moreover, in precise data analysis, it is recommended to avoid using highly expressed genes, such as 18S ribosomal RNA (18S), if their Ct value differs by more than 5 cycles from that of the target gene. This discrepancy can complicate baseline correction and generate errors related to amplification efficiency across a wide range of Ct differences [26,27,28]. As a result, a critical question arises about which housekeeping genes remain reliable internal controls in experiments involving both undifferentiated and mature adipocytes, as well as various lipid-modulating treatments. Moreover, what is the minimal panel of HKGs in this case? These questions form the basis of the present study’s aim to evaluate the stability of nine commonly used reference genes: peptidylprolyl isomerase A (Ppia), Gapdh, beta-2 microglobulin (B2M), ribosomal protein, large, P0 (36b4), hydroxymethylbilane synthase (Hmbs), hypoxanthine guanine phosphoribosyl transferase (Hprt), tyrosine 3-monooxygenase/tryptophan 5-monooxygenase activation protein, zeta polypeptide (Ywhaz), 18S and Actb, which differ in their biological functions, cellular localizations, and sensitivities to metabolic changes. The primary focus was on identifying a robust panel of internal control genes to ensure accurate and reproducible normalization of RT-qPCR data in the 3T3-L1 adipogenesis model.
The analysis encompasses various stages of overall differentiation, ranging from preadipocytes to mature adipocytes, along with lipomodulating agent treatments such as palmitic acid (PA) or docosahexaenoic acid (DHA), which have diverse biological effects. Besides the classical tools such as geNorm [29], NormFinder [30], BestKeeper [28], and RefFinder [31], the gene stability was also evaluated via the ΔCt method, conventional statistical testing, correlation, and regression analysis relative to fatty acid-binding protein 4 (Fabp4) and sterol regulatory element binding transcription factor 1 (Srebf1), as specific target genes. The applied strategy, which integrates algorithmic and statistical methods of analysis, aims to provide a robust approach for identifying a stable reference gene panel for reliable RT-qPCR analysis in this complex adipocyte model.
2. Results
2.1. Intracellular Neutral Lipid Accumulation Among the Studied Groups
Oil Red O staining images and subsequent quantitative analysis of intracellular lipid accumulation, presented in Figure 1, confirmed the successful adipogenic differentiation of 3T3-L1 cells. As shown, undifferentiated control preadipocytes (NC0) exhibited minimal lipid accumulation, a characteristic of preadipocytes. After 9 days of adipogenic induction, a significant increase in absorbance at 490 nm was observed in the differentiated adipocytes (positive control) (IC9). This result also corresponded to the microscopic images, in which the cells acquired the typical morphology of early adipocytes, including the appearance of numerous lipid droplets. On day 18, the differentiation in IC18 was even more pronounced: quantitative data demonstrated the highest levels of lipid accumulation, along with microscopic images showing large, confluent lipid vacuoles, a classic feature of mature adipocytes. Supplementation of PA during adipogenesis (PA9 and PA18) maintained lipid accumulation at almost the same levels as fully induced, mature adipocytes in IC groups, while treatment with DHA resulted in its marked suppression. The absorbance at 490 nm in the DHA group was significantly lower compared to controls on the corresponding days, and microscopic images clearly showed a reduced number of differentiated cells.
2.2. Classical Reference Genes Analyses
2.2.1. BestKeeper Algorithm
The analysis of descriptive statistics in the BestKeeper tool version 1 (Table 1) revealed distinct differences in stability among the candidate reference genes. Hprt demonstrated the lowest variability, with a coefficient of variation (CV) = 1.63% and a standard deviation (SD) = 0.47, which is below the generally accepted threshold for high stability (CV < 2%). Ywhaz, Ppia, Gapdh, 36b4, and B2M also showed relatively low variability (CV between 3% and 5%), suggesting moderate to good stability. For them, the range between the minimum and maximum Ct values was limited, which further supports their acceptable expression stability. Actb had CVs slightly above 4–5%, which could also place it in the category of moderately stable genes. Their variability was not critically elevated, but still higher compared to the candidates mentioned above. Hmbs and 18S were outlined as the most unstable genes, with the highest SD (1.38 and 1.46) and CV (9.48% and 10.03%, respectively). The difference between their minimum and maximum Ct values was more than 5 Ct, clearly indicating that Hmbs gene expression varied greatly between conditions.
Correlation analysis against the BestKeeper index (BK), presented in Table 2, revealed that Hmbs, Ppia, 18S, 36b4, and B2M exhibited a nearly linear association with the BestKeeper index (r > 0.94), indicating high consistency in their expression compared to the overall Ct profile of the panel. Slope analysis further supported the stability of Actb, Ppia, 36b4, and B2M (slope ≈ 1), but raised questions about the stability of Hmbs and 18S (slope = 1.424 and 1.521, respectively). Ywhaz, Gapdh, and Hprt showed a moderate to weak correlation with the BK. The target genes Srebf1 and Fabp4 correlated negatively (r = −0.472 and r = −0.538), as expected, since their expression changes dramatically during adipogenesis.
2.2.2. Stability Values Evaluated via Normfinder and geNorm Excel-Based Tools
The results presented in Figure 2 display the stability ranking of the tested HKGs, as determined by the most widely used tools: NormFinder and geNorm. NormFinder identified Ppia as a gene with the best stability value and also recommended Ppia and 36b4 as a stable combination. Based on the average M-values calculated with geNorm v3.5 (Figure 2b), all candidate reference genes—with the exception of Gapdh (M = 2.10)—met the threshold criteria for acceptable stability by 1.5. Among them, Ppia demonstrated the highest expression stability, ranking it as the most suitable HKG for normalization, closely followed by B2M, 36b4, Actb, and Ywhaz.
2.2.3. Summarized RefFinder Analyses
The combined approach in the RefFinder analyses (Figure 3), which evaluates the mean rank among geNorm, NormFinder, BestKeeper, and ΔCt methods, distinguished four levels of stability using the tested HKGs. The highest stability was demonstrated in Ppia and 36b4, followed by B2M and Ywhaz; Actb and Hprt were also stable. In contrast, Gapdh, Hmbs, and 18S were the most unstable genes.
2.3. Statistical Analyses (GraphPad)
2.3.1. Ct Value Distribution and Basal Expression Levels of Candidate Reference Genes
The distribution of Ct values demonstrates apparent differences in basal expression levels among the tested genes (Figure 4). 18S and Hmbs show the lowest Ct values, while Hprt shows the highest. 18S and Hmbs differ from the mean Ct value of the target genes (Fabp4 and Srebf1) by more than ten cycles, indicating their inadequacy as a reference gene. The rest of the analyzed control genes cluster within a mid-range Ct interval, suggesting moderate and relatively comparable expression levels. As expected, the adipogenic marker Fabp4 displays the widest Ct distribution, consistent with its strong upregulation during differentiation.
2.3.2. Z-Score Expression Profiling of Candidate HKGs
The heatmap displays the standardized (Z-score) mean expression values of the studied HKGs and the target adipogenic markers Fabp4 and Srebf1 across the different experimental conditions (Figure 5). This visualization highlights condition-dependent fluctuations in the stability of all reference genes. The gene expression of most of these genes (18S, Actb, 36b4, Hmbs, Ppia, Gapdh, Ywhaz, and B2M) is positively affected in mature adipocytes (IC9, PA9, IC18, and PA18). Only in Hprt, no direct relationship between its expression and adipogenic progression was established.
2.3.3. Statistical Comparison of Raw Ct Values Across Experimental Groups
To quantitatively present the observed changes depicted in the heatmap image, we conducted a classical non-parametric Kruskal–Wallis test and determined the statistical differences in the raw Ct values among the individual experimental groups. The results, presented in Figure 6 align completely with the graphical visualization: the expression levels of all candidate reference genes were significantly affected by both adipogenic induction and the applied lipid-modulating factors. Only for the Hprt gene were no statistically significant differences found.
2.3.4. Pairwise ΔCt Stability Evaluation of Candidate HKGs
As an additional validation step, the stability of the candidate reference genes was examined using the ΔCt comparison method of Silver et al. [32], which evaluates each gene by determining the extent of variation in its pairwise ΔCt comparisons with all other candidates (Table 3). Our calculations identified Ppia, 36b4, B2M, Actb, and Ywhaz as the most stable genes, with mean SD values ranging from 0.62 to 0.71. In contrast, Hprt, Gapdh, and Hmbs showed the highest variability, with SD values close to or exceeding 1, confirming their lower stability.
2.3.5. Correlation Analyses Between Each HKG with Fabp4 or Srebf1
Statistically, correlations of r ≥ ±0.7 are considered strong, moderate correlations typically fall between r = ±0.5 and ±0.7, weak fall between r = ±0.3 and ±0.5, and correlations below ±0.3 are regarded as negligible. The results presented in Table 4 and Table 5 show that none of the analyzed HKGs exhibit a strong correlation with Fabp4 or Srebf1. 36b4, Actb, B2M, and 18S display moderate correlations, which may limit their suitability as validation controls. The correlations observed for Hmbs, Ppia, and Ywhaz are weaker, whereas Hprt and Gapdh show no statistically significant correlation with the Fabp4 and Srebf1 Ct pattern.
2.3.6. Integrated Stability Ranking of Candidate Reference Genes
The data in Table 6 summarizes the results obtained in the current study. Based on the analyzed variability, simplified stability rankings were formed. As a result of the complex experimental model, a fully uniform ranking across all methods could not be generated. However, several genes consistently appear among the top three most stable candidates: Ppia (in all 6 analyses), 36b4 (in 4 out of 6 analyses), and B2M (in 4 out of 6 analyses). These genes demonstrate sufficient reliability to be used in combination as a two- or three-gene normalization panel.
2.3.7. Normalization of Fabp4 ΔCt Values Across All Tested Reference Genes
To further support our statement that Ppia, 36b4, and B2M are consistent enough to be included in the normalization panel, we performed reference adjustment of Fabp4 (Figure 7a) and Srebf1 (Figure 7b) against each of the tested control genes. The analysis presented in Figure 7 revealed apparent differences in the assessment of expression dynamics depending on the internal control used. In eight of the tested controls (Actb, 36b4, Hmbs, Ppia, Gapdh, Ywhaz, B2M, 18S), the overall pattern of normalized Fabp4 and Srebf1 gene expression closely resembled that observed in the row Ct data: undifferentiated cells (NC0, NC9, NC18) exhibited the highest ΔCt values, corresponding to low Fabp4 and Srebf1 expression, whereas differentiated and lipid-modulated groups, especially PA-treated cells, demonstrated significantly lower ΔCt values, indicative of increased adipogenic activity.
However, the amplitude and statistical evaluation of these changes varied significantly between the individual reference genes. For the genes indicated as the most stable in Table 6, consistent and biologically logical differences between the groups were observed, especially in Fabp4 gene expression, normalized to Ppia and 36b4. In contrast, the use of Hprt would lead to substantial changes in the statistical differences and inconsistencies in interpreting the effects.
3. Discussion
Accurate normalization is essential for reliable RT-qPCR analysis, but the selection of appropriate HKGs in adipogenic models remains a significant methodological challenge. According to the available literature to date, it is evident that there is no unified model, particularly in highly dynamic cells such as differentiating adipocytes [22,33,34,35]. The present study systematically evaluated nine commonly used reference genes in a classical 3T3-L1 model across three stages of differentiation (days 0, 9, and 18), as well as under exposure to lipid-modulating compounds (DHA and PA). These conditions induce significant alterations in cellular metabolism and overall phenotype, which inevitably affect the expression of most of the commonly used HKGs. Therefore, the use of a single reference gene is insufficient and carries a considerable risk of incorrect normalization [22]. To demonstrate this, in the present study, we normalized the selected target genes, Fabp4 and Srebf1, against each of the tested HKGs, and the resulting discrepancies were divergent. Moreover, the heatmap analysis together with the statistical evaluation of intergroup variability clearly demonstrates instability across the examined conditions, with none of the HKGs maintaining consistent expression under all experimental conditions. Therefore, in this type of investigation, normalization to a single reference gene—regardless of how widely it may be recommended in the literature—is impractical and would result in large errors in data interpretation. Current minimal standards for generating accurate RT-qPCR results require not only precise experimental execution and analytical rigor, but also normalization of target genes to a reliable and stable set of at least three HKGs. This approach ensures the robustness of RT-qPCR analysis even in highly dynamic biological models such as adipogenesis [27,36,37]. It is further advisable that the selected internal controls represent different biological functions to minimize fluctuations in expression. Additionally, normalization based on the geometric mean rather than the arithmetic mean of the HKG panel is recommended, as this prevents any single reference gene from disproportionately influencing the final normalization factor [29].
In our study, we evaluated the stability of nine commonly used HKGs that differ in both their biological functions and their sensitivity to the metabolic shifts characteristic of adipogenesis. Among these, Gapdh, a key glycolytic enzyme, is frequently used as a single reference gene. Still, recent studies report substantial variability in its expression due to the enhanced glycolytic activity of mature adipocytes and lipid-induced metabolic changes, raising concerns about its reliability as an internal control. Similarly, Actb, widely used as a single control, encodes β-actin, a structural protein that is strongly influenced by cytoskeletal remodeling during adipogenesis. B2M, encoding β2-microglobulin, is a small non-glycosylated protein (~12 kDa) and an essential structural component of major histocompatibility complex class I (MHC I) molecules [38]. Because MHC I is ubiquitously expressed in nearly all nucleated cells, B2M has traditionally been used as a reference gene in RT-qPCR analyses [39]. However, an increasing body of evidence indicates that its expression is not constant across all contexts: B2M is sensitive to inflammatory cytokines, hypoxia, lipotoxicity, and other forms of metabolic stress. In adipocyte models, including 3T3-L1 cells, these stimuli modulate the antigen-presenting machinery, leading to elevated B2M expression during differentiation or inflammatory activation [33]. According to the literature, Hmbs, an enzyme involved in heme biosynthesis, and Hprt, a key component of the purine salvage pathway, generally display moderate but acceptable expression stability. Although Hmbs may be influenced by oxidative stress and Hprt by changes in cellular proliferation, their variability under standard adipogenic conditions remains relatively limited. This makes them suitable as supplementary reference genes in 3T3-L1 adipocyte models. 18S rRNA is a structural component of the 40S ribosomal subunit and plays a key role in mRNA translation. Although it is commonly used as a housekeeping gene in adipocyte studies due to its apparent expression stability [22], its suitability remains debatable because its very high abundance relative to mRNA targets can introduce normalization bias [37]. Interestingly, genes such as 36b4, which encodes the ribosomal protein P0 of the 60S subunit; Ppia, encoding cyclophilin A involved in protein folding [40]; and Ywhaz, which encodes the protein 14-3-3ζ—a regulatory gene participating in insulin signaling and multiple cellular pathways [41,42], typically show exceptionally stable expression in adipocytes but are used far less frequently as normalization controls. Their roles in fundamental and constitutive cellular processes—such as translation, proteostasis, and signaling integration—likely contribute to their maintained transcript stability, even during pronounced shifts in cellular phenotype. Consequently, these genes exhibit minimal variability throughout adipogenesis and under metabolic stress [43,44].
Based solely on their biological roles, it is evident that the experimental conditions in our model inevitably introduce some degree of variation in the expression of nearly all conventionally used internal controls. This underscores the importance of careful selection and empirical validation when establishing an appropriate panel of reference genes.
Even when candidate reference genes are carefully preselected, and RT-qPCR assays are performed accurately, with optimal reaction efficiency, researchers often face a significant challenge: different software and mathematical algorithms frequently produce divergent assessments of gene stability. The application of classical statistical approaches can further complicate interpretation, as these methods also do not always yield a unified ranking. As a result, the selection of an appropriate panel of HKGs is sometimes performed partially “blindly”, especially when no clear consensus emerges across algorithms.
At first glance, however, the bioinformatic tools and classical ones in our evaluations produced apparently divergent outcomes. The three most commonly used algorithmic methods—NormFinder, geNorm, and RefFinder—calculated similar rankings, consistently identifying Ppia, 36b4, B2M, Ywhaz, and Actb as the most stable genes, while reporting substantial instability for Gapdh, Hprt, 18S, and Hmbs. In contrast, descriptive analyses performed with BestKeeper, which rank genes based on variability measures (SD and CV), highlighted Hprt, Ywhaz, Ppia, and Gapdh as the most stable candidates, while excluding Hmbs and 36b4 from the stable group.
Such discrepancies are expected and arise from both the complexity of the experimental model and the fundamentally different mathematical principles underlying these two categories of methods. Algorithm-based tools prioritize internal stability within the reference gene set, whereas classical statistical analyses emphasize absolute differences between experimental groups, independent of how other housekeeping genes behave. Consequently, a gene may appear statistically stable (e.g., Hprt), as it is the only gene without significant intergroup differences, yet still exhibits high relative variability when evaluated within multi-gene normalization algorithms. This illustrates the limitations of relying solely on either statistical tests or algorithmic rankings alone.
As an independent strategy for assessing the expression stability of the reference genes, we applied the method of Silver et al. [32], which is based on pairwise ΔCt comparisons between reference genes. Implementing this approach in our model allowed us to evaluate not individual genes, but the mutual consistency among every possible gene pair. In this way, the ΔCt analysis provides an independent, experimentally grounded assessment that does not rely on algorithmic assumptions but instead reflects the actual behavior of the genes. The results obtained closely correspond to those derived from NormFinder, geNorm, and RefFinder. The least stable genes identified were Hprt, Gapdh, 18S, and Hmbs, whereas the most stable were Ppia, 36b4, and B2M.
To ensure a more robust and well-supported selection of internal controls, we additionally performed regression analysis in BestKeeper and correlation analysis in GraphPad, incorporating Fabp4 and Srebf1 as the target genes in both models. The choice of an appropriate target gene is a critical component of reference gene validation, as it must exhibit clear context-dependent variability that reflects the true biological changes occurring within the system. Fabp4 represents an optimal target gene in our model. It is a well-established adipogenic marker in 3T3-L1 cells, with expression that increases markedly during the transition from preadipocytes to mature adipocytes and responds sensitively to lipid modulators such as palmitate and DHA. As an intracellular fatty acid transporter, Fabp4 directly reflects dynamic shifts in lipid metabolism and therefore displays the expected high variability across the experimental conditions. Srebf1 was included as a second target gene to introduce complementary biological variability. As a central regulator of lipogenesis and adipocyte maturation, Srebf1 captures regulatory changes distinct from the lipid transport-related function of Fabp4, enabling a broader and more balanced evaluation of reference gene performance.
Stable reference genes should remain unaffected by the biological factors influencing the target gene. For this reason, correlation analysis against the target gene should play a key role in defining the normalization panel, although this approach is seldom applied in practice. In our study, none of the analyzed HKGs exhibited a strong correlation with Fabp4 or Srebf1, suggesting that they do not artificially mask the true variability of this dynamically regulated target gene in the RT-qPCR analysis. Nevertheless, for genes showing weak to moderate correlations—Hmbs, Ppia, Ywhaz, 36b4, Actb, and B2M—additional evaluation and validation were required before they can be confidently incorporated as internal controls.
The combined regression analysis in BestKeeper provides an even more precise and reliable basis for refining the selection of our reference gene panel. It is well established that the overall HKG panel (BestKeeper index) should not correlate with the target gene, and that for an individual HKG to be included in the internal control set, it must exhibit a correlation coefficient of at least 0.9 with the BK index. In our dataset, all evaluated genes met these criteria except Hprt and Gapdh.
Integrating all applied approaches—both algorithmic and experimentally based—enabled the generation of a reliable, ranked assessment of the stability of individual housekeeping genes. In the final panel, we included those genes that consistently ranked among the most stable across the majority of evaluation methods. Based on this, we recommend a panel composed of three reference genes (Ppia, B2M, and 36b4), which collectively represent diverse biological functions and thereby minimize the risk of co-regulation. This combination provides more accurate and reliable normalization for RT-qPCR analysis of 3T3-L1 adipocytes under conditions of differentiation and lipid interventions.
Nevertheless, our analysis has certain limitations. Reference gene stability is context-dependent, and the results apply specifically to the adipogenic model, time points, and lipid modulators used in this study. Other metabolic or inflammatory stimuli were not included, nor were additional cell lines or primary adipocytes, including human models, which limits the generalizability of the findings beyond the present experimental design. Additionally, differences in RT-qPCR reagents and amplification conditions may further contribute to variability in reference gene stability across studies.
4. Materials and Methods
4.1. Experimental Design and Cell Treatments
4.1.1. Cell Line and Culture Conditions
3T3-L1 mouse preadipocytes (CRL-3242, ATCC, Washington, DC, USA) were thawed and expanded in T75 culture flasks following standard maintenance procedures. Cells were grown in high-glucose 4.5 g/L Dulbecco’s modified Eagle’s medium (DMEM-HG) supplemented with 10% fetal bovine serum (FBS) and 1% antibiotic mixture (penicillin G, streptomycin, amphotericin B)—control medium (CM)—at 37 °C in a humidified 5% CO_2_ incubator. After two passages, cultures were seeded into 12-well plates (Corning, Costar) at an initial density of 1 × 10^4^ cells/mL and allowed to proliferate until full confluence was achieved. Once the monolayers reached 100% confluence, cells were maintained in CM for 24 h to synchronize the cell cycle prior to the induction of differentiation (Day 0—growth arrest). 3T3-L1 cells were grown in CM throughout the experiment and served as negative control groups (NC0, NC9, and NC18).
4.1.2. Adipogenic Differentiation and Fatty Acid Treatments (Days 1–18)
Adipogenic differentiation was initiated on Day 1 by replacing CM with adipogenic induction medium (IM) for 48 h. IM consisted of DMEM supplemented with 10 μg/mL insulin, 0.1 mM 3-isobutyl-1-methylxanthine (IBMX), 1 μM dexamethasone, and 0.05 mM indomethacin, all purchased from Sigma-Aldrich Chemie GmbH (Merck KGaA, Darmstadt, Germany). According to the ATCC protocol, the 3T3-L1 cell line reaches full maturation on Day 8. Therefore, after 48 h of chemical induction on Day 2, the cells were cultured in maintenance medium (MM), composed of CM supplemented with 10 μg/mL insulin, for an additional 7 (IC9) or 16 days (IC18). The lipid-modulated groups-PA and DHA-were exposed to 60 μM of the corresponding fatty acid (PA, P5585, Sigma-Aldrich Chemie GmbH or DHA, D2534, Sigma-Aldrich Chemie GmbH) from Day 1 to Day 9 of the adipogenesis (PA9, DHA9). Then they were kept in MM for further maturation (PA18, DHA18). The dissolving stepwise procedure is detailed by [45].
The control and experimental groups included in the current study are summarized in Table 7.
For each experimental group, cells cultured in 12-well plates were used both for Oil Red O staining to assess lipid accumulation and for mRNA extraction for subsequent RT-qPCR analysis.
4.2. Quantification of Intracellular Lipid Deposition
Neutral lipid accumulation in mature adipocytes from all experimental groups was evaluated through Oil Red O staining, followed by dye extraction and spectrophotometric quantification, as described by Yang et al. [46]. Briefly, after removal of the culture supernatants, the cells were washed with PBS, fixed in 10% neutral buffered formalin, rinsed with 60% isopropanol, and subsequently stained with a freshly prepared Oil Red O (Sigma-Aldrich, St. Louis, MO, USA) working solution. The stained adipocytes were observed under a Leica inverted microscope equipped with a 5-megapixel DMi1 camera to document the formation of intracellular lipid droplets. To quantify the accumulated lipids, the bound dye was extracted with 100% isopropanol, and the absorbance of the resulting solution was measured at 490 nm using a Synergy™ LX Multi-Mode Microplate Reader (BioTek Instruments, Inc., Winooski, VT, USA). The obtained values were presented relative to IC after the spontaneous adipogenesis measured in NC was excluded.
4.3. Gene Expression Analysis
4.3.1. mRNA Isolation and Conversion to Stable cDNA for Storage
mRNA was isolated with the RNeasy Mini Lipid Tissue Kit (Qiagen GmbH, Hilden, Germany) according to the manufacturer’s instructions. The concentration and purity of the extracted RNA were determined spectrophotometrically by measuring absorbance at 260 and 280 nm using a Synergy™ LX Multi-Mode Microplate Reader with a Take3 Microvolume Plate (BioTek Instruments, Inc., Winooski, VT, USA). After adjusting all samples to an equal RNA concentration, reverse transcription was carried out using the RevertAid First Strand cDNA Synthesis Kit (Thermo Scientific, Waltham, MA, USA), and the generated cDNA samples were subsequently stored at −20 °C.
4.3.2. Primer Design
Primer pairs for the housekeeping and target genes, with the exception of 18S, were designed and validated using a combination of web-available bioinformatic tools. Most primers were generated through NCBI resources and Primer3, following the design criteria outlined in the SYBR Green qPCR Master Mix guidelines. Primer specificity was confirmed using Primer-BLAST (NCBI) https://www.ncbi.nlm.nih.gov/tools/primer-blast (accessed on 21 October 2024), Primer3plus (version: 3.2.5) (https://www.bioinformatics.nl/cgi-bin/primer3plus/primer3plus.cgi, accessed on 21 October 2024), and product characteristics—including expected amplicon length, melting temperatures, and predicted melting curves—were evaluated with Primer3 (version 4.1.0) (https://primer3.ut.ee/, accessed on 21 October 2024) and uMelt Quartz (version 3.6.2) (https://www.dna-utah.org/umelt/quartz/um.php, accessed on 22 October 2024). A temperature-gradient assay was subsequently performed to determine the optimal annealing temperature, which consistently fell within the range of 58–61 °C, close to the standard recommendation of 60 °C. The final primer sequences used in the study are presented in Table 8. The 18S primer sequence was originally described by Arnhold et al. [47].
4.3.3. RT-qPCR Assay
RT-qPCR was carried out using a SYBR Green–based two-step protocol with the KAPA SYBR^®^ Fast qPCR Master Mix (Kapa Biosystems, Merck KGaA, Darmstadt, Germany) on a PicoReal Real-Time PCR System (Thermo Scientific, Waltham, MA, USA). All reactions followed the temperature program recommended by the master mix manufacturer and were performed in duplicate. PCR specificity was verified by analysis of melting curves, and reaction efficiency for each gene was determined using standard curves, yielding values between 97% and 103%.
4.3.4. Assessment of Expression Stability in the Selecting Reference Genes
NormFinder (version 0.953) and RefFinder (https://www.ciidirsinaloa.com.mx/RefFinder-master/, accessed on 21 October 2024), were employed, alongside geNorm and BestKeeper, to comprehensively evaluate the expression stability of the candidate HKGs.
To determine the most suitable reference genes, we applied the NormFinder algorithm [30] using the original Microsoft Excel add-in. In contrast to pairwise comparison models, NormFinder implements a model-based approach for estimating expression variance. The algorithm calculates a stability value derived from the combined assessment of intra-group variation (within biological or technical replicates) and inter-group variation (systematic differences between experimental conditions). Relative expression quantities were exported from PicoReal Software 2.2 (Thermo Scientific) and directly used as input for the analysis. A lower stability score indicates higher consistency of expression for the candidate reference gene.
To complement the NormFinder analysis, gene expression stability was further evaluated using the geNorm macro (geNorm v3.5), which assesses the consistency of expression ratios between all candidate reference genes [29]. The algorithm calculates an M-value for each gene based on the average pairwise variation with all other genes, where lower M-values indicate higher stability. Through stepwise elimination of the least stable genes, geNorm generates a ranked list of candidates and estimates the optimal number of reference genes required for reliable normalization.
Gene stability was additionally evaluated using BestKeeper [28], which evaluates candidate reference genes based on the variation in their raw Ct values. The algorithm calculates the standard deviation (SD) and coefficient of variation (CV) for each gene, with SD > 1 indicating instability. In this analysis, we also included the target gene Fabp4 to examine correlation patterns relative to the candidate reference genes. BestKeeper further performs a pairwise correlation analysis between each gene and the BestKeeper Index, with correlation coefficients (r) closer to 1 indicating greater stability.
RefFinder, an online integrative platform combined the outputs of NormFinder, geNorm, BestKeeper, and the comparative ΔCt method, providing a unified evaluation system for reference gene stability. For each algorithm, RefFinder assigns an algorithm-specific rank to every candidate gene and subsequently calculates a geometric mean of these ranks to produce a final comprehensive stability index [31].
The stability of the tested reference genes was additionally evaluated using the comparative ΔCt method proposed by Silver et al. [32]. In this approach, each candidate reference gene is compared pairwise against all other candidates by calculating ΔCt values. For every pairwise comparison, the standard deviation (SD) of the ΔCt values is calculated across all samples in the dataset. These SD values are then averaged, and the gene with the lowest mean SD is considered the most stable, as it displays the least variability relative to the other reference genes.
By integrating model-based, pairwise, variance-oriented, and ΔCt-dependent analytical principles, this approach minimizes the influence of any single technique and yields a more balanced evaluation. As a result, the multi-algorithm framework provided a robust, consistent, and highly reliable assessment of reference gene suitability under the specific experimental conditions of the study.
4.4. Statistical Analysis
Statistical processing and data visualization were conducted using GraphPad Prism 10.5.0 Software LLC (Boston, MA, USA). Descriptive statistics were applied to determine the mean and standard deviation (SD) of ΔCt values, while the standard error of the mean (SEM) was calculated for raw Ct data. Normality was assessed using the Kolmogorov–Smirnov test. Normally distributed data were analyzed by one-way ANOVA with Tukey’s post hoc test, whereas non-normal data were evaluated using the Kruskal–Wallis test followed by Dunn’s post hoc comparisons. Statistical significance was set at p < 0.05.
5. Conclusions
Our findings strengthen the growing consensus that traditional reference genes cannot be assumed to be universally stable, particularly in systems undergoing pronounced metabolic and morphological changes. The 3T3-L1 differentiation model exemplifies such a system, in which the stability of HKGs is highly context-dependent and influenced by both the stage of adipogenesis and the lipid-modulating treatments applied. The multi-step evaluation strategy employed in this study—including algorithm-based approaches (geNorm, NormFinder, RefFinder, BestKeeper), the ΔCt method, correlation index with specific target genes (Fabp4 and Srebf1), and assessment of intergroup variation—provided a more rigorous and reliable framework for identifying suitable HKGs. Ppia, 36b4, and B2M emerged as the most robust reference candidates, collectively forming a stable and functionally diverse normalization panel.
This approach highlights the importance of empirically validating reference gene selection to ensure the accurate interpretation of transcriptional changes in adipogenic models.
The reference list from the paper itself. Each links out to its DOI / PubMed record.
- 1Basil B. Myke-Mbata B.K. Eze O.E. Akubue A.U. From Adiposity to Steatosis: Metabolic Dysfunction-Associated Steatotic Liver Disease, a Hepatic Expression of Metabolic Syndrome—Current Insights and Future Directions Clin. Diabetes Endocrinol.2024103910.1186/s 40842-024-00187-439617908 PMC 11610122 · doi ↗ · pubmed ↗
- 2Nussbaumerova B. Rosolova H. Obesity and Dyslipidemia Curr. Atheroscler. Rep.20232594795510.1007/s 11883-023-01167-237979064 · doi ↗ · pubmed ↗
- 3Vekic J. Stefanovic A. Zeljkovic A. Obesity and Dyslipidemia: A Review of Current Evidence Curr. Obes. Rep.20231220722210.1007/s 13679-023-00518-z 37410248 · doi ↗ · pubmed ↗
- 4Weickert M.O. Nutritional Modulation of Insulin Resistance Scientifica 20122012115 Available online: https://onlinelibrary.wiley.com/doi/full/10.6064/2012/424780(accessed on 6 December 2025)10.6064/2012/42478024278690 PMC 3820526 · doi ↗ · pubmed ↗
- 5JanićM. JanežA. El-Tanani M. Rizzo M. Obesity: Recent Advances and Future Perspectives Biomedicines 20251336810.3390/biomedicines 1302036840002780 PMC 11853004 · doi ↗ · pubmed ↗
- 6Martins T. Ferreira T. Nascimento-Gonçalves E. Castro-Ribeiro C. Lemos S. Rosa E. Antunes L.M. Oliveira P.A. Obesity Rodent Models Applied to Research with Food Products and Natural Compounds Obesities 2022217120410.3390/obesities 2020015 · doi ↗
- 7Zhao J. Zhou A. Qi W. The Potential to Fight Obesity with Adipogenesis Modulating Compounds Int. J. Mol. Sci.202223229910.3390/ijms 2304229935216415 PMC 8879274 · doi ↗ · pubmed ↗
- 8Nunn E.R. Shinde A.B. Zaganjor E. Weighing in on Adipogenesis Front. Physiol.20221382127810.3389/fphys.2022.82127835283790 PMC 8914022 · doi ↗ · pubmed ↗