Enhancement of Non-Enzymatic Antioxidants in Eutrema salsugineum Under Salt Stress Depends on Salicylate Depletion
Ya-Jian Fang, Xin-Yue Yang, Lin-Bei Xie, Zhong-Wei Zhang, Shu Yuan

TL;DR
This study shows how Eutrema salsugineum boosts its antioxidant defenses under salt stress by reducing salicylic acid levels.
Contribution
The study reveals a novel link between salicylate depletion and enhanced non-enzymatic antioxidants in salt-stressed plants.
Findings
Low salicylic acid in Eutrema salsugineum upregulates DHAR and GR genes, increasing antioxidant pools.
Exogenous salicylic acid and PBZ treatment modulate antioxidant ratios and enzyme activities.
Salicylate depletion is a key mechanism for Eutrema's superior salt tolerance.
Abstract
Eutrema salsugineum is a model species for studying stress resistance, particularly extreme salinity, and is often compared with Arabidopsis thaliana. Previous research has shown that basal salicylic acid (SA) levels are significantly lower in E. salsugineum than in A. thaliana. In this study, subtractive hybridization revealed that SA-related genes were extensively induced in Arabidopsis but not in Eutrema. Using exogenous SA and the biosynthesis inhibitor paclobutrazol (PBZ), we further demonstrated that the low endogenous SA level in Eutrema significantly upregulates dehydroascorbate reductase (DHAR) and glutathione reductase (GR) gene expression, doubling the pools of total ascorbic acid and total glutathione. While SA treatment decreased the ratios of reduced ascorbic acid (ASA) to dehydroascorbate (DHA) and reduced glutathione (GSH) to oxidized glutathione (GSSG), PBZ treatment…
Genes, proteins, chemicals, diseases, species, mutations and cell lines named across the full text — each resolved to its canonical identifier and authoritative record.
Click any figure to enlarge with its caption.
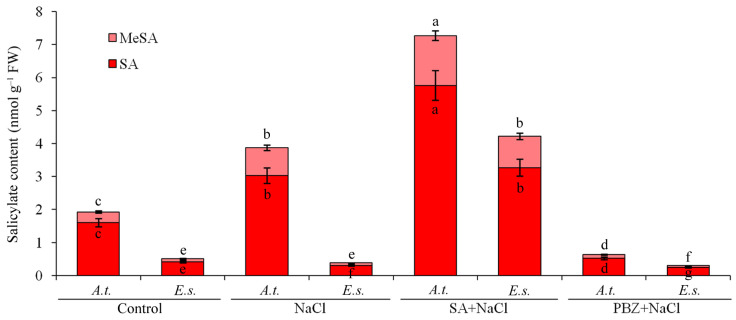 Figure 1
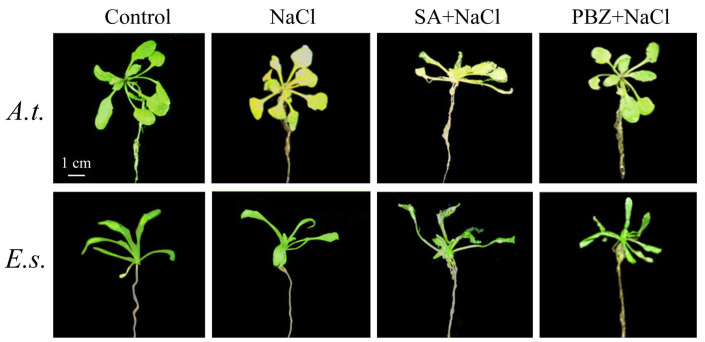 Figure 2
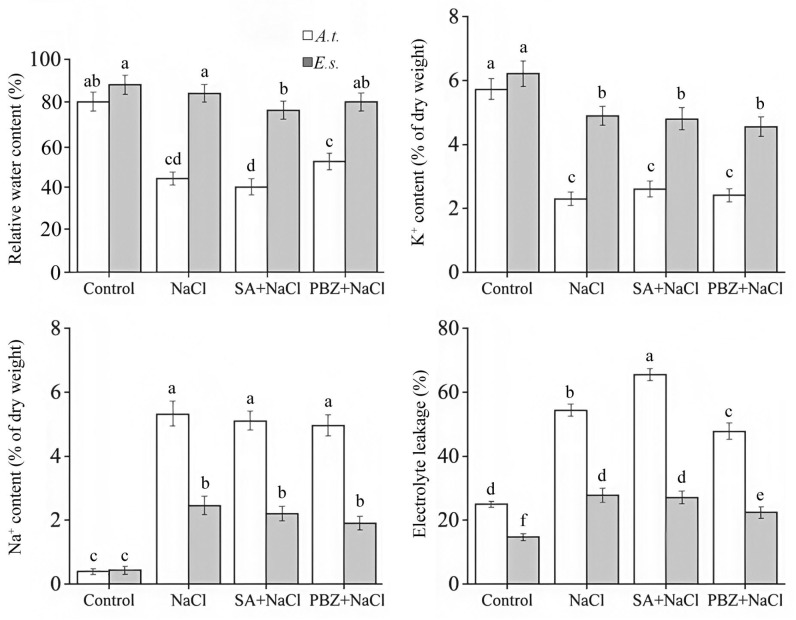 Figure 3
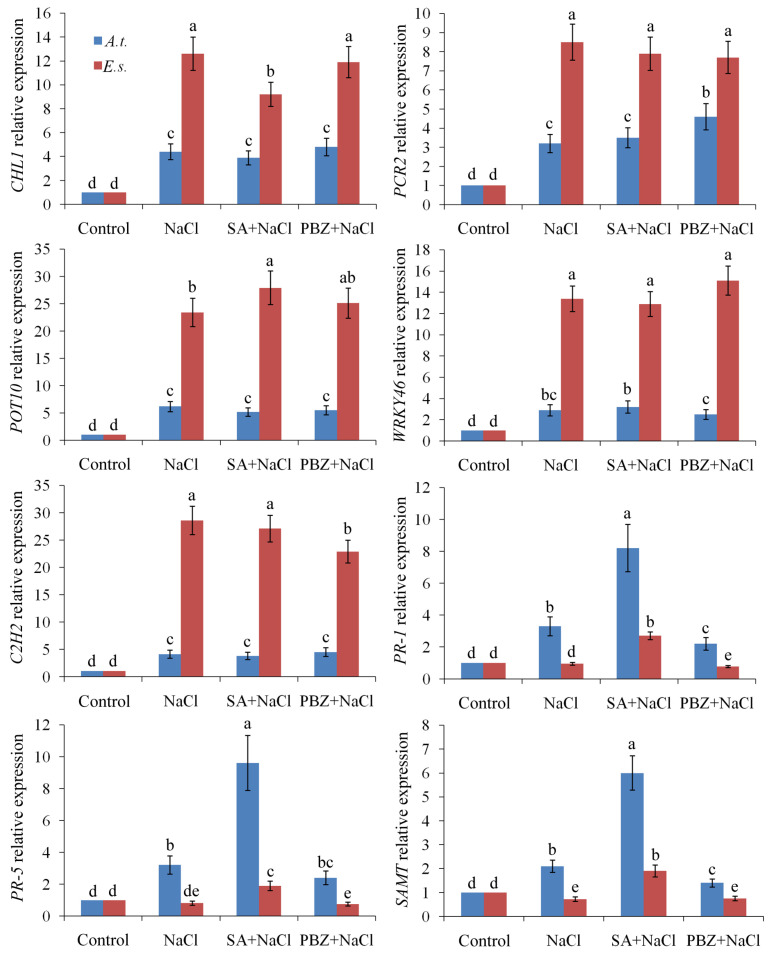 Figure 4
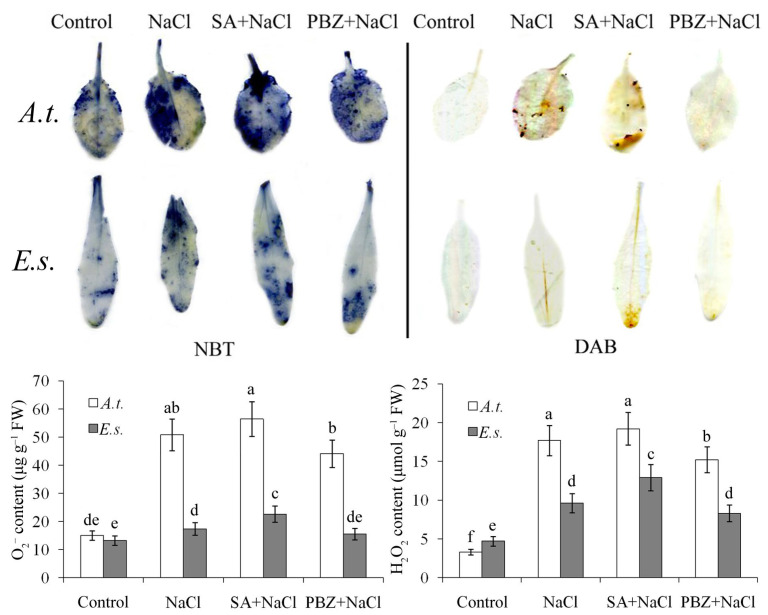 Figure 5
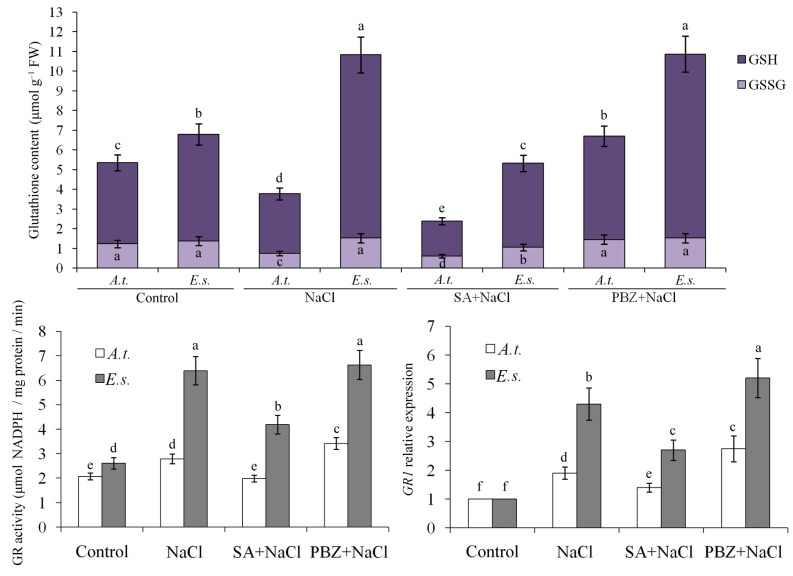 Figure 6
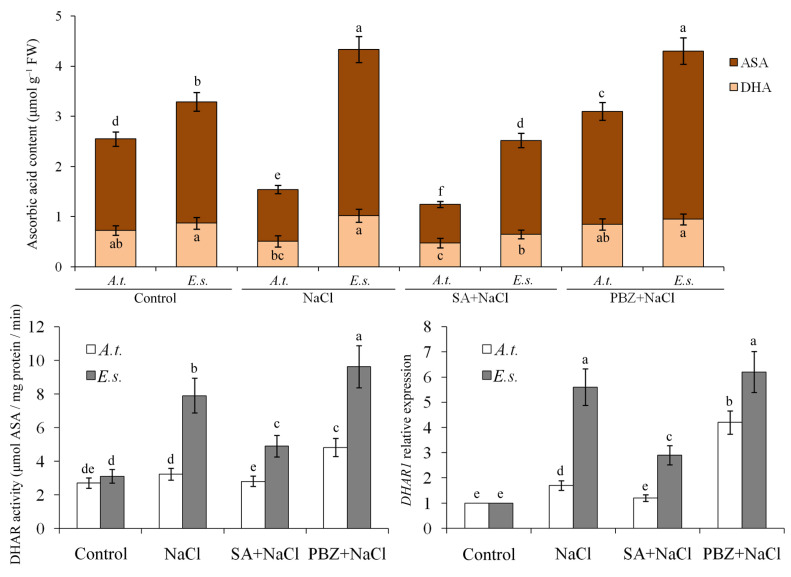 Figure 7
- —Sichuan Province Science and Technology Support Program
Peer Reviews
No public reviews on file for this paper yet. If you reviewed it on a platform where reviews are public (OpenReview, ICLR, NeurIPS, ICML), you can paste yours below so the community can read it here.
Videos
No videos yet. Explain this paper in a talk, walkthrough, or lecture? Add one.
Taxonomy
TopicsPlant Stress Responses and Tolerance · Plant responses to water stress · Plant-Microbe Interactions and Immunity
1. Introduction
Soil salinity acts as a critical environmental constraint, suppressing crop yield and compromising seedling survival, which collectively endangers food security worldwide [1,2]. This form of stress adversely affects an estimated 20% of total arable land and 30% of irrigated farmland across the globe [3]. The capacity for salt tolerance is a complex trait that shows significant variation between plant species and among cultivars, further modulated by the organism’s developmental status, prevailing growth conditions, and specific agronomic practices [1,2,3].
Salt exposure triggers a biphasic plant response. The initial osmotic stress phase (Stage I) rapidly inhibits new leaf growth within hours, followed by an ionic stress phase (Stage II) that disrupts chlorophyll and accelerates leaf senescence [1,2,3]. Under saline conditions, reduced water uptake leads to the accumulation of sodium and chloride ions within cells, severely impairing physiological and metabolic processes [1,2,3]. The toxic accumulation of Na^+^ and Cl^−^ ions further inhibits photosynthesis by disrupting enzyme activity and pigment synthesis [4]. Subsequent ion exchange alterations elevate reactive oxygen and nitrogen species (ROS/RNS) while reducing stomatal conductance [5]. Consequently, maintaining cellular ion homeostasis, particularly cytoplasmic Na^+^ concentration, is critical for physiological function and survival. Salt stress ultimately impacts development across all stages, from root and shoot growth to flowering and senescence. In response, plants activate downstream signaling pathways to mitigate these effects [1,2,3,4,5].
Research over the past few decades has established Eutrema salsugineum as a key model for studying stress resistance due to its remarkable tolerance to salinity, cold, drought, and ozone, with a genome that is highly comparable to Arabidopsis thaliana [6,7]. Transcriptomic analyses have identified the molecular basis of this high stress tolerance, revealing that many stress-associated genes in E. salsugineum, including those related to abscisic acid (ABA) biosynthesis and signaling, are constitutively expressed at higher levels than in A. thaliana even under non-stress conditions [8,9,10,11]. Unlike A. thaliana, which shows substantial transcriptional activation upon stress exposure, E. salsugineum exhibits only minor changes in gene expression [8,9,10,11]. This pattern is mirrored at the protein level, where salt stress induces more pronounced changes in protein abundance in Arabidopsis than in Eutrema [12]. Together, these findings point to a “stress preparedness” strategy in E. salsugineum that underlies its halophytic nature. Further supporting this, metabolite profiling shows significant differences between the two species following salt stress [13], suggesting that metabolic adjustment and the activation of pre-existing enzymes provide a faster and more efficient response than synthesizing new proteins [14].
Research has shown a contrasting SA response to salt stress between A. thaliana and E. salsugineum [15]. Under control conditions, E. salsugineum SA concentrations were much lower than in A. thaliana, and NaCl treatment further reduced them in E. salsugineum, whereas it increased SA in A. thaliana [15]. Correspondingly, salt stress induced enhanced levels of reduced ascorbate and glutathione in Eutrema, but not in Arabidopsis [16]. The wetland halophyte plant species Kosteletzkya pentacarpos also showed depletion of salicylic acid with increased ascorbate contents under a mixed Cd + Zn treatment [17].
The functional importance of this SA reduction in E. salsugineum is not well understood, and the detailed mechanism through which SA depletion regulates non-enzymatic antioxidants needs further investigation. In the present work, subtractive hybridization indicated a broad induction of SA-related genes in Arabidopsis but not in Eutrema. Experiments using applied SA and an inhibitor confirmed that the inherent SA depletion in Eutrema significantly boosts the expression of DHAR1 and GR1 genes, doubling the concentrations of reduced ascorbic acid and glutathione. This fortified antioxidant capacity is identified as an important factor in the salt tolerance of Eutrema.
2. Results
2.1. Salt Stress-Responsive Genes Identified by Two-Round SSH in A. thaliana and E. salsugineum
Earlier microarray studies have shown that thousands of Arabidopsis genes—approximately 30% of the transcriptome—respond to salt stress [18]. To identify a more focused set of key genes involved in salt tolerance in A. thaliana and E. salsugineum, we conducted a two-round suppression–subtractive hybridization (SSH) screen [19,20] using RNA samples collected before and after NaCl treatment. Pairwise comparison of two rounds of SSH revealed that genes encoding SA-signaling pathogenesis-related proteins PR-1 and PR-5, as well as salicylate/benzoate carboxyl methyltransferase (SAMT), were prominently enriched in Arabidopsis (Table 1). In contrast, genes encoding NPK1-related protein kinase 2 (chlorate/nitrate transporter CHL1), WRKY transcription factor 46 (WRKY46), C2H2 zinc finger superfamily protein (C2H2), Plant Cadmium Resistance 2 (PCR2), and potassium transporter 10 (POT10) were prominently enriched in Eutrema (Table 2). All five genes are correlated with ionic homeostasis directly or indirectly.
2.2. SA Doubles in A. thaliana but Not in E. salsugineum Under Salt Stress
Under control conditions, SA concentrations were four-fold lower in E. salsugineum than in A. thaliana (Figure 1). While NaCl treatment doubled SA levels in A. thaliana, it led to a decrease in E. salsugineum. This salt-induced SA accumulation in A. thaliana could be mimicked in E. salsugineum by exogenous application of 2 mM SA under stress. Conversely, treatment with 2 mM of the SA biosynthesis inhibitor PBZ [21] suppressed approximately 70% of SA accumulation.
The SA derivative methyl salicylate (MeSA) acts as a long-distance phloem-mobile signal for systemic resistance against various biotic and abiotic stresses [22,23]. It is synthesized from SA by SAMT. According to SSH results, salt stress promoted SAMT gene expression in A. thaliana but not in E. salsugineum. Correspondingly, basal MeSA levels were fourfold higher in control A. thaliana compared to E. salsugineum (Figure 1). NaCl treatment tripled MeSA concentrations in A. thaliana but had no significant effect on MeSA levels in E. salsugineum.
NaCl treatment induced apparentwiltingand yellowing in A. thaliana but not in E. salsugineum. Co-treatment with SA exacerbated wilting and yellowing, while co-treatment with PBZ partially alleviated salt-induced wilting and yellowing (Figure 2).
NaCl treatment significantly reduced the relative water content (RWC) in both species. Co-treatment with SA exacerbated this reduction, while co-treatment with PBZ partially alleviated the reduction (Figure 3). Correspondingly, relative electrolyte leakage—an indicator of membrane damage and permeability—was markedly elevated under salt stress (Figure 3). This increase was further aggravated by SA but mitigated by PBZ. All these physiological changes were more pronounced in A. thaliana than in E. salsugineum.
Regarding ion homeostasis, leaf Na^+^ content increased dramatically under salt stress. In contrast, K^+^ content decreased under salinity (Figure 3). Neither SA co-treatment nor PBZ co-treatment affected Na^+^ or K^+^ content (Figure 3), suggesting that SA depletion plays no role in K^+^ uptake or Na^+^ excretion.
2.3. SA Does Not Affect Salt Stress-Responsive Genes Specific to Eutrema
To explore the mechanism by which SA depletion promotes salt stress tolerance, we analyzed salt-tolerant genes identified via SSH using q-PCR. Although all five representative salt stress-responsive genes specific to Eutrema (CHL1, PCR2, POT10, WRKY46, and C2H2) were induced by NaCl treatment (more pronouncedly in E. salsugineum than in A. thaliana), their expression was not significantly affected by either SA or PBZ (Figure 4). In contrast, the SA-signaling genes PR-1 and PR-2, along with the SA-metabolism gene SAMT, were induced by either NaCl or SA treatment, with these responses being more pronounced in A. thaliana than in E. salsugineum (Figure 4). Therefore, SA depletion appears to enhance salinity tolerance independently of increased ionic homeostasis gene expression.
2.4. SA-Depletion Alleviates Oxidative Damage Under Salt Stress
Abiotic stresses like salinity can disrupt the cellular redox balance in plants. To investigate whether SA levels influence ROS accumulation under salt stress, we used nitroblue tetrazolium (NBT) and 3,3-diaminobenzidine (DAB) staining to detect superoxide (O_2_^−^) and hydrogen peroxide (H_2_O_2_) deposition, respectively (Figure 5). NaCl treatment intensified staining in both species, indicating elevated oxidative damage; however, E. salsugineum exhibited significantly less ROS accumulation than A. thaliana. SA co-treatment increased ROS staining, while PBZ co-treatment reduced it (Figure 4). These results are consistent with the electrolyte leakage data presented in Figure 3.
2.5. SA-Depletion Alleviates Oxidative Damage by Promoting Non-Enzymatic Antioxidants
The activities of four representative antioxidant enzymes—superoxide dismutase (SOD), peroxidase (POD), catalase (CAT), and ascorbate peroxidase (APX)—were activated under salt stress (Figure S1). However, neither SA nor PBZ significantly affected their activities. In some cases (e.g., POD and APX), both SA and PBZ treatments slightly inhibited enzyme activity (Figure S1).
We also measured the levels of GSH, GSSG, ASA, and DHA. Under 200 mM NaCl stress, glutathione (especially the reduced form) and ascorbic acid (especially the reduced form) increased in E. salsugineum but decreased in A. thaliana (Figure 6 and Figure 7). SA treatment reduced these antioxidants in both species. In contrast, PBZ treatment maintained significantly higher levels of GSH and ASA under the same stress conditions (Figure 6 and Figure 7).
Notably, the activities and corresponding gene expression of GR and DHAR increased significantly at 200 mM NaCl, both with and without 2 mM PBZ, but decreased slightly upon SA treatment. This pattern corresponds to the higher GSH/GSSG and ASA/DHA ratios observed at 200 mM NaCl with or without PBZ. These changes were more pronounced in E. salsugineum than in A. thaliana (Figure 6 and Figure 7). Overall, endogenous SA levels were negatively correlated with GR and DHAR activity and gene expression, suggesting that SA depletion alleviates oxidative damage by promoting non-enzymatic antioxidants at both the transcriptional and enzymatic levels.
3. Discussion
SA is a key signaling molecule with multiple functions in plants. In addition to its established role in pathogen defense, SA mediates responses to abiotic stress [24]. Research indicates that elevated SA concentrations typically heighten plant sensitivity to such stress, with most species exhibiting optimal stress tolerance at SA levels between 0.1 mM and 0.5 mM [24]. Maintaining an appropriate SA concentration is critical because it helps regulate sodium (Na^+^) uptake by roots and its translocation to shoots, while also inhibiting potassium (K^+^) efflux through depolarization-activated outward-rectifying K^+^ channels and ROS-activated non-selective cation channels [25,26]. In the present study, Eutrema salsugineum was found to contain four times less SA than Arabidopsis thaliana under control conditions. Salt (NaCl) treatment increased SA levels twofold in A. thaliana but not in E. salsugineum. Applying 2 mM SA exogenously to E. salsugineum raised its internal SA to match that of salt-stressed A. thaliana; at this concentration, SA increased oxidative injury in both species.
E. salsugineum exhibits a unique transcriptional response to salinity. Using suppression–subtractive hybridization, this study identified several salt-responsive genes specific to Eutrema. Among these, CHL1 has not been previously linked to salt stress, but it functions upstream in glutathione-dependent phytochelatin biosynthesis under cadmium exposure [27] and influences zinc accumulation via a nitrate-dependent pathway [28]. Overexpression of PCR2 enhances tolerance to cadmium and other heavy metals [29,30]. High-affinity potassium transporters, such as the POT10 protein, are essential for potassium acquisition. Various potassium transporters promote salt tolerance by modulating K^+/^Na^+^ homeostasis under saline conditions [31,32]. The transcription factor WRKY46 controls a network of genes related to cellular redox balance and stomatal aperture during salt stress [33]. Furthermore, WRKY46 is involved in a feed-forward loop that inhibits lateral root growth under osmotic/salt stress by influencing ABA signaling and auxin homeostasis [34,35]. Additional studies have shown that certain C2H2-type zinc finger proteins enhance salt tolerance by supporting ionic homeostasis and osmotic adjustment [36,37,38].
The application of SA and PBZ did not significantly alter the expression of the aforementioned genes. Consequently, the enhanced salinity tolerance observed in plants with depleted SA appears to operate independently of increased ionic homeostasis gene expression. This aligns with prior research demonstrating that SA-deficient Arabidopsis expressing a salicylate hydroxylase (NahG) gene exhibits greater tolerance to moderate salt stress [39]. A contributing factor may be the higher GSH/GSSG and ASA/DHA ratios maintained in NahG plants under stress, as reported previously [40]. Although these plants do not inherently produce more active antioxidant enzymes than wild-type plants under normal conditions, they sustain higher activities of GR and DHAR during stress [40]. Supporting this, salinity induced an increased pool of reduced ascorbate and total glutathione in Eutrema, but not in Arabidopsis [16]. Consistent with these findings, the present study observed that SA decreased, while PBZ increased, the contents of glutathione and ascorbic acid, the GSH/GSSG and ASA/DHA ratios, and the activities/gene expression of GR and DHAR. Therefore, the SA-depletion-induced rise in non-enzymatic antioxidants is likely a key mechanism behind Eutrema’s high salt stress tolerance.
The redox-sensitive transcriptional coactivator NPR1, which is central to SA signaling [25,26], may be involved. Further investigation is required to determine if NPR1 can bind to cis-acting elements or interact with trans-acting factors on the promoters of GR and DHAR genes to repress their transcription. Alternatively, SA depletion might regulate these genes through crosstalk with other phytohormones. For example, salt treatment induces a twofold increase in ABA in A. thaliana, but not in E. salsugineum [15]. In E. salsugineum, levels of jasmonic acid (JA) and jasmonoyl-L-isoleucine (JA-Ile) are low and further decrease under salinity [15]. These distinct hormonal responses may be linked to SA depletion in Eutrema. As indicated by Ismail et al. [41], the interaction between ABA and JA is particularly critical for determining plant survival under salt stress. More detailed mechanistic studies are needed to elucidate these pathways.
4. Materials and Methods
4.1. Plant Material and Growth Conditions
Seeds of Arabidopsis thaliana ecotype Col-0 were imbibed in a 2 mg/L gibberellin solution and subjected to a 2-day vernalization period at 4 °C in darkness. In contrast, Eutrema salsugineum ecotype Shandong seeds (a gift from Shandong Normal University, China) received the same gibberellin treatment but were vernalized for 30 days under identical dark, 4 °C conditions. Following stratification, all seeds were sown in vermiculite-filled pots. Seedlings were cultivated in a growth room set to 23 ± 1 °C, 70% humidity, a light intensity of 100 μmoL m^−2^ s^−1^, and a 16/8-h light/dark photoperiod.
For salt stress induction, 21-day-old seedlings were transferred to a half-strength MS nutrient solution supplemented with 200 mM NaCl for three days. Concurrently with the initiation of NaCl exposure, another set of seedlings received a foliar application of either 2 mM salicylic acid (SA) or 2 mM paclobutrazol (PBZ).
4.2. Two-Round Suppression Subtractive Hybridization (SSH)
Total RNA extraction was performed with TRIzol Reagent^®^ (Molecular Research Center, Cincinnati, OH, USA). For first-strand cDNA synthesis, 1 μg of total RNA was combined with 10 pmol of an anchor oligo dT primer (CDS-PT, containing an Rsa I site) in 10 μL of RNase-free water, heated to 70 °C for 10 min, and then cooled on ice for 5 min. This annealed mixture was combined with 200 U of PowerScript™ Reverse Transcriptase (Clontech, Mountain View, CA, USA) in a 20 μL reaction containing 1× first-strand buffer, 10 mM DTT, 10 pmol of a T-S primer (AD-G, with an Rsa I site) [42], and 1 mM each dNTP, followed by incubation at 42 °C for 90 min.
To generate the necessary quantity of driver cDNA for subtraction hybridization, aliquots (1–2 μL) of the first-strand cDNA were amplified using a 2× EasyTaq PCR SuperMix system (TransGen Biotech. Co., Ltd., Beijing, China) in a 50 μL reaction with the T-S PCR primer (AD-PCR). The cycling parameters were: 95 °C for 1 min, followed by 28–36 cycles of 95 °C for 30 s, 58 °C for 30 s, and 72 °C for 2.5 min. This approach, based on the SMARTer™ PCR cDNA Synthesis Kit (Clontech) template-switching method, yields over 2 μg of double-stranded cDNA from a small amount of starting RNA [43]. The amplified cDNA was purified with an E.Z.N.A^®^ Cycle-Pure Kit (Omega Biotech Corporation, Victoria, BC, Canada) and quantified.
Subsequent suppression–subtractive hybridization (SSH) was conducted according to standard protocols [43], utilizing the PCR-Select™ cDNA Subtraction Kit (Clontech) for convenience. The procedure involved sequential steps of Rsa I digestion, adaptor ligation to tester cDNA, first and second hybridizations, and suppression nested PCR amplification [43]. For a secondary SSH, 2 μg of purified product from the first SSH was used as both driver and tester cDNA, following the same standard procedures [43]. All primers used are listed in Table S1.
Four total RNA samples from whole seedlings were prepared: (I) A. thaliana seedlings before treatment; (II) A. thaliana seedlings after treatment; (III) E. salsugineum seedlings before treatment; (IV) E. salsugineum seedlings after treatment. Subtracting Sample I from Sample II yielded salt-induced genes in A. thaliana (Result “A.t.”), while subtracting Sample III from Sample IV yielded salt-induced genes in E. salsugineum (Result “E.s.”). Subtracting Result “A.t.” from Result “E.s.” produced a final set of salt-tolerance genes specific to E. salsugineum, whereas subtracting Result “E.s.” from Result “A.t.” yielded salt-tolerance genes specific to A. thaliana.
Following the secondary SSH, the resulting PCR products were cloned into the pEASY-T1 Simple vector (TransGen Biotech. Co., Ltd., Beijing, China). Positive clones were identified by blue/white screening, and 50 random positive clones from each product were selected for sequencing.
4.3. Quantitative Real-Time PCR Analysis
Gene expression was quantified via quantitative RT-PCR (q-PCR) with SYBR Premix Ex Taq (Takara Biomedical Technology, Dalian, China). The initial copy number of each target gene was derived from its threshold cycle (Ct), which is the PCR cycle at which the fluorescence signal rises above the background [44]. Each sample was analyzed with three biological replicates, and ACTIN7 was used as an internal reference gene. Expression levels in A. thaliana or E. salsugineum seedlings under control (no NaCl) conditions were set to a value of 1. All primer sequences are provided in Table S2.
4.4. Salicylate Determination
Leaf samples for salicylate analysis were collected during midday. The procedures for extraction and analysis followed established methods by Dobrev and Kamínek [45] and Dobrev and Vankova [46]. In brief, fresh samples (approximately 100 mg) were homogenized and extracted using a methanol/water/formic acid mixture (15/4/1, v/v/v). Labeled internal standards—specifically ^2^H_4_-SA (Olchemim, Olomouc, Czech Republic) and ^2^H_4_-MeSA (CDN Isotopes, Quebec, QC, Canada)—were introduced at a concentration of 10 pmol per sample. Subsequent purification employed a C18 solid-phase extraction column (SepPak-C18, Waters, Milford, MA, USA), followed by separation on a reverse-phasecation-exchange column (Oasis-MCX, Waters). The hormone fraction was eluted with methanol and separated via HPLC (Model 1260, Agilent, Santa Clara, CA, USA). Finally, SA and MeSA were quantified from the crude plant extracts using HPLC mass spectrometry as described by Pan et al. [47].
4.5. Sodium and PotassiumContent Determination
Potassium content was quantified according to the method of [48] using a GC flame photometric detector (Agilent). For analysis, 0.5 g of fresh plant tissue underwent wet digestion with 6 mL of concentrated 98% H_2_SO_4_ and 3 mL of H_2_O_2_ over a 5 h period. The resulting mineralized digest was dissolved in 5 mL of 0.1 M HNO_3_, filtered through a 0.25 μm nylon membrane, and brought to a final volume of 100 mL with distilled water. A 5 mL aliquot of this solution was subsequently diluted to 50 mL. The concentrations of Na^+^ and K^+^ in the final diluted solution were determined via flame photometry, and the ion content in the original tissue was calculated using standard calibration curves.
4.6. ROS Staining and Quantification of Oxidative Damages
The accumulation of superoxide anions (O_2_^−^) and hydrogen peroxide (H_2_O_2_) in leaves was initially assessed through histochemical staining, as outlined by [49]. Leaf segments were incubated for 3 h in either 0.8 mg/mL nitroblue tetrazolium (NBT) or 2.4 mg/mL 3,3-diaminobenzidine (DAB). Following destaining in 75% ethanol, the samples were imaged and archived using a Leica M 165 C/FC stereomicroscope.
For quantitative analysis, the contents of H_2_O_2_ and O_2_^−^ were measured following an established protocol [50]. Leaves (0.5 g) were harvested three days post-stress treatment, ground in liquid nitrogen, and homogenized in 5 mL of 0.1% (w/v) trichloroacetic acid (TCA). After centrifugation at 12,000×g for 20 min at 4 °C, 1 mL of the supernatant was mixed with 0.5 mL of 10 mM sodium phosphate buffer (pH 7.0) and 1 mL of 1 M potassium iodide (KI). The H_2_O_2_ concentration was determined by measuring absorbance at 390 nm.
To quantify O_2_^−^, 0.5 g of leaf tissue was powdered in 1.5 mL of 65 mM sodium phosphate buffer (pH 7.8) and centrifuged at 10,000× g for 15 min. A 0.5 mL aliquot of the supernatant was combined with 0.5 mL of the same phosphate buffer and 0.1 mL of 10 mM hydroxylamine hydrochloride. The mixture was incubated at 25 °C for 20 min. Subsequently, 1 mL of 58 mM p-aminobenzenesulfonic acid and 1 mL of 7 mM α-naphthylamine were added, followed by a further 20 min incubation at 25 °C. The final reaction mixture was extracted with an equal volume of chloroform, and the absorbance of the aqueous phase was read at 530 nm to determine O_2_^−^ content.
Electrolyte leakage was evaluated using the method of Dionisio-Sese and Tobita [51]. After detecting the conductivity, the plant sample was boiled for 20 min to achieve 100% electrolyte leakage. Relative water content was determined as the ratio of (fresh mass − dry mass)/(water-saturated mass − dry mass) [52].
4.7. Determination of Antioxidant Enzyme Activities
Superoxide dismutase (SOD) activity was quantified by measuring the ability to inhibit the photochemical reduction of nitroblue tetrazolium following the method of Liu et al. [53]. For peroxidase (POD) activity assessment, the method of Verma and Mishra [54] was followed. The amount of H_2_O_2_ utilized was extrapolated from the standard curve between A_520_ and H_2_O_2_ concentration. Catalase (CAT) was measured as the decline in absorbance at 240 nm due to the decrease in extinction of H_2_O_2_, and ascorbate peroxidase (APX) activities were determined by the decrease in absorbance at 290 nm as ascorbate was oxidized according to the procedures described by Esfandiari et al. [55]. Dehydroascorbate reductase (DHAR) activity was evaluated by monitoring the rise in absorbance at 265 nm, corresponding to reduced ascorbate formation [40]. Glutathione reductase (GR) activity was measured based on the decline in NADPH absorbance at 340 nm [40].
4.8. Determination of GSH, GSSG, ASA, and DHA
The extraction and quantification of reduced ascorbic acid (ASA) and dehydroascorbate (DHA) were performed according to established methods [56,57]. Fresh leaf tissue (250 mg) was homogenized in 2.0 mL of 10% (w/v) trichloroacetic acid (TCA) and centrifuged for 5 min at 10,000× g total ascorbate (after reducing DHA to ASA by dithiothreitol), and ASA in the supernatant, were measured as Fe^2+^–bipyridine complex (absorbance maximum at 525 nm) that was formed after reduction of Fe^3+^ by ASA. DHA content was calculated from the difference between total ascorbate and ASA.
Similarly, the procedures for extracting and determining reduced glutathione (GSH) and oxidized glutathione (GSSG) followed previously described protocols [57,58]. For the GSSG assay, 40 mM N-ethylmaleimide (NEM) dissolved in 10 mM sodium-phosphate buffer (pH 7.5) containing 5 mM EDTA was added to the supernatant for masking the thiol group of GSH by NEM. After mixing, TCA and NEM were removed by extracting three times with diethylether. Glutathione was determined by the DTNB [5,5′-dithiobis(2-nitrobenzoic acid)]-recycling method. An increase in absorbance at 412 nm was measured after the addition of DTNB.
4.9. Data Analysis
All experiments were conducted with three biological replicates from independent plants, with two technical replicates per plant, and results are expressed as the mean ± standard deviation (n = 3). Statistical significance was evaluated by one-way analysis of variance (ANOVA) followed by Tukey’s post hoc test for multiple comparisons, with a threshold of p < 0.05 considered significant.
The reference list from the paper itself. Each links out to its DOI / PubMed record.
- 1Melino V. Tester M. Salt-tolerant crops: Time to deliver Annu. Rev. Plant Biol.20237467169610.1146/annurev-arplant-061422-10432236854479 · doi ↗ · pubmed ↗
- 2Raza A. Zaman Q.U. Shabala S. Tester M. Munns R. Hu Z. Varshney R.K. Genomics-assisted breeding for designing salinity-smart future crops Plant Biotechnol. J.2025233119315110.1111/pbi.7010440390692 PMC 12310839 · doi ↗ · pubmed ↗
- 3Garcia-Daga S. Roy S.J. Gilliham M. Redefining the role of sodium exclusion within salt tolerance Trends Plant Sci.20253013714610.1016/j.tplants.2024.10.00239462719 · doi ↗ · pubmed ↗
- 4Tripathi J.M. Khan B.R. Gaur R. Yadav D. Verma K.K. Gupta R. Gibberellic acid improves photosynthetic electron transport and stomatal function in crops that are adversely affected by salinity exposure Plants 202514338810.3390/plants 1421338841225938 PMC 12608142 · doi ↗ · pubmed ↗
- 5Basu S. Kumar G. Regulation of nitro-oxidative homeostasis: An effective approach to enhance salinity tolerance in plants Plant Cell Rep.20244319310.1007/s 00299-024-03275-y 39008125 · doi ↗ · pubmed ↗
- 6Kazachkova Y. Eshel G. Pantha P. Cheeseman J.M. Dassanayake M. Barak S. Halophytism: What have we learnt from Arabidopsis thaliana relative model systems?Plant Physiol.201817897298810.1104/pp.18.0086330237204 PMC 6236594 · doi ↗ · pubmed ↗
- 7Li C. Duan C. Zhang H. Zhao Y. Meng Z. Zhao Y. Zhang Q. Adaptative mechanisms of halophytic Eutremasalsugineum encountering saline environment Front. Plant Sci.2022139095273583746810.3389/fpls.2022.909527 PMC 9274170 · doi ↗ · pubmed ↗
- 8Gong Q. Li P. Ma S. Indu Rupassara S. Bohnert H.J. Salinity stress adaptation competence in the extremophile Thellungiella halophila in comparison with its relative Arabidopsis thaliana Plant J.20054482683910.1111/j.1365-313X.2005.02587.x 16297073 · doi ↗ · pubmed ↗