Association of Variants in CDC10 (Septin 7) Gene with Growth-Related Traits in Qinchuan Cattle
Zixuan Cheng, Yongli Yue, Yilin Wang, Peinuo Zhou, Xinyue An, Jianyu Xu, Takahisa Yamada, Gong Cheng, Hugejiletu Bao, Linsen Zan, Bin Tong

TL;DR
This study identifies two genetic variants in the CDC10 gene that are linked to growth traits in Qinchuan cattle, offering potential markers for improving their growth rate.
Contribution
The study discovers novel SNPs in the CDC10 gene significantly associated with growth-related traits in Qinchuan cattle.
Findings
The g.61303052G>C and c.225A>G SNPs in the CDC10 gene are significantly associated with growth-related traits in Qinchuan cattle.
The c.225A>G SNP alters the secondary structure of the CDC10 protein.
High expression of the CDC10 gene is observed in Qinchuan cattle with high carcass weight.
Abstract
The growth-related traits of beef cattle are core indicators for measuring their production performance and economic value. The CDC10 (Septin 7) gene is an important component of the Septin family and is involved in various cellular life activities. In recent years, the CDC10 gene has been repeatedly mapped to quantitative trait loci (QTL) affecting growth-related traits in many cattle breeds. This study revealed that both the g.61303052G>C (ss9673029750) SNP in the promoter region and the c.225A>G (ss9673029758) SNP in exon 4 of the CDC10 gene are significantly associated with growth-related traits in Qinchuan cattle through association analysis. This research provides effective molecular markers for improving the growth rate of Qinchuan cattle. As one of the five major indigenous yellow cattle breeds in China, Qinchuan cattle are characterized by stable genetic performance and…
Genes, proteins, chemicals, diseases, species, mutations and cell lines named across the full text — each resolved to its canonical identifier and authoritative record.
Click any figure to enlarge with its caption.
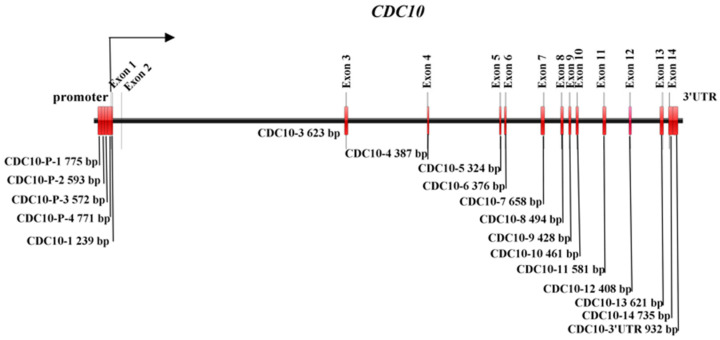 Figure 1
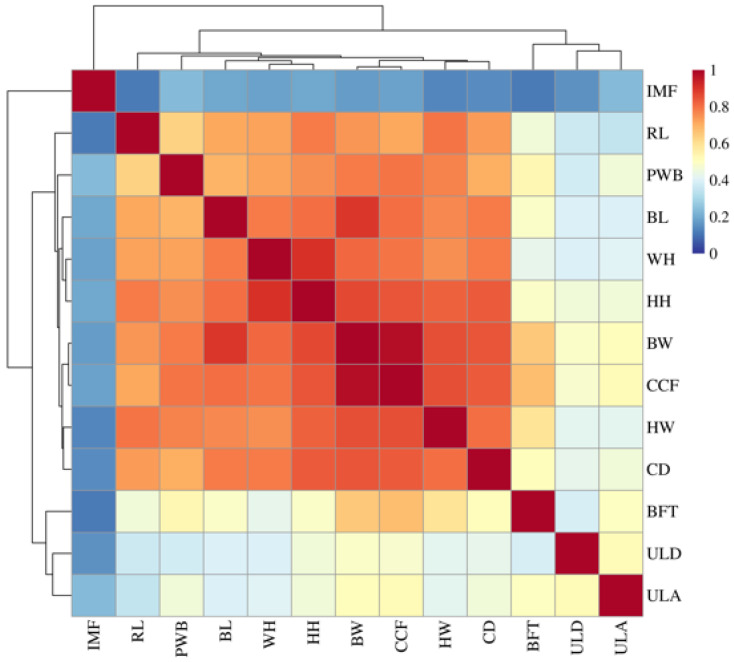 Figure 2
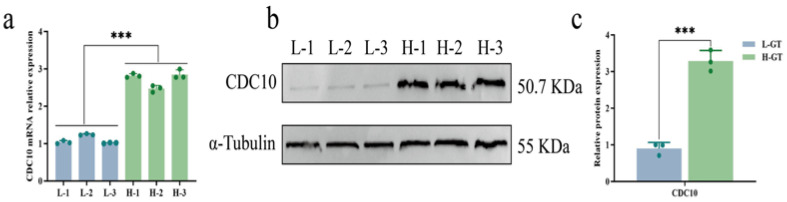 Figure 3
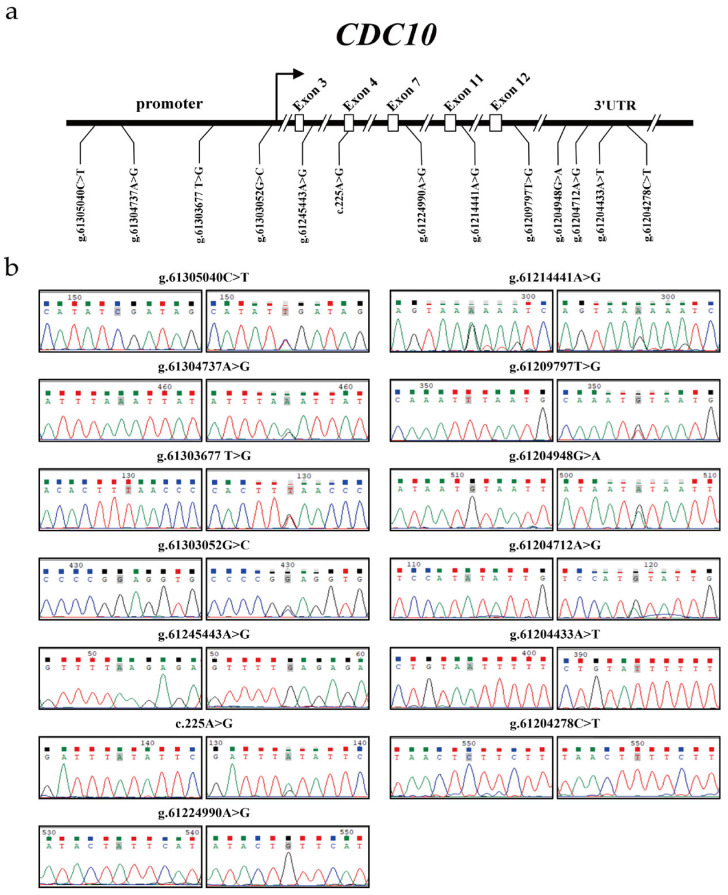 Figure 4
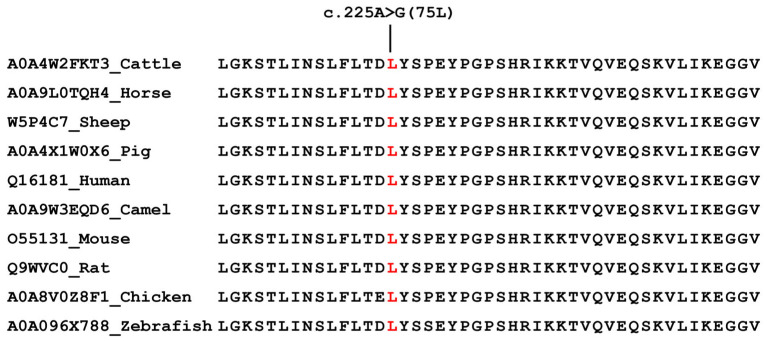 Figure 5
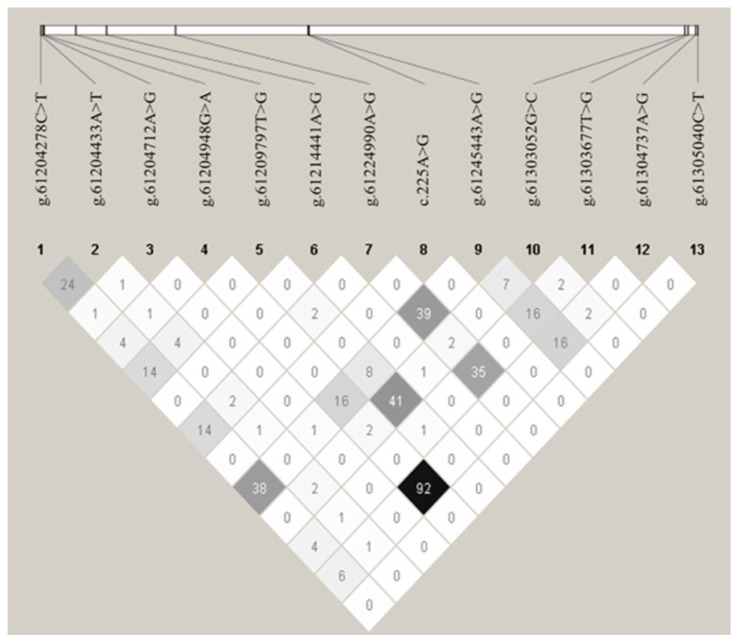 Figure 6
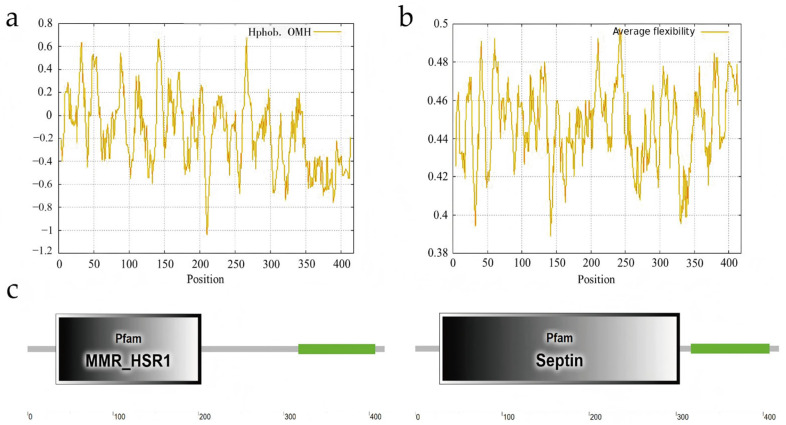 Figure 7
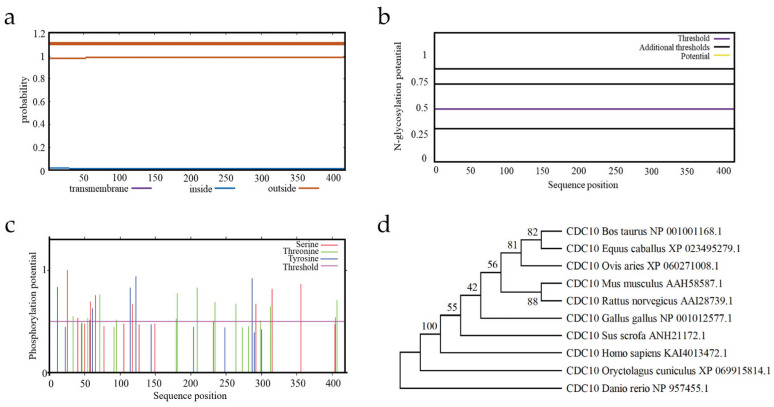 Figure 8
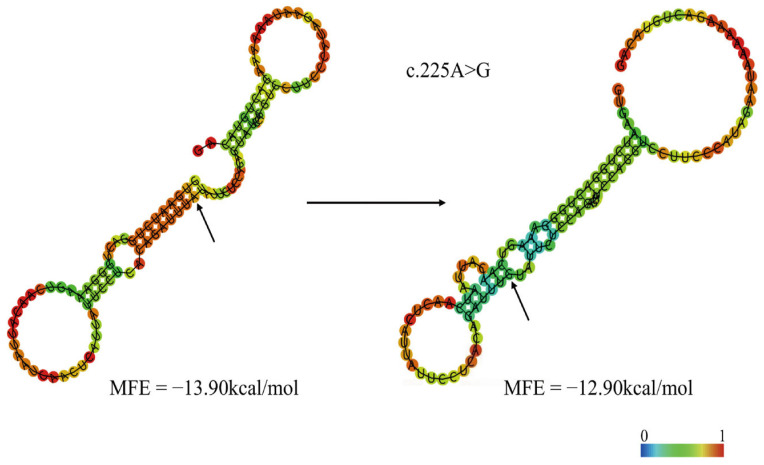 Figure 9
- —National Natural Science Foundation of China
- —State Key Laboratory for Reproductive Regulation and Breeding of Grassland Livestock of China
- —Inner Mongolia Autonomous Region Major Agricultural and Animal Husbandry Technology Collaborative Extension Program—Integrated Demonstration and Promotion of Key Technologies for Efficient Beef Cattle
- —“Grassland Talent” Scholars Program
- —High-Level Overseas Talents Project
Peer Reviews
No public reviews on file for this paper yet. If you reviewed it on a platform where reviews are public (OpenReview, ICLR, NeurIPS, ICML), you can paste yours below so the community can read it here.
Videos
No videos yet. Explain this paper in a talk, walkthrough, or lecture? Add one.
Taxonomy
TopicsFungal and yeast genetics research · Genetic Mapping and Diversity in Plants and Animals · Genetic Syndromes and Imprinting
1. Introduction
The beef cattle industry is one of the fastest-growing sectors in China’s animal husbandry sector. In recent years, China has become a key player in global beef production and consumption. As one of the five major indigenous yellow cattle breeds, Qinchuan cattle are highly valued for their tender meat, adaptability to roughage, and strong environmental resilience [1]. Their unique physical characteristics and superior meat quality make them widely popular. However, compared to introduced commercial breeds, Qinchuan cattle exhibit slower growth rates and underdeveloped hindquarters [2]. For many years, production practices have shown that crossbreeding using Qinchuan cattle as the female parent with heavy-sized cattle breeds imported from abroad, or using Qinchuan cattle as the male parent with small-sized local cattle breeds from other regions, generally yields good results [3]. Nevertheless, as time goes by, this method of improving the growth-related traits of Qinchuan cattle through interbreed crossbreeding has encountered some drawbacks, such as breed confusion and heterosis degradation.
The development of molecular marker-assisted breeding technology in beef cattle has primarily gone through three stages: molecular markers based on molecular hybridization techniques, such as restriction fragment length polymorphism (RFLP); PCR-based molecular markers, including microsatellite markers and PCR-single strand conformation polymorphism (PCR-SSCP); and sequencing-based molecular markers, represented by single nucleotide polymorphism (SNP) [4,5]. Among these, SNP is widely applied in marker-assisted breeding for beef cattle due to its abundance, extensive distribution throughout the genome, high polymorphism, and suitability for large-scale, high-efficiency screening [5]. Therefore, relying on molecular marker-assisted breeding technology to increase the growth rate of Qinchuan cattle has become a top priority for the Qinchuan cattle industry.
Growth-related traits in beef cattle are core indicators for measuring production performance and economic value, jointly regulated by polygenes, multiple loci, and environmental factors [6,7]. Previous studies have identified many genes influencing the growth-related traits of Qinchuan cattle through GWAS analysis, such as ADAMTS17, ALDH1A3, CHSY1, MAGEL2, MEF2A, SYNM, CNTNAP5, and CTNNA3 genes [8]. Nevertheless, the molecular and genetic regulatory mechanisms underlying growth-related traits in Qinchuan cattle have not yet been fully elucidated. This study focused on the cell division cycle 10 (CDC10) gene, also known as septin 7, which is a member of the Septin family involved in various cellular biological processes [9,10,11]. In a cattle study, the CDC10 gene has been consistently mapped to quantitative trait loci (QTLs) associated with growth-related traits across multiple beef cattle breeds [12,13,14,15]. Our previous studies have found that the expression levels of the CDC10 gene were higher in the skeletal muscle in Japanese Black beef cattle (JB), with high growth performance than in JB with low growth [16]. The aforementioned findings suggest that the CDC10 gene could be considered as a strong candidate gene for growth-related traits in beef cattle. Nevertheless, the association between the CDC10 gene and growth-related traits in Qinchuan cattle remains unclear. In this study, Western blot was used to compare the differential expression of CDC10 protein between Qinchuan cattle with high and low growth performance for carcass weight. Subsequently, five individuals each of Chinese Simmental cattle, Mongolia cattle, Luxi cattle, and Qinchuan cattle were selected for direct sequencing to identify mutation in the CDC10 gene of indigenous Chinese yellow cattle. MassARRAY technology was then employed to genotype 367 Qinchuan cattle, followed by genetic diversity analysis and association analysis with growth-related traits. Finally, physicochemical properties and protein secondary structure were analyzed for the SNP located in the exon. This study aimed to identify mutations in the CDC10 gene and perform an association study with growth-related traits in Qinchuan cattle breed, thereby providing reliable molecular markers for improving the growth rate of Qinchuan cattle and offering effective scientific insights for the development of the Qinchuan cattle breeding industry.
2. Materials and Methods
2.1. Animals
The DNA samples of 367 clinically healthy and non-pregnant Qinchuan adult females (aged 24 to 30 months, and unrelated for at least three generations) were provided from the National Beef Cattle Improvement Center, Northwest A&F University [17]. Animals were chosen at random from the National Beef Cattle Improvement Center herd (Xianyang, China). All cattle were fed the same total mixed ration with a roughage to concentrate ratio of 3:2. Specifically, the roughage fraction of the diet was composed primarily of corn silage (accounting for 55% of the total diet) and wheat straw (5% of the total diet), while the concentrate fraction consisted of corn (23%), soybean meal (7.5%), wheat bran (4.5%), sodium chloride (1%), ammonium hydrogen phosphate (1%), and a commercial premix (3%). This TMR formulation provided 12.08% crude protein, alongside 32.85% neutral detergent fiber, 18.71% acid detergent fiber, and 3.66% ether extract. The cattle herd was managed under standardized conditions at the National Beef Cattle Improvement Center, Northwest A&F University, which is located in a region characterized by a semi-humid and semi-arid climate with an annual average temperature of 15.1 °C. The feeding was offered based on NRC standards [18]. Body weight (BW) was regarded as an important growth trait, and body measurement traits including body length (BL), wither height (WH), hip height (HH), rump length (RL), hip width (HW), chest depth (CD), chest circumference (CCF), and pin bone width (PWB) were measured using a measuring tape, measuring stick, and sliding caliper [19]. The longissimus dorsi meat quality traits including loin muscle depth (ULD), loin muscle area (ULA), intramuscular fat (IMF), and back fat thickness (BFT) were estimated using ultrasound technology (Sono-grader ultrasound machine, Renco, Boca Raton, FL, USA) [20]. The phenotypic traits were measured through ultrasonography, because ultrasound measurement predicts meat quality traits in live animals in a nondestructive manner. The ultrasonic probe was placed in the area between the 12th and 13th ribs [21,22]. The genomic DNA of 367 Qinchuan cattle were extracted according to the standard phenol chloroform protocol [23]. The quality and quantity of the extracted DNA were evaluated using a Nanodrop^®^ spectrophotometer (ensure that the A260/A280 ratio is within the range of 1.8–2.0 and the A260/A230 ratio is greater than 2) (Thermo Fisher Scientific, Waltham, MA, USA) and by agarose gel electrophoresis (a distinct high-molecular-weight main band was observed with no obvious degradation).
2.2. CDC10 Sequencing and Variant Detection
Twenty cattle (including five Chinese Simmental (CS), five Qinchuan cattle, five LX cattle and five IM cattle) were used to detect variants in the CDC10 gene. Bovine specific PCR primers were designed using Primer 5.0 software (Premier Biosoft International, Palo Alto), according to the bovine CDC10 DNA sequence (NCBI reference sequence: NC_037331.1) (Figure 1 and Table 1). PCR amplifications were performed with 2 μL of the prepared DNA as a template in a final volume of 50 μL containing 1 μM of each primer, 25 μL of Ex Taq DNA polymerase (Takara, Kusatsu, Japan), and 21 μL of ddH_2_O. The PCR conditions were as follows: 94 °C for 5 min, 35 cycles of 94 °C for 30 s, annealing for 30 s, 72 °C for 1 min 10 s and a final extension step at 72 °C for 10 min. The annealing temperatures for each fragment are shown in Table 1. The PCR products were analyzed by 1.0% agarose gel electrophoresis to determine DNA sequencing quality and quantity. The products were sequenced by the Beijing Genomics Institute (Beijing, China).
2.3. SNP Genotyping by iPLEX MassARRAY
The 13 variants were genotyped with the MassARRAY^®^ SNP genotyping system (Agena Bioscience, San Diego, CA, USA) in the 367 Qinchuan populations. PCR and extension primers were designed from sequences containing each target mutation and ~100 upstream and downstream bases with Assay Design Suite (Table 2) (http://agenabio.com/assay-design-suite-20-software, accessed on 20 August 2025), using the default settings. The genotype of each SNP was analyzed using the Sequenom MassARRAY iPLEX platform (Sequenom, San Diego, CA, USA) [24]. The resulting data were analyzed using the MassARRAY Typer 4.0 Analyzer software (Agena Bioscience, San Diego, CA, USA).
2.4. Western Blot
To compare the differential expression of the CDC10 protein, we selected three individuals with the highest body weight and three with the lowest body weight (all six Qinchuan cattle were 28 months females) from a population of 367 Qinchuan cattle and performed using biopsy to collect samples of the longissimus thoracis muscle at the 12–13th ribs for subsequent analysis. The longissimus thoracis muscle samples from Qinchuan cattle were rapidly frozen in liquid nitrogen, pulverized into powder, and lysed in radioimmunoprecipitation assay (RIPA) buffer (Beyotime, Shanghai, China) supplemented with phenylmethylsulfonyl fluoride (PMSF). Total protein was separated by SDS-PAGE and transferred to nitrocellulose (NC) membranes (Pall Corporation, East Hills, NY, USA). Membranes were blocked with 5% skim milk for 2 h at room temperature, incubated with primary antibodies overnight at 4 °C, and then with secondary antibodies for 1 h at room temperature. Protein bands were visualized using chemiluminescent reagents (Thermo, Waltham, MA, USA). Band intensities were quantified with ImageJ (https://imagej.net/ij/, accessed on 29 September 2025). The primary antibodies used were CDC10 (1:1000, Abcam, Cambridge, UK) and α-Tubulin (1:1000, Proteintech, Rosemont, IL, USA); α-Tubulin served as the loading control. The secondary antibodies were anti-rabbit (1:10,000, Proteintech) and anti-mouse (1:10,000, Proteintech). Target proteins were detected with the Tanon-5200 imaging system (Tanon, Shanghai, China) according to the manufacturer’s instructions.
2.5. Quantitative Real-Time PCR
This experiment utilized the RNeasy^®^ Mini Kit (Qiagen, Düsseldorf, Germany) to isolate the total RNA from samples of the above-mentioned longissimus thoracis muscle, followed by cDNA synthesis using the reverse transcription kit (Takara, Kusatsu, Japan). After assessing RNA purity and concentration by spectrophotometry using a NanoDrop 2000 (Wilmington, NC, USA) and 1% agarose gel electrophoresis, quantitative real-time PCR (RT-PCR) was performed using TB Green^®^ Premix Ex Taq™ (Tli RNaseH Plus) (Takara) and specific primers (CDC10-F: 5′-TGTTTATACTTCATTGCTCCT-3′, CDC10-R: 5′-TTAAACTGTTGGCATTCCTC-3′) on a Bio-Rad system (Bio-Rad, Hercules, CA, USA). Each experimental group was repeated at least three times. The 2^−ΔΔCt^ method was employed to calculate and analyze statistically significant differences in gene expression based on Ct values. GAPDH was used as the internal controls.
2.6. Statistical Analysis
Genotypic, allelic frequencies and Hardy–Weinberg equilibria were calculated for Qinchuan breed. Population genetic indices, observed heterozygosity (H_o_), expected heterozygosity (H_e_), effective allele numbers (n_e_), and polymorphism information content (PIC) were calculated according to Nei’s method [25]. Allelic frequencies of the 13 variants were compared by an χ^2^ test. The linkage disequilibrium (LD), including D’ and r^2^, was assessed with HAPLOVIEW v. 4.2 (https://haploview.software.informer.com/#google_vignette, accessed on 2 October 2025) [26]. Haplotypes were obtained using SHEsis [27]. The bioinformatic tools and online resources used in this study for the sequence analysis and prediction are summarized in Table S1. The relationships between 13 traits and different genotypes in Qinchuan were analyzed in SPSS 24.0 (SPSS, Inc., Chicago, IL, USA). The statistical linear model for these analyses was consistent with our previous report [17] Y_ij_ = μ + G_i_ + A_j_ + e_ij_, where Y_ij_ means trait value per individual, μ means overall population mean per trait, G_i_ means fixed effect associated with genotype, A_j_ means fixed effect of age, and e_ij_ represents random error. When the number of cattle with a given genotype was less than ten, their correlations and effects could not be reliably estimated. Therefore, animals with this genotype were excluded from the analysis. The Bonferroni correction was used to adjust p values [17]. All charts were created using GraphPad Prism 7.0 (https://www.graphpad.com/, accessed on 3 October 2025) and the data represented the mean ± SEM. The significance of differences between the groups was assessed using the Student’s t test (*, p < 0.05; **, p < 0.01 ***, p < 0.001).
3. Results
3.1. Description of the Correlations Among the 13 Growth-Related Traits in Qinchuan Cattle
In breeding programs, it is essential to consider the correlations among multiple traits. Therefore, this study analyzed the correlations among 13 growth-related traits of Qinchuan cattle using a heatmap. The results showed strong correlations among the growth-related traits BW, WH, HH, RL, HW, CD, CCF, and PWB, forming a distinct reddish-orange block in the heatmap (Figure 2). This suggests that these growth-related traits in Qinchuan cattle can mutually influence one another. The specific data for the 13 growth-related traits are presented in Table S2, while the association coefficients and corresponding p-values for each trait are provided in Table S3.
3.2. Differential CDC10 Expression Between High and Low Growth Performance for Carcass Weight
RT-PCR and Western blot analysis revealed that CDC10 expression was significantly higher in the H-GT group than in the L-GT group (p < 0.001, Figure 3).
3.3. Detection of CDC10 Genetic Variants
Twenty cattle (including five CS, five Qinchuan cattle, five LX cattle and five IM cattle) were used to detect novel variants in the CDC10 gene. The sequence analysis revealed 13 variants in the CDC10 gene. Among them, the known g.61303052G>C (ss9673029750) variant was detected in the promoter region of CDC10 in Chinese cattle breeds. The novel g.61304737A>G (ss9673029668), g.61305040C>T (ss967302973), and g.61303677T>G (ss9673029652) variants were found in the promoter region of CDC10. The novel g.61245443A>G (ss9673029723), c.225A>G (ss9673029758), g.61224990A>G (ss9673029704), g.61214441A>G (ss9673029743), and g.61209797T>G (ss9673029716) variants were found in intron 3, exon 4, intron 7, intron 11, and intron 12 of CDC10, respectively. Meanwhile, the g.61204948G>A (ss9673029718), g.61204712A>G (ss9673029657), g.61204433A>T (ss9673029479), and g.61204278C>T (ss9673029726) variants were found in the 3′UTR region of CDC10 (Figure 4) (the variant data for this study have been deposited in the European Variation Archive (EVA) at EMBL-EBI under accession number PRJEB57636 (https://www.ebi.ac.uk/eva/?eva-study=PRJEB57636, on 20 September 2025).
The c.225A>G mutation in exon 4 of CDC10 caused silent mutation at the 75 (leucine) position in the amino acid sequence of the CDC10 protein. Leucine at residue 75 in CDC10 is highly conserved across vertebrates from zebrafish and chicken to mammals (Figure 5).
3.4. Genetic Diversity of CDC10 Variants
For the 13 variants detected in this study, the frequencies of the two alleles and the three genotypes of each SNP in the Qinchuan cattle are listed in Table S4, as are the genetic indices (H_o_, H_e_, n_e_ and PIC). The PIC values of the g.61304737A>G, g.61303677T>G, c.225A>G, g.61224990A>G, g.61204948G>A, g.61204712A>G, and g.61204433A>T variants were low, while g.61303052G>C, g.61245443A>G, g.61209797T>G, and g.61204278C>T were moderate (high, PIC > 0.5; moderate, 0.25 < PIC < 0.5; low, PIC < 0.25) [28] in the Qinchuan cattle population (Table S4).
3.5. Linkage Disequilibrium Among CDC10 Variants
To determine the linkage relationships among the 13 polymorphisms, D’ and r^2^ were estimated for all 367 Qinchuan cattle (Table S5). The r^2^ values indicated that the g.61204948G>A and g.61304737A>G SNPs were in nearly complete LD in the experimental Qinchuan cattle population (r^2^ = 0.926) (Figure 6), as r^2^ > 0.33 indicates LD [29]. Thus, the LD group was collectively analyzed and designated as the single locus, denoted as LD-Q. Table S5 presents the D’ and r^2^ of the experimental Qinchuan cattle population.
3.6. Associations of CDC10 Variants with Growth-Related Traits in Qinchuan Cattle
When the number of cattle with a given genotype was less than ten, their associations and effects could not be reliably estimated. Therefore, animals with this genotype were excluded from the analysis. For g.61303677T>G, the ULD of Qinchuan cattle with the GT genotype was significantly higher than those of individuals with the TT genotype (p < 0.05; Table 3). For g.61303052G>C, the CCF and ULA of Qinchuan cattle with the GG genotype were highly significantly lower than those of Qinchuan cattle with the GC genotype (p < 0.01) and significantly lower than those of Qinchuan cattle with the CC genotype (p < 0.05). The BW, HW, and PWB of Qinchuan cattle with the GG genotype were significantly lower than those of Qinchuan cattle with the GC and CC genotypes (p < 0.05, respectively). The HH and BFT of Qinchuan cattle with the GG genotype were significantly lower than those of individuals with the GC genotype (p < 0.05). Meanwhile, the BFT of Qinchuan cattle with the GG genotype was highly significantly lower than that of individuals with the CC genotype (p < 0.01; Table 3). For the c.225A>G, the BW, CCF, ULD, and ULA of Qinchuan cattle with the GA genotype were significantly higher than those of individuals with the AA genotype (p < 0.05, respectively; Table 3). For g.61209797T>G, compared with the GG genotype, individuals with the GT genotype had significantly higher ULD (p < 0.05; Table 3). For g.61204433A>T, the ULA of Qinchuan cattle with the AT genotype were significantly higher than that of those with the TT genotype (p < 0.05; Table 3). Table 3 and Table S6 respectively present the mutations that remained significantly associated with, and those not significantly associated with, growth-related traits after Bonferroni correction.
To further analyze the associations of traits between haplotypes of CDC10, different haplotypes were constructed in the experimental population of Qinchuan cattle using the online tool SHEsis (Table S7). A haplotype with a frequency of >3% was considered a distinguishable haplotype, while haplotypes with a relative frequency of <3% were pooled into a single group. The results showed that there were no significant differences in 13 traits between CDC10 haplotypes in Qinchuan cattle (Table S8).
3.7. Bioinformatics Characterization of Bovine CDC10
3.7.1. Feature and Structure Prediction of the Bovine CDC10 Protein
Hydrophobicity analysis [30] of the bovine CDC10 protein indicated that the maximum hydrophobicity value was 0.677 at 266 aa and that the minimum was −1.041 at 211 aa (Figure 7a). The maximum and minimum average flexibility index values of bovine CDC10 were 0.498 for the 242 aa position and 0.389 for the 142 aa position (Figure 7b). Then, SMART was used to predict the conserved domain. The prediction revealed a Septin-type guanine nucleotide-binding (G) domain at 28–304, a Homogeneously Staining Region at 33–203, and a low complexity region at 317–407 (Figure 7c). The silent mutation c.225A>G (75L) is located in the Septin-type guanine nucleotide-binding (G) domain and Homogeneously Staining Region of CDC10, both of which are critical for the biological function of the CDC10 protein. Therefore, the mutation should be considered more important than the other mutations found in this study.
3.7.2. Amino Acid Sequence Analysis of Bovine CDC10
ProtParam was used to predict the physicochemical properties of amino acid sequences. The molecular weight and isoelectric point of bovine CDC10 were 48,757.89 Da and 8.76, respectively. The amino acid composition of the CDC10 protein showed that the highest proportion of the CDC10 protein was 11.0% for lysine and that the lowest was 0.7% for tryptophan.
Because of the protein function and its physical and chemical environment in vivo, TMHMM was used to predict the subcellular localization. The protein has no transmembrane helix position on CDC10 (Figure 8a). Furthermore, no N-glycosylation sites were identified, while 27 phosphorylation sites (comprising 12 threonines, nine serines and six tyrosines) were predicted (Figure 8b,c).
3.7.3. Multiple Sequence Alignment and Phylogenetic Analysis
Amino acid sequences of CDC10 from a range of model and domesticated animals were selected to construct a phylogenetic tree. The tree was built using the Neighbor-Joining method in MEGA 12.1 software with 1000 bootstrap replications. The tree shows that CDC10 sequences from certain laboratory mammals (e.g., mouse and rat) form a distinct cluster, separate from the branches containing zebrafish and rabbit (Figure 8d).
3.7.4. Predicted Effects of Variants on CDC10 mRNA Secondary Structure
Using the minimum free energy (MFE) based RNAfold platform analysis, the results can show a difference in the secondary structure of the point mutation [31]. The MFE of the exonic mRNA sequence with the A allele at the c.225A>G site was −13.90 kcal/mol, while the MFE with the G allele was −12.90 kcal/mol (Figure 9). In addition, the c.225A>G mutation also caused visible changes in the mRNA secondary structure of CDC10 (Figure 9).
4. Discussion
In mouse models, knockout of CDC10 results in embryonic lethality [32]. In recent years, the CDC10 gene has been repeatedly mapped to quantitative trait loci (QTL) affecting growth-related traits in beef cattle [12,13,14,15]. Furthermore, our previous studies found that the expression levels of the CDC10 gene were higher in the skeletal muscle in Japanese Black beef cattle (JB) with high growth performance than in JB with low growth [16]. This suggests that the CDC10 gene may be involved in the growth and development of bovine skeletal muscle. In this study, we initially randomly selected 3 Qinchuan cattle with low growth performance for carcass weight and 3 with high growth performance for carcass weight. Using RT-PCR and Western blot analysis to detect CDC10 expression, the results showed that the mRNA and protein expression levels of CDC10 was significantly higher in Qinchuan cattle with high growth performance for carcass weight compared to those with low growth performance for carcass weight. This finding is consistent with previous observations in JB cattle, where individuals with heavier carcasses also exhibited higher CDC10 gene expression [16]. Moreover, association analysis with growth-related traits in Qinchuan cattle revealed that the g.61303052G>C SNP in the promoter region and the c.225A>G SNP in the exon region of the CDC10 gene were significantly associated with multiple growth-related traits. This study has thereby identified potential molecular markers for Qinchuan cattle breeding. These two SNPs can serve as functional molecular markers for the future establishment of an efficient marker-assisted selection system targeting growth-related traits for this breed.
To investigate the association between the CDC10 gene and growth-related traits in Qinchuan cattle, this study employed direct sequencing and MassARRAY technology to identify SNPs within the promoter, exons, introns, and 3′UTR regions of CDC10. Association analysis was then performed to identify SNPs significantly associated with growth-related traits in Qinchuan cattle. The results revealed the presence of the g.61303052G>C (ss9673029750) SNP in the promoter region of CDC10. This SNP was initially discovered in our previous study on Japanese Black cattle, where the C allele was shown to be significantly associated with growth-related traits [16]. In the current association analysis of the g.61303052G>C SNP with growth-related traits in Qinchuan cattle, we found that the C allele was significantly associated with multiple key growth metrics, including body weight, hip height, chest circumference, pin bone width, back fat thickness, loin muscle depth and loin muscle area. Therefore, this study confirms that the association between the g.61303052G>C SNP in the CDC10 promoter region and growth-related traits is universal. The g.61303052G>C SNP can serve as a valuable molecular marker for subsequent breeding research.
Additionally, this study identified a c.225A>G (ss9673029758) SNP in exon 4 of the CDC10 gene that was significantly associated with growth-related traits such as body weight, chest circumference, loin muscle depth and loin muscle area. We analyzed the amino acid change caused by this mutation and found that it resulted in the same amino acid, leucine, indicating that the c.225A>G SNP is a synonymous mutation. Nevertheless, numerous studies have shown that although synonymous mutations do not alter the amino acid sequence, they can influence mRNA expression, splicing, stability [33,34,35], secondary structure [36,37], protein translation [38] and folding, as well as protein function [39]. Research has found that mRNAs rich in optimal codons are more stable, while those rich in non-optimal codons tend to be cleared due to low translation efficiency. This provides one of the strongest pieces of evidence that synonymous mutations can affect mRNA stability by altering codon optimality [40]. Another study also indicates that the C957T synonymous mutation alters the predicted mRNA folding, leading to reduced mRNA stability and translation, and significantly impairs dopamine-induced upregulation of DRD2 expression [33]. Our analysis revealed that the minimum free energy (MFE) increased from −13.90 kcal/mol to −12.90 kcal/mol due to the c.225A>G mutation, suggesting a rise in free energy state and potential destabilization of the mRNA secondary structure. Since a lower MFE value generally indicates a more stable RNA conformation, this change implies a potential destabilizing effect on mRNA folding [36,37]. Furthermore, research has shown that the stability of mRNA secondary structure and the associated translation initiation rate play a dominant role in influencing gene expression levels. Therefore, the findings of this study indicate that the synonymous c.225A>G SNP may affect gene expression by altering the mRNA stability of the CDC10 gene [41,42]. However, since the number of mutant samples for the c.225A>G was at the critical threshold for statistical analysis (n = 10), the results of this hypothesis are inevitably subject to certain limitations. In subsequent research, we will expand the sample size to re-examine and further analyze this locus.
In conclusion, this study demonstrated that the protein expression level of CDC10 in Qinchuan cattle with high growth performance for carcass weight was significantly higher than that in Qinchuan cattle with low growth performance for carcass weight. Association analysis revealed that the g.61303052G>C (ss9673029750) SNP in the promoter region, the c.225A>G (ss9673029758) SNP in exon 4, the g.61209797T>G (ss9673029716) SNP in intron 3, and the g.61204433A>T (ss9673029479) SNP in the 3′ UTR region of the CDC10 gene were all significantly associated with the growth-related traits of Qinchuan cattle. Among these, the g.61303052G>C SNP was found to be significantly associated with multiple growth-related traits across various beef cattle breeds, while the c.225A>G SNP, although not causing an amino acid change, may still alter the secondary structure of CDC10 mRNA. Therefore, the g.61303052G>C and c.225A>G SNPs will be key focuses for subsequent breeding research. In particular, how the g.61303052G>C SNP affecting the promoter activity of the CDC10 gene will be experimentally verified through dual-luciferase reporter assays in future study. This study identified molecular markers of the CDC10 gene associated with growth-related traits in Qinchuan cattle, providing valuable scientific insights and molecular markers for breeding improvements related to growth and development in Qinchuan cattle, as well as reliable theoretical support for the development of the beef cattle industry.
5. Conclusions
This study revealed that the expression of the CDC10 gene was significantly higher at both the mRNA and protein levels in Qinchuan cattle with high growth performance for carcass weight compared to those with low growth performance for carcass weight. A promoter mutation (g.61303052G>C) in the CDC10 gene was significantly associated with growth-related traits including BW, HH, HW, CCF, PWB, BFT and ULA, while an exonic SNP (c.225A>G) showed significant associations with BW, CCF, ULD and ULA traits. Furthermore, the c.225A>G SNP was found to alter the secondary structure of the CDC10 protein. These findings provide reliable molecular markers for improving the growth rate of Qinchuan cattle and establish a solid theoretical foundation for the beef cattle industry. In subsequent research, we will expand the sample size and conduct additional analyses on growth-related trait associated SNPs in Qinchuan cattle.
The reference list from the paper itself. Each links out to its DOI / PubMed record.
- 1Zhang Y. Guo X.X. Liu W. Jia Y.H. Preservation and Utilization of Qinchuan Cattle Breed Resources J. Yellow Cattle Sci.200463640
- 2Adoligbe C. Zan L. Farougou S. Wang H. Ujjan J.A. Bovine GDF 10 gene polymorphism analysis and its association with body measurement traits in Chinese indigenous cattle Mol. Biol. Rep.2012394067407510.1007/s 11033-011-1188-121805344 PMC 3294207 · doi ↗ · pubmed ↗
- 3National Livestock and Poultry Genetic Resources Committee Chinese Livestock and Poultry Genetic Resources—Cattle 1st ed.China Agriculture Press Beijing, China 2011810
- 4Yan H.C. Gao L. Li G.L. Development and application of molecular marker technology Bull. Biol.2006411719
- 5Tang L.Q. Xiao C.L. Wang W.P. Research and application progress of SNP molecular markers Chin. Agric. Sci. Bull.201228154158
- 6Boukha A. Bonfatti V. Cecchinato A. Albera A. Gallo L. Carnier P. Bittante G. Genetic parameters of carcass and meat quality traits of double muscled Piemontese cattle Meat Sci.201189849010.1016/j.meatsci.2011.03.02421546169 · doi ↗ · pubmed ↗
- 7Gao Y. Zhang R. Hu X. Li N. Application of genomic technologies to the improvement of meat quality of farm animals Meat Sci.200777364510.1016/j.meatsci.2007.03.02622061394 · doi ↗ · pubmed ↗
- 8Yu H. Yu S. Guo J. Cheng G. Mei C. Zan L. Genome-Wide Association Study Reveals Novel Loci Associated with Body Conformation Traits in Qinchuan Cattle Animals 202313362810.3390/ani 1323362838066979 PMC 10705519 · doi ↗ · pubmed ↗