The Influence of the Site of Recording and Benchtop and Portable NIRS Equipment on Predicting the Sensory Properties of Iberian Ham
Isabel Revilla, Ana María Vivar-Quintana, Iván Martínez-Martín, Pedro Hernández-Ramos, Miriam Hernández-Jiménez, Justyna Grabska, Krzysztof B. Beć, Christian W. Huck

TL;DR
This study compares different near-infrared spectroscopy devices and recording sites for predicting sensory properties of Iberian ham.
Contribution
The study demonstrates that portable NIRS devices can effectively predict sensory properties of Iberian ham.
Findings
The NIRFlex N-500 and MicroPhazir devices showed the best performance in predicting sensory parameters.
Portable devices like MicroNIR predicted 25 parameters across all recording sites.
The choice of recording site significantly affects the number and type of sensory parameters predicted.
Abstract
Iberian ham is a Spanish product that is highly prized for its unique sensory characteristics. The possibility of predicting these characteristics using non-invasive methods is therefore of great interest. In this context, this study compares the performance of two benchtop and four portable devices in addition to the influence of recording factors (lean meat, fat, and whole slices) for the prediction of sensory parameters. A total of 28 descriptors were determined by a trained panel for 60 samples (100% Iberian and Iberian), and the sensory profile was predicted by using a feedforward multilayer perceptron artificial neural network. A significant effect of the breed on the sensory profile and the spectral characteristics was observed, especially in the case of fat. On the other hand, the NIRFlex N-500 (desktop) and MicroPhazir (portable) devices gave the best performances, with 27…
Click any figure to enlarge with its caption.
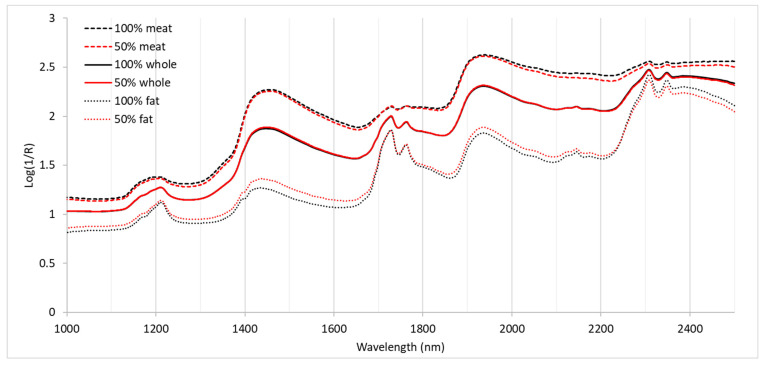 Figure 1
- —Diputación de Salamanca
Peer Reviews
No public reviews on file for this paper yet. If you reviewed it on a platform where reviews are public (OpenReview, ICLR, NeurIPS, ICML), you can paste yours below so the community can read it here.
Videos
No videos yet. Explain this paper in a talk, walkthrough, or lecture? Add one.
Taxonomy
TopicsMeat and Animal Product Quality · Spectroscopy and Chemometric Analyses · Sensory Analysis and Statistical Methods
1. Introduction
Iberian ham is a pork product that is not only highly appreciated by Spanish consumers but is also one of the most recognized Spanish products in the world; it is marketed in Europe, Japan, and the United States [1]. One of the reasons why it is in such high demand is the sensory quality of this product, which depends on several factors, such as genetics, breeding systems, and especially the feed provided [2], with 100% acorn-fed Iberian ham being the most prized for its aroma, texture, and flavor [3]. Iberian ham is characterized by the intense red color of its lean meat with a large amount of white intramuscular fat (marbling). In addition, its low fiber content, high juiciness, and soft, fluid fat as texture attributes, together with a high intensity of flavor owing to its cured taste with hints of sweetness, are the main characteristics that influence the acceptability of cured ham [4]. There is, therefore, a complete set of sensory attributes that sensory panels analyze when performing quantitative descriptive analysis (QDA), the most widely used descriptive method, to evaluate quality and to differentiate cured Iberian hams [5,6,7,8,9]. However, the implementation of QDA involves the selection, training, and qualification of evaluators in accordance with recognized standards [10,11,12], and also the validation of the panel to ensure its correct functioning over time [6,13]. Consequently, this method is tedious and time-consuming, in addition to requiring the destruction of the sample and a panel of assessors undergoing continuous training. However, the data obtained are not only reliable but also provide a significant amount of complementary information, which is easy to interpret [14].
As a result of all this, it is of great interest to replace the sensory analysis by non-destructive techniques such as near-infrared spectroscopy, which has advantages such as being quick and non-contaminant, and also offers the possibility of implementation on-line/in-line or at-line [15]. NIR spectroscopy has been used to predict sensory properties in different matrices, as reviewed by Chapman et al. [16]. With regard to meat and meat products, much more attention has been paid to fresh meat than to meat products [17], although some recent studies point to the feasibility of predicting the sensory properties of dry-cured products [18,19,20], including the texture and color or defects of cured ham [21,22] or even the complete QDA profile [8]. Portable devices are available that differ in technical solutions regarding the light source, the detectors, and the wavelength selectors. The light source of handheld NIR spectrometers is therefore based on tungsten-halogen lamps in analogy to benchtop instruments, but light-emitting diodes (LEDs) are also used (SCiO, Consumer Physics, Tel Aviv, Israel) due to their robustness, low price, and low power consumption. As far as detectors are concerned, array detectors (MicroNIR1700, VIAVI Solutions Inc., Milpitas, CA, USA) and single-detector devices (Enterprise Sensor NIR, TellSpec, Toronto, ON, Canada) can be found in portable NIR equipment. Indium gallium arsenide (InGaAs) is the preferred material for manufacturing detectors and has replaced lead salt detectors PbSe and PbS (Foss NIRSystem 5000, Foss NIRSystems, Silver Spring, MD, USA), although complementary metal–oxide–semiconductor (CMOS) technology has been gaining ground steadily, as this requires less power consumption (SCiO Consumer Physics, Tel Aviv, Israel). As for wavelength selectors, the equipment can currently be divided into the following: Linear-variable filter instruments with array detectors (trinamiX GmbH, Ludwigshafen, Germany; VIAVI Solutions Inc., CA, USA), MEMS-based FT-NIR instruments (Si-Ware Systems, Cairo, Egypt; Hamamatsu Photonics, Hamamatsu City, Japan), MEMS Hadamard masks (microPHAZIR, Thermo Fisher Scientific, Waltham, MA, USA), micro-mirror devices (DMD™) (Texas Instruments, Dallas, TX, USA; Innospectra Corp., Xinzhu, Taiwan, China), MEMS Fabry–Perot interferometers (Nirone Sensor S, Spectral Engines, Helsinki, Finland), NIR grating micro-spectrometers, (Insion GmbH, Obersulm, Germany; OrO Photonics, Xinzhu, Taiwan, China), and NIR scanners with 16 solar cell detectors (Senorics GmbH, Dresden, Germany) [23,24].
This diversity of technological solutions leads to different operational wavelength regions, spectral resolutions, and signal-to-noise ratios [23], which may affect the analytical performance or applicability to a specific matrix. However, in recent years, studies have shown that similar results can be obtained with benchtop and handheld devices for both quantitative and qualitative applications [25,26,27]. The performance of the handheld devices against the benchtop instruments should therefore be tested for each application, as they can be considered a reference for evaluating the analytical performance of portable spectrometers.
In this context, the objective of this study was to investigate the feasibility of predicting the sensory parameters of Iberian ham using different benchtop devices—Foss NIRSystem 5000 (Foss NIRSystems, Silver Spring, MD, USA) and BüchiNIRFlex N-500 (Büchi, Flawil, Switzerland)—and portable equipment—microPHAZIR (Thermo Fischer Scientific, USA); MicroNirProEs (VIAVI solutions, USA); SCiO (Consumer Physics, Israel); and Enterprise Sensor NIR (TellSpec, UK)—as they encompass a wide range of technological solutions, including different light sources, wavelength selectors, detectors, resolutions, and spectral intervals. On the other hand, the influence of recording factors (fat, lean meat, or whole slices) in order to determine the most appropriate methodology for determining the sensory profile easily and accurately was also studied. Achieving this objective will allow the use of NIRS handheld devices for sensory analysis to be implemented routinely in the meat sector.
2. Materials and Methods
2.1. Materials
A total of 60 samples of Iberian ham were selected, with 24 samples from the 100% Iberian acorn-fed category and 36 samples from the Iberian (Iberian x Duroc) acorn-fed category. All animals were raised in the same geographical area according to certificate RD 10/2014 [28], as previously described by Hernández-Jiménez et al. [27]. One hundred grams of 1 mm-thick ham slices (including Biceps femoris, Semimembranosus, and Semitendinosus muscles) were analyzed when taken perpendicularly to the bone at the same depth from the front of the hams.
2.2. Sensory Analysis
The sensory analysis of the samples was carried out according to the methodology described previously by Hernández-Ramos et al. [8] using a sensory panel of 10 members who had been trained in quantitative descriptive analysis (QDA) of cured ham. The assessors gave their written consent to participate before the start of the test. Ethical approval was obtained from the Ethics Committee of the University of Salamanca (registration number 1298). Prior to the analysis, the panel received training during six sessions using reference products and dummy samples. At the end of each session, the director provided feedback on performance using statistical descriptors. After the training phase, repeatability and reproducibility were calculated [29] by analyzing the same sample three times in three different sessions in order to evaluate the accuracy of the panel.
A total of 28 parameters were analyzed, including the visual, flavor, and texture properties of the samples (Supplementary Material, Table S1). A structured scoring scale was used, ranging from 1, low intensity, or the presence of the parameter evaluated, to 9, high intensity, or the presence of the parameter evaluated. The 60 samples, tempered to 20 ± 2 °C and coded, were presented and tasted individually during 15 sessions (4 samples per session).
2.3. Near-Infrared Spectroscopy Analysis
Prior to recording, the ham packages were tempered for two hours until the samples reached a temperature of 20 ± 2 °C. Four slices were separated from each package and placed on top of each other, facing in the same direction.
All samples were analyzed using two types of benchtop equipment, Foss NIRSystem 5000 (Foss NIRSystems, Silver Spring, MD, USA) and BüchiNIRFlex N-500 (Büchi, Flawil, Switzerland), and four portable devices: MicroNIR 1700 ES (VIAVI, Milpitas, CA, USA); Enterprise Sensor (TellSpec, Toronto, ON, Canada); SCiO Sensor (Consumer Physics, Tel Aviv, Israel); and microPHAZIR (Thermo Fisher Scientific, Waltham, MA, USA). The main features and technical parameters of the devices, in addition to the spectral range, recording interval, and the measurement of references, are described in the Supplementary Material (Table S2).
The NIR spectra were recorded by placing the device window directly on the surface of the portion. The Foss NIRSystem 5000 was equipped with a 5 cm × 5 cm quartz window so that the spectrum area included both lean muscle mass and fat. The spectra were recorded at three different points, and the average of these was considered to be the spectrum for the whole slice. In the case of the BüchiNIRFlex N-500 500 (Büchi, Flawil, Switzerland)microPHAZIR (Thermo Fisher Scientific, Waltham, MA, USA), MicroNIR 1700 ES (VIAVI, Milpitas, CA, USA), Enterprise Sensor (TellSpec, Toronto, ON, Canada), and SCiO (Consumer Physics, Tel Aviv, Israel) devices, six spectra of lean muscle and four spectra of fat were recorded. Subsequently, the mean of all replicates in each area was calculated to obtain a mean spectrum for fat and a mean spectrum for lean meat, and the mean spectrum for the entire slice was calculated as the mean of all spectra. Each sample was recorded by all devices in the same session.
2.4. Artificial Neural Network Calibration
The calibration curves for all sensory parameters were calculated by using a feedforward multilayer perceptron (MLP) artificial neural network (ANN), employing a Levenberg–Marquardt backpropagation training algorithm in accordance with the protocol previously described by Hernández-Ramos et al. [8].
The ANN selected consisted of an input layer that had as many neurons as NIR absorbance values. The ANN developed for the Foss NIRSystem 5000, therefore, had 451 neurons; for the BüchiNIRFlex N-500, it had 1501 neurons; for the MicroNIR 1700, it had 125 neurons; for the Enterprise Sensor, it had 256 neurons; and for the SCiO Sensor, it had 331 neurons, and for the microPHAZIR, it had 100 neurons. All ANNs had a hidden layer with a number of neurons ranging from 1 to 15. Finally, the output layer had only one neuron, which gave the predicted value for each parameter. The selected functions were the hyperbolic tangent sigmoid for the hidden layer and the pure linear transfer function for the output layer. For each scenario (device, recording area, and sensory parameter) and number of neurons in the hidden layer, the ANN was trained 100 times to obtain the best architecture using a known seed value as the initial weight and a bias matrix to allow the subsequent reproducibility of the data [30]. The pairs of input (absorbance value) and output (sensory score) data were randomly divided for all ANNs into three sets called the training set, validation set, and test set to represent 70%, 15%, and 15% of the data, respectively, i.e., a total of 42 samples in the training set and 9 samples in the validation and test sets. A total of 672,000 architectures were calculated (28 parameters, 5 devices, 3 recording sites, 100 training times, and between 1 and 15 neurons, plus 28 parameters, 1 device, 1 recording site, 100 training times, and between 1 and 15 neurons), and the best architecture was selected based on the highest R^2^ values and the lowest RMSE values. The RPD (ratio performance deviation) was calculated for the best final ANN architecture in order to assess the model performance. The Deep Learning Toolbox of MatLab (MathWorks^®^) version R2018 was the software used for all tests.
3. Results
3.1. Sensory Characteristics of the Samples Analyzed
The sensory characteristics or attributes of the samples analyzed by the sensory panel are shown in Table 1. Statistical analysis of the samples showed significant differences between the 100% Iberian and Iberian samples in four out of the six visual appearance parameters and seven out of the eight texture parameters, while significant differences were only observed in one of the parameters included in the flavor profile, rancid aroma. It is worth noting that, as described in the Materials and Methods, both groups of samples were processed in the same factory, following exactly the same protocol, and were cured in the same facilities for the same period of time. Therefore, the significant differences observed were mainly related to breed, as both groups were raised in the same geographical area and under the same management system, the montanera, in which the animals feed on grass and acorns during the fattening period.
The purebred Iberian samples were characterized by significantly less marbling, less color homogeneity, and fewer white spots, while color intensity was higher. These results are fully in agreement with those previously published by Hernández-Ramos et al. [8], who analyzed 100% Iberian and Iberian commercial hams. They attributed the increased presence of veining and exudate to the higher intramuscular fat content of the Iberian breed, as also reported by Mayoral et al. [31]. In terms of color, the 100% Iberian breed showed greater color intensity and less chromatic homogeneity, i.e., the presence of several shades in the same slice, which is consistent with the higher L* and a* values and higher myoglobin content of pure Iberian hams described by Fuentes et al. [32]. The samples analyzed were characterized by the presence of white spots, which are tyrosine and phenylalanine crystals that appear as a result of proteolysis when hams are aged for long periods [33]. Previous results have shown that the incidence of tyrosine crystals depends on the salinity, drying level, temperature, and the combined effect [34]. However, the results of both these samples and commercial samples [8] point to a significant influence of the breed on this phenomenon. In this regard, Carrapiso et al. [35] described that significant differences in bitterness, which are also related to the proteolysis process [36], were only related to crossbreeding.
Flavor parameters were not significantly affected by the breed, which is consistent with previous results showing no major significant differences between 100% and 50% Iberian pigs [8,35] attributed to genetic similarity. It should be noted that some attributes, such as saltiness, sourness, rancidity, or an atypical flavor, showed almost identical values, which shows that these parameters were more correlated with processing conditions. On the other hand, the odor intensity, cured aroma, rancidity, flavor intensity, and fat flavor intensity, although they showed no statistically significant differences, were slightly higher in 50% Iberian ham, which is probably due to the higher fat content. It is well-known that lipolysis, fatty acid oxidation, and Maillard reactions constitute the main processes contributing to the generation of the volatile responsible for the odor and flavor of cured ham [37,38,39]. In addition, proteolysis is also involved in the generation of volatile compounds [39] and the formed products formed either contribute directly to the taste [40] or are precursors of odorants [41]. Differences in proteolysis related to crossbreeding could, therefore, also affect the flavor profile.
Finally, texture attributes were affected by genetics in the same way, as previously reported by Hernández-Ramos et al. [8], which demonstrates the clear effect of crossbreeding on the texture of Iberian ham. The 50% Iberian ham samples were significantly less tough and fibrous and had lower chewiness and gumminess values, although these were not statistically significant. These samples also showed significantly higher levels of juiciness and fatness. Therefore, these results confirm the correlations between the marbling attribute and the texture parameters previously described by Hernández-Ramos et al. [8], which, as mentioned above, were attributed to the higher intramuscular fat content of the 50% Iberian samples, which increases juiciness and decreases hardness and fibrousness [42]. In addition, previous studies found a close relationship between the fat content and the sensory measurements of fat [35,43]. Furthermore, proteolytic changes in myofibrillar and sarcoplasmic proteins are crucial for the development of texture and sensory characteristics [44]. This process is affected by many factors, such as breeding conditions, the characteristics of the raw product, and the maturation process [45], but also by pig genetics [46] and lipid oxidation [47], as observed in this study.
3.2. Spectral Characteristics of the Samples Analyzed
Previous studies have shown that, although distinctive characteristics and differences can be observed between the spectra measured by benchtop and miniaturized spectrometers [48], the shapes of the absorption lines obtained with different equipment show similarities [23,49]. Therefore, Figure 1 shows the average spectra of 100% Iberian and 50% Iberian hams recorded for the lean meat, the fatty part of the slices, and the spectra of the whole slices, calculated as the average value of the spectra obtained for the fat and lean meat [27] by the NIRFlex N-500 equipment, which has the widest spectral range.
Differences owing to the breed of pig are more easily observed in the fat spectra, as in lean meat, they are less clear, and in whole slices, they are barely perceptible. In the first case, the 50% Iberian samples showed higher absorbance in the ranges between 1000 and 1600 nm and between 1800 and 2000 nm, which could be related to the higher fat content of the 50% Iberian samples, while in the 2100–2500 nm range, the 100% Iberian samples showed slightly higher absorbance. However, the 100% Iberian samples showed higher absorbance for all wavelengths when the spectra were recorded in lean meat.
The maximum absorbance peaks observed for the three recording sites at 1200 nm correspond to the second overtone of the C-H stretching vibration [50], and the peaks observed at 1730 and 1762 correspond to the first C-H stretching overtone. The lack of clear differences observed for these peaks corresponding to fatty acid composition could be due to the high number of shared absorbing molecular groups present in these compounds [51,52]. The combination tones of the C-H stretching and bending modes appear at 2310 and 2350 nm [53]. The NIR region between 2000 and 2300 is where the distinction between saturated and unsaturated compounds can most clearly be observed, as the specificity of the combined bands of unsaturated acids is manifested in this region [54]. The maximum peaks observed at 1450 and 1950 nm would be related to the -OH groups corresponding to the third, second, and first overtones of the stretching mode [55]. However, within this range, it is also possible to find N-H absorption bands around 1500, 1950, and 2450 nm, but most of them are rather difficult to discern, owing to their proximity to the absorption bands of fat and water, as the bands are very broad [53].
As regards the correlation between spectral characteristics and sensory parameters, the work of Hernández-Ramos et al. [8] showed a correlation between absorbance in the vicinity of 1500 nm and texture parameters such as hardness (1502, 1518, and 1530), fibrousness (1518 and 1528), and heterogeneity (1510, 1534), but also for 1720 and fibrousness, with all these parameters being significantly higher in the 100% Iberian samples. These wavelengths are related to the SH-SH bond (1736 nm) or to the absorption of amines, amides, urea, or proteins, and the 100% Iberian samples showed slightly higher absorbance when the spectra were taken from lean meat. On the other hand, the 50% Iberian samples were characterized by a greater sensation of fat, which showed a correlation with 1162 and 1720 nm, which, in turn, are correlated with C=O and CO-Oil bonds, but also with 1488 and 1520 nm, which correspond to amides, amines, and urea. The 50% Iberian samples showed significantly higher fatness values and slightly higher absorbance at 1500 and 1700 nm in the spectra of fat and the whole slices.
3.3. Prediction of Sensory Parameters
As previously reported, sensory characteristics are complex traits that require non-linear statistical approaches [56], such as artificial neural networks, which have proven to be a very suitable tool for meat products [8,19], as they provide better R^2^ than multiple regression tools [18]. Taking into account the results of previous studies on Iberian ham, a feedforward MLP ANN device with the Levenberg–Marquardt backpropagation training algorithm was used to predict the sensory parameters. In addition, 100 training times and a maximum number of neurons in the hidden layer of 15 were tested. Previous studies revealed that the greater the number of training sessions, the lower the number of neurons in the hidden layer required to obtain the highest R^2^. Therefore, for such a high number of training sessions, it would not be necessary to test a larger number of neurons. The best ANN architecture was selected based on the highest R^2^ values and the lowest RMSE values (training, validation, test, and total) (Table 2, Table 3 and Table 4). R^2^Train indicates the way in which the network is able to predict results using the data with which it has been trained, R^2^Valid gives information about the network’s overfitting, R^2^Test measures the performance of the network and its ability to predict unknown data, and R^2^Total measures the result of analyzing the data from all samples obtained through the network. Therefore, in this study, the R^2^Test was prioritized, as it is more useful for evaluating the performance of the network once it is operational, and subsequently the R^2^Total, R^2^Train, and R^2^Valid.
The joint analysis of the results obtained for all parameters, devices, and recording sites revealed that R^2^Train showed very high values, almost always above 0.8 and very often above 0.9. This is because during the training process, the errors between the data predicted and observed decrease until they reach a stable minimum. The network is then able to predict the training data with great accuracy. To calculate R^2^Valid, the network is tested with data that do not belong to the training set. After several passes through the training set data, the network is tested with data from the validation set, which was not used during training. As long as the validation errors continue to decrease, the network is learning. If, on the contrary, and as generally observed in this study, the errors increase during the validation process, this means that the network is overfitting. Therefore, the low values obtained in general for R^2^Valid showed that the networks were learning but had problems in generalizing their performance to other data, i.e., they were overfitting. As for the R^2^Test, this parameter tended to have high values, as the ANN architecture was selected in accordance with it. Since R^2^Total is the result of all the data passing through the network obtained, in general, satisfactory values were observed. It should also be noted that for some ANN architectures, apparently contradictory results were obtained, in which, although very good values were obtained during training, the validation values were very low, with the remainder of the values within a very high range. This was due to the small number of samples (60), which were divided into three data sets at random so that the validation and test sets included nine samples (15% of the samples). The results were therefore strongly affected by the type of samples included in each set for that ANN.
3.3.1. Prediction of Sensory Parameters Using Spectra Recorded in Lean Meat
Six spectra were recorded at different points of the lean meat part of the slices by the BüchiNIRFlex N-500, MicroNIR 1700 ES, Enterprise Sensor, and microPHAZIRand SCiO devices, and the average spectrum for each sample was calculated and used for ANN analysis. The correlation coefficients (R^2^) and root mean square error (RMSE) for each device and sensory parameter are shown in Table 2. The results of the appearance, flavor, and texture parameters are presented separately.
The following levels of interpretations were used as a reference: R^2^ > 0.9 was considered excellent, R^2^ > 0.8 as good, R^2^ > 0.7 as acceptable, R^2^ > 0.6 as moderate, and R^2^ > 0.5 as fair. In addition to this, according to Williams [57], a calibration with an RSQ of <0.5 is considered unsuccessful, while an RSQ of between 0.50 and 0.65 indicates the possibility of distinguishing between high and low values. Therefore, for this study, a minimum RSQ value of >0.5 was chosen, as it points to the possibility of a successful calibration and can also be considered as an initial reference for comparing the feasibility of the prediction of the different devices used. On the other hand, an RSQ of 0.5–0.6 can be considered prospective. In this sense, high values for some attributes, such as the juiciness, softness, cured flavor, flavor intensity, and sweetness, are valued as positive, while high fibrousness, mold odor, and saltiness are valued as negative by consumers [4,58]. Therefore, high or low values for these parameters can be correlated with the acceptability of the cured ham, bearing in mind that this correlation is not always linear.
As regards appearance parameters (Table 2 (a)), all devices showed an R^2^Total of >0.5 for all parameters, except microPHAZIR for color intensity. However, the number of parameters with an R^2^total of >0.7 was lower and depended on the device. It was thus possible to predict four out of six parameters with NIRFlex N-500 (veined, fat color, color homogeneity, and color intensity), with the former two showing an R^2^total of >0.8. For MicroNIR, veined, color homogeneity, and color intensity showed an R^2^Total of >0.7, with the same color homogeneity for microPHAZIR, and only veined for Enterprise. Therefore, veined and color homogeneity were the parameters that reached the highest R^2^Total values for this recording site, while the exudate showed the lowest values. It should be noted that the color homogeneity and exudate tended to have a higher number of neurons in the hidden layer, while the Enterprise device tended to show fewer neurons.
A total of 14 flavor parameters were analyzed (Table 2 (b)), and the results showed that 10 parameters for SCiO and 13 parameters for NIRFlex N-500 (all except aftertaste) were predicted with an R^2^Total of >0.5. As with the appearance, the number of flavor parameters that showed an R^2^Total of >0.7 was much lower, ranging from six for NIRFlex N-500 and microPHAZIR, including rancidity or sweetness with an R^2^Total of >0.8, to four for MicroNIR (sweetness, R^2^Total of >0.8), Enterprise (aftertaste, R^2^total of >0.8), and SCiO (pig aroma, R^2^total of >0.8). Flavor intensity was the best-predicted parameter, as all devices showed an R^2^Total of >0.7, followed by pig aroma, while rancidity showed the worst results, as only NIRFlex N-500 and microPHAZIR showed an R^2^Total of >0.5. For odor intensity, atypical aroma, and cured flavor, none of the devices showed an R^2^Total of >0.7, although almost all of these showed an R^2^Total of >0.5. In this case, in general, the cured aroma and atypical aroma showed a higher number of neurons in the hidden layer, while Enterprise and MicroNIIR tended to have a lower number of neurons.
Finally, eight texture parameters were also calibrated (Table 2 (c)). All devices were able to predict seven out of eight texture parameters with an R^2^Total of >0.5, except for microPHAZIR, which only showed this R^2^Total value for four parameters. For this group of sensory attributes, NIRFlex N-500, MicroNIR, and SCiO showed an R^2^Total of >0.7 for four parameters and an R^2^total of >0.8 for three parameters in the case of NIRFlex N-500 or two parameters for MicroNIR and SCiO (hardness, juiciness, and fibrousness in general). Hardness, juiciness, fatness, and fibrousness were predicted by all the devices with an R^2^Total of >0.5, with fibrousness and juiciness having the highest R^2^Total coefficients, while chewiness and homogeneity were predicted by all the devices except microPHAZIR. On the other hand, the parameter with the poorest prediction was chewing residue, as only NIRFlex N-500 showed an R^2^Total of >0.5. This attribute also showed the highest number of neurons in the hidden layer. Overall, the number of parameters with an R^2^Total of >0.5 was higher for appearance attributes, although the texture parameters showed slightly higher R^2^Total values for this recording site.
Similar results were observed when RPD was considered (Table S3). NIRFlex N500, therefore, showed the highest number of parameters with high RPD values, with the Enterprise device having, in general, the lowest values for this parameter, followed by the SCiO device.
3.3.2. Prediction of Sensory Parameters Using Spectra Recorded on Fat
As described above, for the spectral recording of fat, four spectra were taken from the fatty areas within the slices, and the average value of each sample was calculated. The results of calibration with ANN using sensory scores determined by the evaluators as reference analysis are shown in Table 3. For this recording site, it can be observed that all the parameters (except exudate for NIRFlex N-500, which showed an R^2^total of 0.565) were predicted with an R^2^Total of >0.6. MicroPHAZIR showed an R^2^Total of >0.8 for three parameters (veined, the fat color, and white dots), while NIRFlex N-500 obtained these results for only two (color intensity and white dots), and Enterprise for only one, exudate (Table 3 (a)). In this case, the best-predicted parameters were, in general, white dots with an R^2^total of >0.7 for most devices, followed by the fat color, while the exudate showed a higher R^2^total than those observed when the calibration was made on lean meat, as the R^2^totals were higher than 0.6 for most of the devices.
As for the odor and flavor parameters (Table 3 (b)), the NIRFlex N-500, microPHAZIR, and Enterprise devices were able to predict 13 out of 14 parameters with an R^2^total of >0.5, while MicroNIR showed this R^2^total value for 12 parameters, and SCiO only for 8 parameters. It is worth mentioning the best performance of NIRFlex N-500 for this set of parameters, as it showed an R^2^total of >0.7 for six parameters (the pig aroma, rancid aroma, atypical aroma, fat flavor intensity, sweetness, and aftertaste) and an R^2^total of >0.8 for two. The remainder of the devices showed an R^2^total of >0.7 between four parameters and one parameter, with the latter being the SCiO equipment, which showed the poorest results among the devices used. The parameters that were predicted by a higher number of devices with the highest R^2^total values were the atypical aroma, followed by the pig aroma, aftertaste, and fat flavor intensity. On the other hand, the lowest R^2^totals were obtained for rancid and cured aromas.
As far as texture parameters are concerned (Table 3 (c)), the most relevant result was that all devices predicted hardness with an R^2^Total of >0.8, reaching values of >0.9 for NIRFlex N-500 and microPHAZIR. These high R^2^Total values were the result of very high values also for R^2^Train, R^2^Valid, and R^2^Test, which reveals the feasibility of predicting this sensory parameter by NIRS spectroscopy. Juiciness, fibrousness, and fatness also attained high R^2^Total values of between 0.7 and 0.8 for all the devices except for SCiO (fatness). In contrast, gumminess showed very low R^2^total values, with an R^2^Total of >0.5 only observed for NIRFlex N-500 and microPHAZIR.
The best prediction performance was shown by NIRFlex N-500, as all the texture parameters were predicted with an R^2^total of >0.6, with six of them with an R^2^total of >0.7 and two of them with an R^2^Total of >0.8, closely followed by microPHAZIR, which also predicted all the parameters with an R^2^Total of >0.6. On the other hand, SCiO was only able to predict four out of eight values with an R^2^total of >0.6 (six parameters with an R^2^total of >0.5), and only hardness showed an R^2^Total of >0.8.
These results demonstrated the poorer performance of the SCiO device when the spectra were recorded in the fatty areas of the ham slices, and that, in general, texture parameters were better predicted than appearance and flavor parameters for this recording site. These results were also observed when RPD was considered to assess the model performance (Table S3). Furthermore, no clear trend was observed in terms of the number of neurons in the hidden layer; neither of the parameters with a lower R^2^Total showed a higher number, nor was there any device that tended to show a lower (or higher) number of neurons.
3.3.3. Prediction of Sensory Parameters Using the Whole Slice Spectra
Finally, since fat and lean meat are consumed together, the spectrum of the whole slice was calculated for each sample as the average of the ten spectra recorded for the slices, except in the case of the Foss 5000. The calibration results, correlation coefficients (R^2^), and the root mean square error (RMSE) are shown in Table 4.
As was observed for the lean meat and fat recording sites, the number of calibrated parameters depended largely on the device. NIRFlex N-500, MicroNIR, and Enterprise therefore showed an R^2^Total of >0.5 for all the appearance parameters (Table 4 (a)), while Foss 5000 and microPHAZIR showed this value for five out of six parameters, and SCiO showed this value only for three parameters. The number of parameters showing an R^2^Total of >0.7 ranged from five (microPHAZIR) to one (SCiO and Foss 5000). However, it should be noted that NIRFlex N-500 showed an R^2^Total of >0.8 for three parameters, which was the highest value among the devices used. The best performance of this equipment was corroborated by the higher RPD values observed for this set of sensory characteristics. The parameters that showed the highest R^2^Totals for all the devices tested were veined, followed by color intensity, which was predicted by all of them, and color homogeneity. On the other hand, the exudate showed the lowest R^2^total values and the highest number of neurons in the hidden layer.
In terms of flavor attributes (Table 4 (b)), NIRFlex N-500 again showed the highest number of predicted parameters (13), followed by microPHAZIR and MicroNIR (10), while SCiO showed the lowest performance. In fact, NIRFlex N-500 showed an R^2^total of >0.7 for eight parameters, while the other devices showed a maximum of four parameters with this value. The best-predicted parameters were the saltiness, followed by the aftertaste and odor intensity, which were predicted by all the devices, while the poorest results were observed for rancidity, as only NIRFlex N-500 showed an R^2^total of >0.5.
The results of texture parameter prediction (Table 4 (c)) revealed that NIRFlex N-500 showed an R^2^total of >0.6 for the eight parameters analyzed and an R^2^total of >0.8 for five of them. On the other hand, MicroNIR and SCiO had an R^2^total of >0.5 for all the parameters. However, MicroNIR showed an R^2^total of >0.7 for six parameters, while SCiO had this value for only four parameters. For this set of parameters, the Enterprise equipment showed the lowest prediction capacity, as only five parameters had an R^2^total of >0.5. Fibrousness was the best-predicted parameter, followed by juiciness and heterogeneity, while gumminess and chewing residue displayed the lowest R^2^total values. In this case, no clear trend regarding the number of neurons in the hidden layer was observed. Therefore, according to the RPD value, for this recording site, the best performance was observed for NIRFlex 500, while Foss 5000 did not show high RPD values. The high RPD values of the MicroPHAZIR device, followed by the MicroNIR device, are noteworthy.
The R^2^ values were generally lower than those previously reported for ham when whole slices were tested [8,21], and they were also lower than the R^2^ obtained for other meat products, such as dry-cured beef or loin [19,20], owing to the lower number and variability of the samples analyzed in this study and the lack of previous homogenization. For all recording sites and devices, in general, the highest R^2^ values were observed for texture parameters and the lowest R^2^ values were found for flavor parameters, which is in agreement with the results reported by Revilla et al. [19] and Curto et al. [59], while portable devices showed similar R^2^ values for both appearance and texture parameters, as reported by Vasconcelos et al. [20].
Table 5 summarizes the total number of parameters predicted by each device used, depending on the fixed R^2^Total (>0.5, >0.6, >0.7, or >0.8), grouped by appearance, flavor, or texture attributes.
It can be observed that the best recording site depended strongly on the device. The NIRFlex N-500 benchtop device gave the best performance among all the devices used, which coincides with the previous results [27,49,60,61] for all recordings, with particularly high values for the entire slice registration methodology, with 27 of the 28 parameters predicted with an R^2^Total of >0.5 for all recording sites and 18 parameters showing an R^2^total of >0.7. These results mean that this benchtop equipment could be considered as a reference. However, the FOSS 5000 benchtop device did not perform as well as the previous one, with 20 parameters showing an R^2^Total of >0.5 and only two parameters showing R^2^Total values of >0.8, i.e., both microPHAZIR and MicroNIR achieved better results.
As for portable devices, when the spectra were recorded for whole slices, the MicroNIR performed very well, with 25 parameters showing an R^2^total of >0.5 and 13 parameters reaching an R^2^total of >0.7. When the spectra were recorded for fat, microPHAZIR and Enterprise showed the highest number of parameters predicted, with 27 and 26 parameters, respectively, predicted with an R^2^total of >0.5 and 13 parameters predicted with an R^2^total of >0.7 in both cases. On the other hand, MicroNIR and SCiO demonstrated better performance when spectra were recorded for lean meat with 25 and 23 parameters, with an R^2^Total of >0.5 and 11 and 10 parameters with an R^2^Total of >0.7, respectively. These results differ, in general, from those previously reported for fatty acids, which were better predicted for lean meat except in the case of SCIO, which showed better performance for fat [27].
The results, therefore, suggest that, in general, the parameters predicted with the highest R^2^total depended on the recording area, except for MicroNIR, which showed very consistent results for all sites, which indicates that measurements taken in different areas provide complementary information, as previously reported by Hernández-Jiménez et al. [24]. Accordingly, NIRFlex N-500 was able to predict a total of 16 different sensory parameters with an R^2^Total of >0.8 (veined, fat color, color intensity, color homogeneity, white dots, rancidity, typical aroma, cured flavor, cured aroma, saltiness, hardness, juiciness, fatness, fibrousness, chewiness, and heterogeneity). Among the portable devices, microPHAZIR showed a total of nine parameters (veined, color homogeneity, fat color, sweetness, aftertaste, cured aroma, hardness, juiciness, and fibrousness), Enterprise showed eight parameters (veined, exudate, aftertaste, cured flavor, saltiness, hardness, juiciness, and fibrousness), MicroNIR1700 showed a total of seven parameters (veined, color homogeneity, fat color, sweetness, sourness, hardness, and juiciness), and SCiO showed a total of four different attributes (pig aroma, atypical aroma, saltiness, and hardness) when using the information from all the recording possibilities. It is worth highlighting that some of these characteristics, such as hardness, fibrousness, juiciness, color homogeneity, flavor intensity, sweetness, and fat color, are decisive in consumer acceptance of Iberian ham [4,58].
4. Conclusions
These results allowed us to conclude that, on the one hand, when using a portable device, it is essential to optimize the recording area, but, on the other hand, the results obtained at different recording sites are complementary. Among the sensory parameters analyzed in this study, veins, color homogeneity, color intensity, hardness, juiciness, fatness, and fibrousness showed statistically significant differences owing to the breed, which makes them particularly relevant to the characterization of Iberian ham. These parameters were predicted by all devices and at all recording sites. The best results were obtained with the NIRFlex N-500, with between 26 and 27 out of the 28 parameters predicted. Among all the portable devices used, MicroNIR and microPHAZIR gave the best results, as they were able to predict the aforementioned parameters with high R^2^ values in addition to the parameters of flavor intensity, sweetness, and fat color, which are decisive for consumer acceptance of Iberian ham. These results point to the suitability of portable devices for predicting the sensory properties of Iberian ham. However, a larger set of samples with greater variability must be analyzed to improve the performance of the ANN, especially the R^2^ values of the validation set. This would allow a broader application of the methods developed.
The reference list from the paper itself. Each links out to its DOI / PubMed record.
- 1Lorido L. Hort J. Estévez M. Ventanas S. Reporting the Sensory Properties of Dry-Cured Ham Using a New Language: Time Intensity (TI) and Temporal Dominance of Sensations (TDS)Meat Sci.201612116617410.1016/j.meatsci.2016.06.00927322593 · doi ↗ · pubmed ↗
- 2Tejerina D. García-Torres S. Cabeza de Vaca M. Vázquez F.M. Cava R. Effect of Production System on Physical–Chemical, Antioxidant and Fatty Acids Composition of Longissimus Dorsi and Serratus Ventralis Muscles from Iberian Pig Food Chem.201213329329910.1016/j.foodchem.2012.01.02525683398 · doi ↗ · pubmed ↗
- 3Díaz-Caro C. García-Torres S. Elghannam A. Tejerina D. Mesias F.J. Ortiz A. Is Production System a Relevant Attribute in Consumers’ Food Preferences? The Case of Iberian Dry-Cured Ham in Spain Meat Sci.201915810790810.1016/j.meatsci.2019.10790831446367 · doi ↗ · pubmed ↗
- 4Ruiz J. García C. Muriel E. Andrés A.I. Ventanas J. Influence of Sensory Characteristics on the Acceptability of Dry-Cured Ham Meat Sci.20026134735410.1016/S 0309-1740(01)00204-222061062 · doi ↗ · pubmed ↗
- 5Caballero D. Antequera T. Caro A. Duran M.L. Perez-Palacios T. Data Mining on MRI-Computational Texture Features to Predict Sensory Characteristics in Ham Food Bioprocess Technol 2016969970810.1007/s 11947-015-1662-1 · doi ↗
- 6González-Casado A. Jiménez-Carvelo A.M. Cuadros-Rodríguez L. Sensory Quality Control of Dry-Cured Ham: A Comprehensive Methodology for Sensory Panel Qualification and Method Validation Meat Sci.201914914915510.1016/j.meatsci.2018.11.02130528719 · doi ↗ · pubmed ↗
- 7Guàrdia M.D. Aguiar A.P.S. Claret A. Arnau J. Guerrero L. Sensory Characterization of Dry-Cured Ham Using Free-Choice Profiling Food Qual. Prefer.20102114815510.1016/j.foodqual.2009.08.014 · doi ↗
- 8Hernández-Ramos P. Vivar-Quintana A.M. Revilla I. González-Martín M.I. Hernández-Jiménez M. Martínez-Martín I. Prediction of Sensory Parameters of Cured Ham: A Study of the Viability of the Use of NIR Spectroscopy and Artificial Neural Networks Sensors 202020562410.3390/s 2019562433019622 PMC 7584045 · doi ↗ · pubmed ↗