First Plastome Sequences of Two Endemic Taxa of Orbea Haw. from the Arabian Peninsula: Comparative Genomics and Phylogenetic Relationships Within the Tribe Ceropegieae (Asclepiadoideae, Apocynaceae)
Samah A. Alharbi

TL;DR
This study provides the first complete chloroplast DNA sequences for two rare Orbea plants from the Arabian Peninsula, revealing unique genetic features and evolutionary relationships.
Contribution
The study reports the first plastome sequences of two Arabian Orbea species and identifies key genetic differences and evolutionary patterns.
Findings
One Orbea species has the largest chloroplast genome in the tribe Ceropegieae with structural rearrangements.
Six highly variable DNA regions were identified as potential barcodes for plant identification and evolutionary studies.
Arabian Orbea species form a distinct evolutionary group separate from African species.
Abstract
Orbea Haw. is a genus of succulent plants that grow in extremely dry regions, including parts of the Arabian Peninsula. These plants contribute to the unique biodiversity of desert ecosystems, yet their chloroplast genetic information has remained largely unstudied. This research presents the first complete chloroplast DNA sequences of two Orbea plants endemic to the Arabian Peninsula. By examining and comparing their genetic sequences with those of related species, several notable findings were revealed. One species possesses an unusually large chloroplast genome and a distinctive rearrangement of several genes, indicating a more complex evolutionary history than previously recognized. Regions of the DNA that show high levels of variation between species were also identified; these areas can support accurate plant identification and further studies on plant evolution. In addition, the…
Genes, proteins, chemicals, diseases, species, mutations and cell lines named across the full text — each resolved to its canonical identifier and authoritative record.
Click any figure to enlarge with its caption.
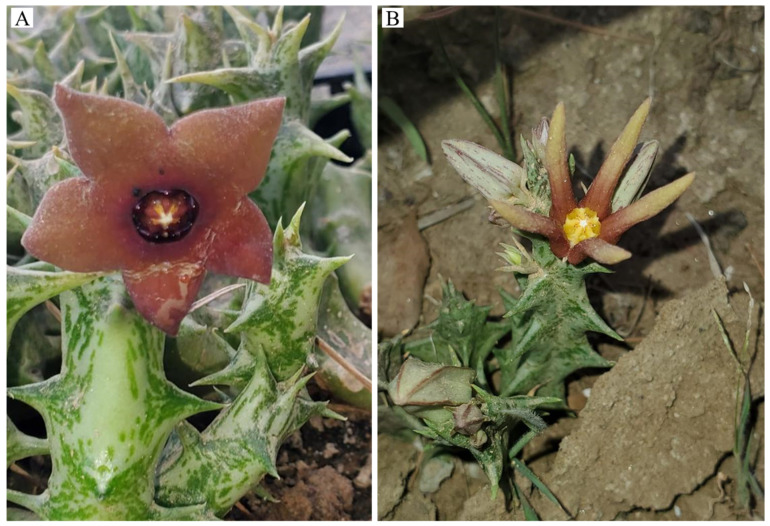 Figure 1
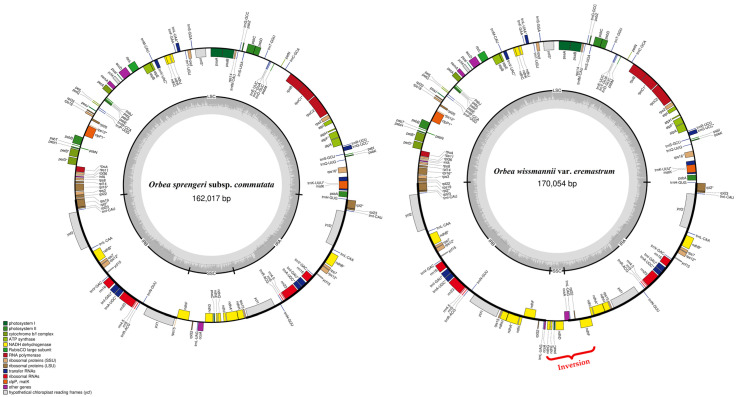 Figure 2
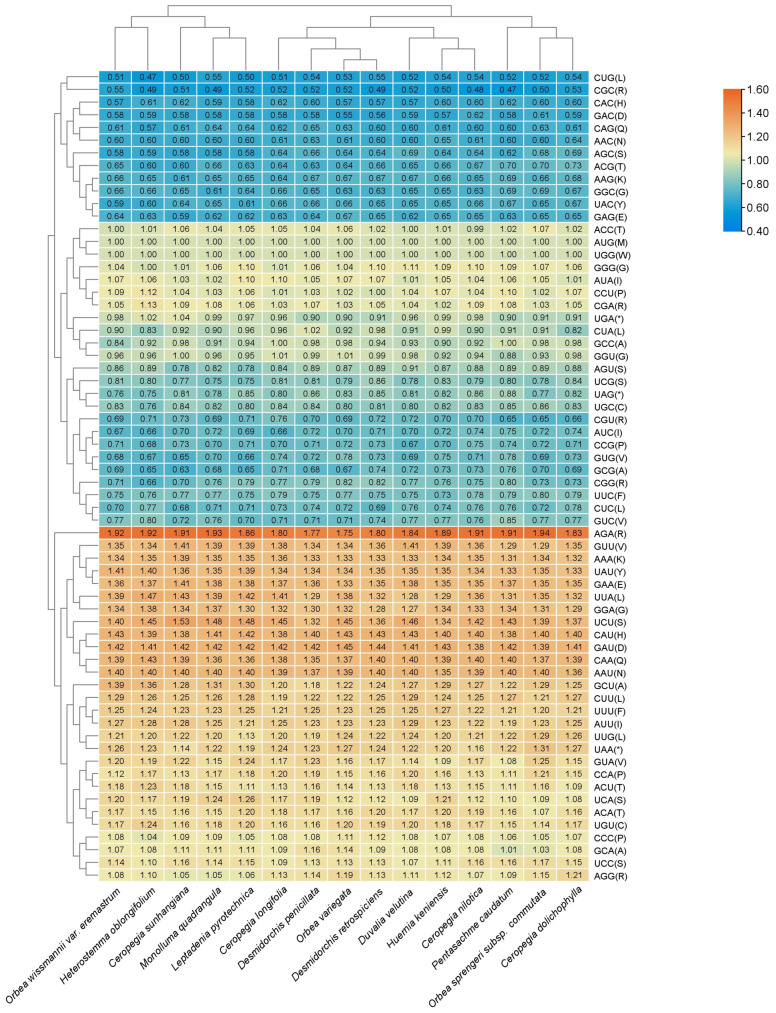 Figure 3
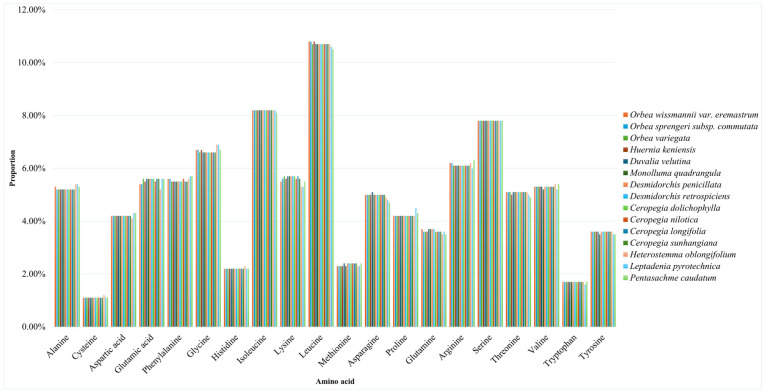 Figure 4
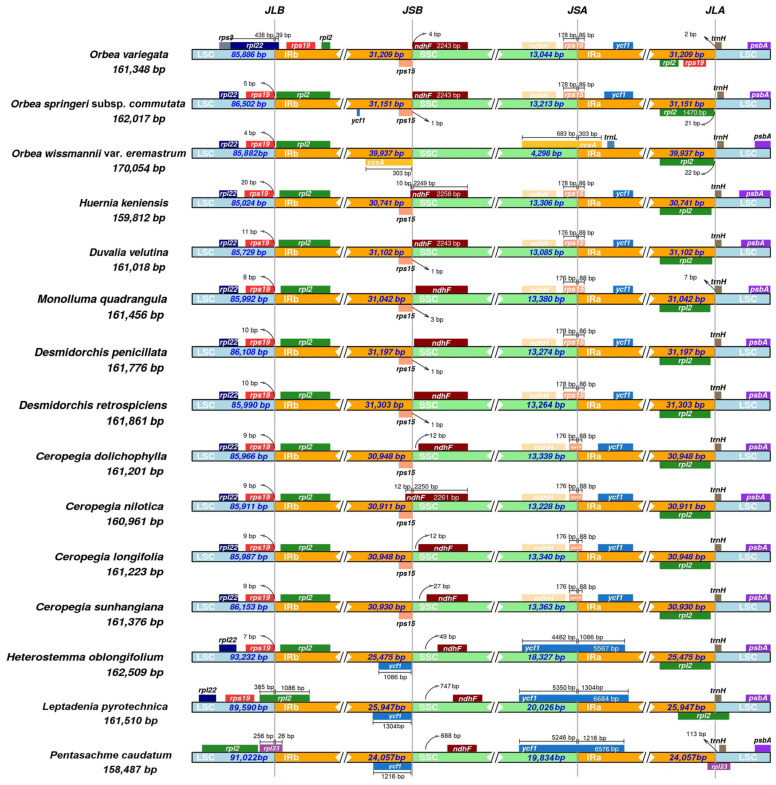 Figure 5
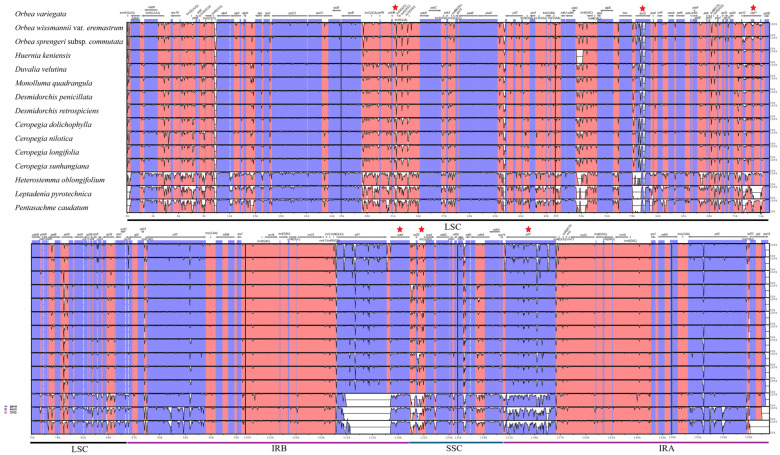 Figure 6
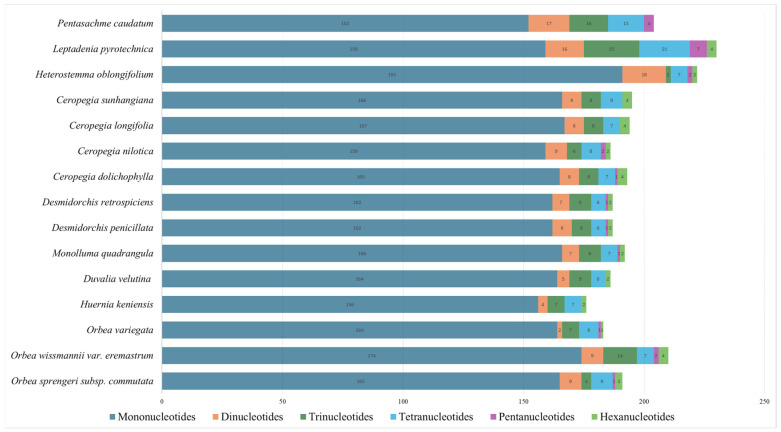 Figure 7
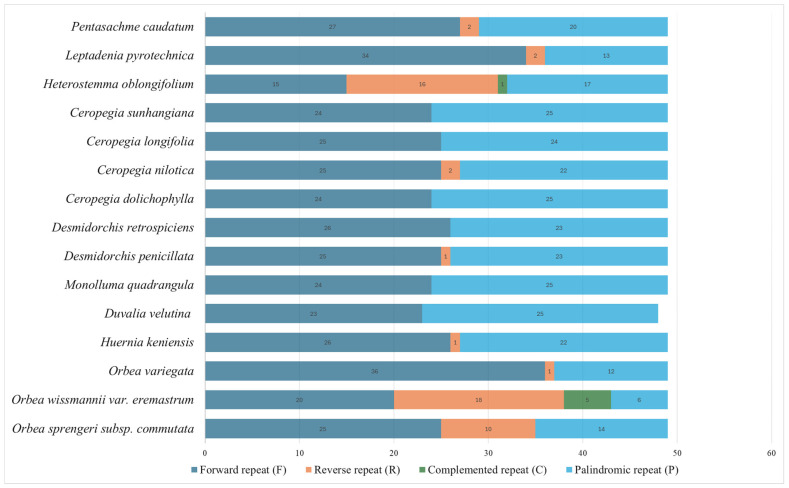 Figure 8
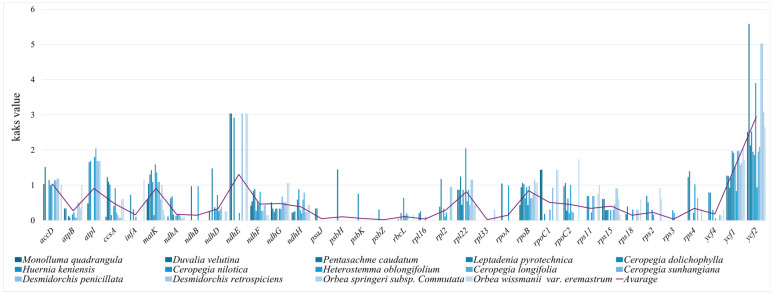 Figure 9
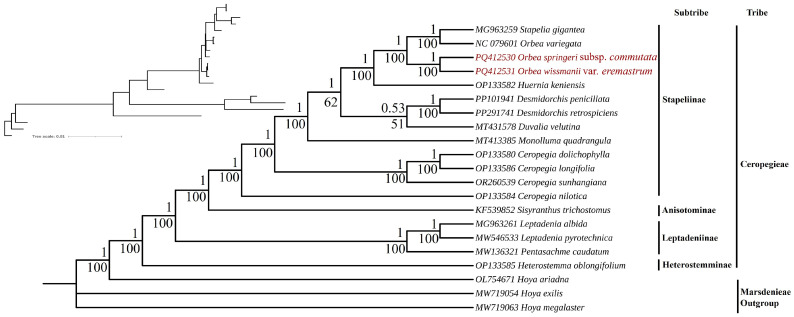 Figure 10
Peer Reviews
No public reviews on file for this paper yet. If you reviewed it on a platform where reviews are public (OpenReview, ICLR, NeurIPS, ICML), you can paste yours below so the community can read it here.
Videos
No videos yet. Explain this paper in a talk, walkthrough, or lecture? Add one.
Taxonomy
TopicsPlant Diversity and Evolution · Genomics and Phylogenetic Studies · Chromosomal and Genetic Variations
1. Introduction
The tribe Ceropegieae is the third largest of the five tribes within the subfamily Asclepiadoideae (Apocynaceae), comprising a diverse group of c. 800 plant species distributed throughout the Old World tropics and subtropics [1,2]. It is divided into four subtribes—Anisotominae, Heterostemminae, Leptadeniinae, and Stapeliinae—each reflecting a distinct evolutionary lineage [3,4,5]. The stem-succulent stapeliads of the Stapeliinae form the core of the tribe Ceropegieae, encompassing c. 357 species in 31 genera [6] characterized by leafless, fleshy stems adapted to arid environments [7,8,9]. Among these, the genus Orbea Haw. is one of the largest, with about 60 recognized species [10] distributed from southern and eastern Africa to the Arabian Peninsula [2,11]. Orbea variegata (L.) Haw. (Syn. Stapelia variegata L), the type species, is among the most popular stapeliads, attracting many succulent enthusiasts for its striking appearance [12].
The southern regions of the Arabian Peninsula represent a center of succulent diversity, harboring numerous endemic species that contribute to the region’s status as a biodiversity hotspot [13,14]. Among these, species of the genus Orbea play a prominent role, with twelve taxa reported so far from the Arabian Peninsula (Table 1) [10,11,15,16,17]. The taxonomy of Arabian Orbea has undergone several revisions over the years, mirroring broader taxonomic shifts within the genus. The subsequent overview highlights key taxonomic developments in Orbea, focusing especially on revisions pertaining to the Arabian taxa.
The genus Orbea was originally described by Adrian Hardy Haworth in 1812 but was soon synonymized under Stapelia [11,18]. Until its resurrection by Leach in 1975, most species remained classified within either Stapelia or Caralluma [19,20,21,22,23,24,25]. Subsequently, Leach [26] further reviewed the genus and proposed segregating several groups into newly established genera, namely Orbeopsis, Pachycymbium, and Orbeanthus. Later, Gilbert [27] expanded Pachycymbium to include Stultitia araysiana from Yemen and other members of the ‘Ango Group’ of Caralluma, which primarily includes species of Caralluma occurring mainly in tropical Africa and Arabia, north of the equator. In 1994, Plowes transferred these species to Angolluma, a genus originally established by R. Münster in 1990 [28].
Subsequently, Bruyns [11], Bruyns [29] merged all segregate genera (Orbeanthus, Orbeopsis, Pachycymbium, and Angolluma) back into an expanded Orbea, based on detailed phylogenetic analyses. While Bruyns dismissed Angolluma, Plowes continued to recognize it and, in 2007, described two new species from Yemen (A. cucullata and A. fenestrate) [30], which were later transferred to Orbea by Meve [31]. Additionally, Orbea nardii was recorded from Oman by Raffaelli, Mosti, and Tardelli in 2008 [32]. Recently, Bruyns, Klak and Hanáček [8] proposed reducing Orbea to a section within a broadly circumscribed Ceropegia L., based on molecular evidence. However, Orbea continues to be recognized as a distinct genus by other authorities, such as Endress, Meve, Middleton and Liede-Schumann [2] and Plant of the World Online POWO [10], who recognize 55 and 60 species, respectively. A detailed timeline of the historical taxonomic changes involving Arabian Orbea taxa is provided in Table S1.
Orbea species possess considerable cultural and economic importance, particularly due to their medicinal and nutritional uses across their distribution range [7,33,34]. Orbea variegata has been extensively investigated for its phytochemical composition, especially pregnane glycosides, which exhibit diverse biological activities, including antimicrobial, anti-inflammatory, antioxidant, and anti-carcinogenic effects, with recent studies highlighting its potential in skin cancer treatment [35,36,37]. Orbea deflersiana is used to treat burns, eczema, diabetes, and wounds, and demonstrates strong antioxidant, antibacterial, and antifungal activities [33,38,39]. Similarly, O. wissmannii var. wissmannii is traditionally used in Yemen to treat stomach ulcers, constipation, and food poisoning, and exhibits notable antioxidant and antimicrobial activity, particularly against Escherichia coli [33,40]. In addition to their medicinal value, several Orbea species contribute to food security. Orbea wissmannii var. wissmannii, locally known as “khusmaa,” is still consumed by communities in southern Yemen during periods of food scarcity [34], while O. wissmannii var. eremastrum, known as “Adhba Kalbah” in Saudi Arabia, and O. luntii, locally called “Re Eoeoon” in Oman, are also traditionally used as food sources [41].
Despite their cultural and medicinal importance, the conservation status of Arabian Orbea is of growing concern. Orbea sprengeri subsp. commutata, O. wissmannii var. eremastrum, and O. deflersiana have been identified as high-priority taxa for conservation in Saudi Arabia due to their restricted distribution and vulnerability to environmental pressures [42,43,44]. These species face threats of habitat degradation, environmental stresses [45], and soil erosion in fragile environments like the Shada Mountains [46]. Similarly, in Oman, O. nardii and O. luntii are also critically endangered, with a small population size. These species are at risk due to overgrazing, rapid infrastructure development, and road construction in their habitats, leading to their inclusion in Oman’s national red list [16]. Urgent conservation measures are needed to protect these species and preserve their genetic diversity.
Given the economic importance and threatened conservation status of Orbea species in the Arabian Peninsula, chloroplast (cp) genome sequencing provides a valuable framework for evolutionary and conservation-oriented investigations. Chloroplast genomes are particularly informative for phylogenetic and population studies due to their conserved quadripartite structure, relatively low recombination rates, and uniparental (typically maternal) inheritance, together with sufficient sequence variation to resolve relationships at inter- and intra-generic levels [47,48]. Recent plastome-based phylogenomic studies have demonstrated the effectiveness of cp genomes in resolving complex evolutionary histories, identifying maternal lineages, and clarifying taxonomic ambiguities, even in groups shaped by hybridization and polyploidy [49,50]. While plastid genomes represent a single genomic locus, their comparative analysis provides an essential foundation for evolutionary inference and conservation genomics, particularly when integrated with complementary nuclear and population-level data. For this study, O. sprengeri subsp. commutata and O. wissmannii var. eremastrum (Figure 1) were selected for plastome sequencing as they are endemic, endangered, and represent key taxa in the Arabian Peninsula’s succulent flora. Additionally, they face multiple conservation challenges, making them ideal candidates for genetic studies aimed at informing conservation strategies.
Currently, O. variegata, native to South Africa, is the only species in the genus with a complete chloroplast genome available in GenBank. To address the existing data gap for Arabian Orbea species, this study aimed to (1) assemble and annotate the complete chloroplast genomes of O. sprengeri subsp. commutata and O. wissmannii var. eremastrum; (2) characterize their genomic structure and sequence features; (3) conduct comparative analyses with available plastomes of tribe Ceropegieae; and (4) reconstruct their phylogenomic relationships within the tribe. This study will expand the genomic resources available for Arabian Orbea and provide a foundational framework for future genetic and conservation studies.
2. Materials and Methods
2.1. Plant Materials
Fresh and healthy stems of O. sprengeri subsp. commutata and O. wissmannii var. eremastrum were collected for this study in February 2023 by Mr. Essa El-Faify from the Fayfa Mountains, Saudi Arabia (17°15′51.6″ N, 43°06′44.4″ E, altitude 2200 m.a.s.l.). The plants were photographed at the collection site, and voucher specimens were preserved in 70% ethanol and stored in the spirit collection of the Umm Al-Qura University Herbarium, Department of Biology, Alzahir Campus, under accession numbers EFO3 and EFO4, respectively.
2.2. DNA Extraction, Library Construction, and Genome Sequencing
Dried stem fragments from the collected specimens were sent to Novogene Co., Ltd. (Beijing, China) for DNA extraction and sequencing. Total genomic DNA was extracted using the FastDNA™ SPIN Kit (MP Biomedicals, Irvine, CA, USA), following the manufacturer’s protocol. The purity and integrity of the extracted DNA were evaluated via agarose gel electrophoresis, while DNA concentration was measured using a Qubit Fluorometer (Thermo Fisher Scientific, Waltham, MA, USA).
For library preparation, genomic DNA was randomly sheared into fragments of ~350 bp. The fragments were subjected to end-repair, A-tailing, and ligation with Illumina adapters using the Rapid Plus DNA Lib Prep Kit for Illumina (ABclonal, Wuhan, China). Size selection, PCR amplification, and purification were performed with the AMPure XP system (Beckman Coulter, Beverly, MA, USA). The libraries were assessed for quality using the Agilent Fragment Analyzer System (Agilent Technologies, Santa Clara, CA, USA) and quantified using Qubit and qPCR. Sequencing was performed on an Illumina NovaSeq PE150 platform (Illumina, San Diego, CA, USA), generating 150 bp paired-end reads.
To ensure data quality, Fastp V.0.23.1 [51] was used to filter the raw reads. Quality control steps included (1) discarding reads with adapter contamination (>10 nucleotides aligned to the adapter with ≤10% mismatches); (2) removing reads with >10% ambiguous bases; and (3) filtering reads with >50% low-quality bases (Phred quality < 5). This process yielded 12 GB of high-quality data, constituting ~90% of the raw reads.
2.3. Genome Assembly and Annotation
Chloroplast genome assembly was conducted using NOVOPlasty v4.3.5 [52], with the O. variegata chloroplast genome (NC_079601.1) as a reference. Initial assemblies were refined by extracting the rpoC2 and ndhD genes from O. wissmannii var. eremastrum and O. sprengeri subsp. commutata, respectively. These genes were subsequently used as seeds in a second round of assembly, with the “Extend seed directly” option enabled in the NOVOPlasty configuration file. This iterative approach successfully resulted in the complete circular chloroplast genomes for both taxa.
To verify assembly accuracy, independent de novo assemblies were also generated using GetOrganelle v1.7.7.1 [53]. Paired-end clean reads were assembled using the chloroplast genome mode with default parameters, employing a multi-k-mer strategy (−k 21, 45, 65, 85, 105) and 25 extension rounds (−R 25). The word size for read recruitment was set to 112 (−w 112). The published chloroplast genome of a closely related Orbea species was used as a reference for read recruitment. Assembly graphs were visualized using Bandage v0.8.1 [54].
The assembled genomes were annotated automatically using GeSeq v2.03 [55] and further refined manually in Geneious Prime^®^ v2025.0.3 [56]. Annotation validation was performed using GB2sequin v1.0 [57] and NCBI Genome Workbench v3.9.0. Circular genome maps were generated using OrganellarGenomeDRAW v1.3.1 [58]. The final annotated plastomes were submitted to GenBank under accession numbers PQ412530 and PQ412531 for O. sprengeri subsp. commutata and O. wissmannii var. eremastrum, respectively.
2.4. Comparative Analysis of Genomic Features
At the time of preparing this research, 16 chloroplast genomes from the tribe Ceropegieae were available in GenBank, representing 11 species from the subtribe Stapeliinae, one from Heterostemminae, three from Leptadeniinae, and one from Anisotominae (Table 2). However, three of these genomes were deposited as partial sequences, each lacking one copy of the inverted repeat (IR) region, and are highlighted in gray in Table 2. Consequently, only the complete plastomes were included in the comparative genomic analyses, while the partial sequences were used only for phylogenetic reconstruction. The genomes of Duvalia velutina (MT431578.1) and Monolluma quadrangula (MT413385.1) were annotated after being downloaded from GenBank using Geneious Prime.
Together with the two newly sequenced plastomes generated in this study, a total of 15 complete chloroplast genomes were included in the comparative analysis (Table 2). Genomic features, including length, gene content, intron/exon structures, and GC content, were obtained using Geneious Prime. Codon counts, Relative Synonymous Codon Usage (RSCU), and amino acid frequency analyses were performed using MEGA v11.0.13 [59]. Heatmaps depicting codon distribution for all protein-coding genes were generated using TBtools-II v2.136 [60]. The boundaries of the large single-copy (LSC), small single-copy (SSC), and IR regions were compared across the genomes using IR-scope [61].
2.5. Nucleotide Diversity and Sequence Divergence
Nucleotide diversity (Pi) was analyzed using two datasets: (1) the complete set of 15 Ceropegieae plastomes and (2) a subset including only the three Orbea taxa. For both datasets, whole chloroplast genome sequences were aligned using MUSCLE v3.8.4 [62] implemented in Geneious Prime. To minimize overestimation of nucleotide diversity resulting from the species-specific inversion in O. wissmannii var. eremastrum, the complementary strand of the inverted region was used in the alignment. Nucleotide diversity (Pi) was then calculated in DnaSP v6.12.03 [63] using a sliding window analysis with a window length of 800 bp and a step size of 200 bp. This window size represents a compromise between resolution and statistical stability [63] and has been commonly applied in plastome-wide diversity analyses to identify highly variable regions while reducing stochastic noise.
Sequence divergence and mutational hotspot regions among 15 Ceropegieae genomes were further investigated using mVISTA [64] under the Shuffle-LAGAN alignment mode, with the O. variegata plastome serving as the reference. The Shuffle-LAGAN algorithm is specifically designed for global alignment [65,66] of genomes and has been extensively used in comparative chloroplast genome analyses to visualize coding and non-coding divergence and to identify mutational hotspots in angiosperms.
2.6. Repeat Sequence Analysis
Dispersed repeats (forward, reverse, palindrome, and complement) were identified using REPuter [67]. Simple sequence repeats (SSRs) were detected with MISA v2.1 [68], using a minimal repeat threshold of 8, 5, 4, 3, 3, and 3 for mono-, di-, tri-, tetra-, penta-, and hexanucleotides, respectively. These thresholds were selected to balance detection sensitivity and reliability, follow the default and recommended settings of MISA [68,69], and are widely applied in chloroplast genome studies to reduce false positives associated with short or low-complexity repeats.
2.7. Selection Pressure Analysis
Selection pressure on 79 common protein-coding genes was assessed across 15 chloroplast genomes of the tribe Ceropegieae. The coding sequences (CDS) were aligned using Geneious Prime, and nonsynonymous (Ka) to synonymous (Ks) substitution rate ratios (Ka/Ks) were calculated in TBtools-II using the NG method and O. variegata (NC_079601.1) as the reference sequence. A Ka/Ks ratio greater than one indicates positive selection, a ratio equal to one suggests neutral evolution, and a ratio less than one reflects purifying selection.
2.8. Phylogenomic Analysis
Phylogenomic relationships were reconstructed using a dataset of 21 chloroplast genomes, comprising 18 plastomes from the tribe Ceropegieae (Table 2) and three outgroup species from the tribe Marsdenieae—Hoya exilis Schltr. (MW719054.1), H. megalaster Warb. ex K.Schum. & Lauterb. (MW719063.1), and H. ariadna Decne. (OL754671.1). Phylogenomic analysis was conducted using a concatenated dataset of 80 protein-coding genes. Each gene was individually aligned using MUSCLE within Geneious Prime, following default parameters. The aligned sequences were subsequently concatenated into a single dataset for tree reconstruction. Maximum likelihood (ML) and Bayesian inference (BI) phylogenies were constructed using RAxML v8.2.12 [70] with 1000 bootstrap replicates and MrBayes v3.2.7 [71], respectively, utilizing the CIPRES portal [72]. The best-fit evolutionary model (GTR+I+G) was determined using jModelTest2 v2.1.6 [73]. Convergence of BI analyses was assessed in Tracer v1.7.1, with effective sample sizes (ESS) >200 considered adequate. Tree visualization and annotation were performed in iTOL v6.5.8 [74].
3. Results
3.1. General Features of the Chloroplast Genomes
The newly generated chloroplast genomes of O. sprengeri subsp. commutata and O. wissmannii var. eremastrum were fully assembled and annotated, with genome sizes of 162,017 bp and 170,054 bp, respectively. Both genomes displayed a typical quadripartite structure (Figure 2), including a large single-copy (LSC) region of 86,501 bp for O. sprengeri subsp. commutata and 85,882 bp for O. wissmannii var. eremastrum, a small single-copy (SSC) region of 13,213 bp and 4298 bp, and inverted repeat (IR) regions of 31,151 bp and 39,937 bp, respectively. Notably, O. wissmannii var. eremastrum exhibits a unique 8.4 kb bp flip-flop inversion spanning the region from ndhG to ndhF, along with a markedly 8.9 kb IR expansion into the SSC region (Figure 2). This IR expansion resulted in the duplication of several genes typically confined to the SSC region, including rps15, rpl32, ndhA, ndhF, ndhH, ndhI, and trnL-UAG. The combined effect of this inversion and IR boundary shift has led to gene relocations disrupting the organization of the ndhH–ndhD operon.
The chloroplast genome of O. sprengeri subsp. commutata encodes a total of 133 genes, comprising 88 protein-coding genes, 37 tRNA genes, and 8 rRNA genes (Table 3). In comparison, O. wissmannii var. eremastrum encodes 140 genes, including 94 protein-coding genes, 38 tRNA genes, and 8 rRNA genes (Table 3). The higher gene count in O. wissmannii var. eremastrum is primarily due to the expansion of the IR into the SSC region, resulting in the duplication of the aforementioned genes. Despite these differences in total gene number, both genomes contain the same number of unique genes—114 in total—comprising 80 protein-coding genes, 30 tRNA genes, and 4 rRNA genes.
The total length of coding sequences was 85,020 bp in O. sprengeri subsp. commutata and 90,876 bp in O. wissmannii var. eremastrum, corresponding to 52.4% and 53.1% of the genome, respectively. The remaining non-coding sequences include intergenic spacers and introns, accounting for 76,997 bp and 79,178 bp, respectively. The total GC content was nearly identical between the two species (37.7% in O. sprengeri subsp. commutata and 37.4% in O. wissmannii var. eremastrum), with the highest GC content consistently observed in the IR regions.
The chloroplast genomes of O. sprengeri subsp. commutata and O. wissmannii var. eremastrum each contain 17 unique genes with introns and exons, distributed across the LSC (12 genes), IR (4 genes), and SSC (1 gene) regions (Table 4). In O. wissmannii var. eremastrum, due to the expansion of the IR region to include ndhA, all intron-containing genes are located exclusively in the LSC and IR regions (Table 4). Among these, ycf3, trnL-UAA, and ndhA display consistent exon and intron lengths between the two taxa. The largest intron was observed in trnK-UUU (2527–2530 bp), located in the LSC region, while the longest exon was found in rpoC1 (432 bp). Most genes contain a single intron, except for ycf3 and clpP1, which contain two introns (Table 4).
The comparison of the newly assembled chloroplast genomes with 13 previously published plastomes from the tribe Ceropegieae reveals both conserved and divergent structural characteristics across its subtribes—Heterostemminae, Leptadeniinae, and Stapeliinae (Table 5). All taxa exhibit the typical quadripartite chloroplast structure consisting of an LSC, SSC, and a pair of IRs. Total genome sizes range from 158,487 bp in Pentasachme caudatum (Leptadeniinae) to 170,054 bp in O. wissmannii var. eremastrum (Stapeliinae). This variation is mainly due to differences in IR and SSC lengths. Orbea wissmannii var. eremastrum is especially notable for its significantly expanded IR region (39,937 bp) and a reduced SSC region (4298 bp), contrasting with other species, where SSC regions range from ~13,000 to over 20,000 bp.
Despite these structural variations, most taxa exhibit relatively consistent LSC lengths (~85,000–91,000 bp) and total GC content values (37.3–37.9%). Exceptions occur in the Leptadeniinae species Leptadenia pyrotechnica and P. caudatum, and Heterostemminae species Heterostemma oblongifolium, which display lower GC content in the LSC region (35.4% and 36%, respectively) and elevated IR GC content (43.2%). The proportion of coding sequences varies from 46% in M. quadrangula to 53.15% in O. variegata.
Gene counts are broadly conserved across subtribes, with most plastomes encoding 131–133 genes, including 83–88 protein-coding genes, 36–37 tRNA genes, and 8 rRNA genes. Again, O. wissmannii var. eremastrum stands out with the highest number of total genes (140) and protein-coding genes (94), largely due to gene duplications from IR expansion. Conversely, the Leptadeniinae species P. caudatum and L. pyrotechnica have the lowest gene counts (127 total; 83 protein-coding genes).
3.2. Codon Usage Analysis
The analysis of protein-coding genes and their relative synonymous codon usage (RSCU) values is shown in Table S2 and Figure 3. RSCU measures the frequency of synonymous codons encoding the same amino acid, identifying codon bias. Across all taxa, codons with RSCU > 1, considered preferred codons, predominantly end in A or U, indicating a strong A/T bias in the third codon position. For instance, codons such as UUA (leucine) and AUA (isoleucine) displayed consistently high RSCU values, reflecting a preference for these codons across multiple species. Conversely, codons with RSCU < 1, such as CGC (arginine) and GGC (glycine), were less frequently used, often ending in G or C. Codons with RSCU = 1, such as AUG (methionine) and UGG (tryptophan), showed no bias and were uniformly used in all plastomes.
On average, the protein-coding genes in the chloroplast genomes of Ceropegieae contained 52,829 to 57,035 codons, with slight variations among species. Among these, the codons encoding leucine were the most abundant. Stop codons showed clear preferences, with UAA being the most frequent across all plastomes, while UAG and UGA were less commonly utilized.
The newly sequenced chloroplast genomes of O. sprengeri subsp. commutata and O. wissmannii var. eremastrum demonstrated codon usage patterns consistent with other members of Stapeliinae. Heatmap visualization of RSCU values (Figure 3) revealed clustering of codon usage patterns among the taxa.
The analysis of amino acid frequencies across the chloroplast genomes of 15 taxa in the tribe Ceropegieae reveals consistent patterns with minor variations among species (Figure 4). Leucine was the most abundant amino acid in all plastomes, accounting for approximately 10.5–10.9% of the total codons. Other highly abundant amino acids include serine (approximately 7.6–8.0%) and isoleucine (approximately 8.2%). In contrast, the least frequent amino acids were tryptophan (approximately 1.7%) and cysteine (approximately 1.1%). Methionine, which serves as the start codon for nearly all protein-coding genes, was moderately represented at approximately 2.3–2.4%.
3.3. IR Expansion and Contraction
The comparison of IR boundaries across the 15 Ceropegieae plastomes revealed considerable variation in the contraction and expansion of the IR regions, reflecting structural diversity among species (Figure 5). In the newly sequenced plastomes of Arabian Orbea taxa, the LSC/IRb junction lies between rps19 and rpl22, while the LSC/IRa boundary is located between rpl2 and trnH-GUG. Both genomes also exhibit IR expansion into the SSC region, though the extent differs significantly. In O. sprengeri subsp. commutata, the SSC/IRa junction spans rps15, whereas in O. wissmannii var. eremastrum, the expansion is more extensive, placing the junction within ccsA and resulting in the near-complete incorporation of the SSC into the IRs, leaving only ~4 kb of SSC remaining. Similarly, the SSC/IRb boundary in O. sprengeri subsp. commutata lies between ndhF and rps15, while in O. wissmannii var. eremastrum, it falls within ccsA.
Subtribe-level comparisons revealed distinct boundary patterns, especially at the SSC/IRa junction. Plastomes of Stapeliinae generally exhibit IR expansions into the SSC that span rps15, a pattern shared by all sampled members of this subtribe except O. wissmannii var. eremastrum, which shows a more extreme expansion. In contrast, species of Heterostemminae and Leptadeniinae have SSC/IRa junctions that span ycf1. These shifts in IR boundaries have resulted in the formation of pseudogenes: rps15 pseudogenes in the IRb region of Stapeliinae species, and ycf1 pseudogenes in the IRb region of Heterostemminae and Leptadeniinae.
At the IRb/LSC junction, the rps19 gene is typically located within the LSC across most species, with minor positional variation. However, O. variegata displays IR expansion into the LSC, placing rpl22 at the IRb/LSC border. Notably, P. caudatum (Leptadeniinae) is the only species in the dataset that exhibits IR contraction, resulting in rpl23 spanning the IRb/LSC junction. Conversely, the LSC/IRa boundary is highly conserved across all species, consistently marked by the trnH-GUG gene situated entirely within the LSC region.
3.4. Identification of Variable Regions
Nucleotide diversity (Pi) was analyzed across two datasets: one including 15 Ceropegieae plastomes and another comprising only the three Orbea taxa. The Pi values, calculated across 800 bp windows, ranged from 0 to 0.0076 across the 15 plastomes and from 0 to 0.047 among the three Orbea taxa. In both datasets, the LSC region exhibited the highest sequence variability, while the IR regions were the most conserved (Figure S1). Among the protein-coding genes in the 15 plastomes, clpP (0.076) displayed the highest nucleotide diversity, followed by accD (0.073), ycf1 (0.063), and ndhF (0.050) (marked with red stars in Figure 6), making these loci key contributors to overall plastome variability. In Orbea taxa, peaks of variability were likewise concentrated in coding regions, with the highest Pi values observed for clpP (0.047), ycf1 (0.024), accD (0.018), and ycf2 (0.015). While intergenic spacer (IGS) regions generally exhibited lower nucleotide variability, certain regions, such as psbM-trnD (0.048) and rpl32-trnL (0.048) (marked with red stars in Figure 6), showed moderate levels of diversity in the 15 plastomes.
The mVISTA-based pairwise comparison of the 15 Ceropegieae chloroplast genomes, using O. variegata as the reference (Figure 6), reveals detailed patterns of conservation and divergence across coding and non-coding regions. The LSC and SSC regions show greater sequence variability compared to the IRs, which remain highly conserved. Significant peaks of nucleotide diversity are observed in several IGS regions, including psbA-trnH, ndhC-trnV, rpl32-trnL, and trnT-psbD. Among the protein-coding genes, loci such as ycf1, ycf2, clpP, and accD display notable variability; genes associated with photosynthetic functions, such as rbcL and psbA, exhibit relatively high conservation.
3.5. Repeats Identification
The analysis of simple sequence repeats (SSRs) in the chloroplast genomes of Ceropegieae species revealed substantial variation in both the total number and types of SSRs, as well as their motif frequencies, across taxa (Figure 7 and Figure S2, Tables S3 and S4). Mononucleotide SSRs were the most abundant class, with counts ranging from 152 (P. caudatum) to 191 (H. oblongifolium), and were predominantly composed of A/T motifs, reflecting the AT-biased composition of chloroplast genomes. The newly sequenced O. sprengeri subsp. commutata and O. wissmannii var. eremastrum contained 165 and 174 mononucleotide repeats, respectively. Dinucleotide SSRs, primarily represented by AT/AT motifs, were less frequent, ranging from 2 to 18, while trinucleotide SSRs, dominated by AAG/CTT motifs, varied from 2 to 23. Tetranucleotide repeats ranged from 6 to 21, with motifs such as AAAT/ATTT being the most prominent, while pentanucleotide and hexanucleotide repeats were rare, generally occurring in frequencies of 1–7.
Among the taxa, L. pyrotechnica exhibited the highest overall SSR count (230) and diversity, including rarer repeats such as pentanucleotides and hexanucleotides. Heterostemma oblongifolium also showed high SSR diversity, particularly in tetranucleotides and pentanucleotides. In contrast, Huernia keniensis had the lowest SSR count (176). The SSR profiles of O. sprengeri subsp. commutata and O. wissmannii var. eremastrum were consistent with other members of Stapeliinae, highlighting the dominance of mononucleotide A/T motifs and limited representation of higher-order repeats.
The majority of SSRs are typically concentrated in the LSC region, followed by the SSC and then the IR regions across most taxa. This general pattern also holds true for Orbea species, except for O. wissmannii var. eremastrum, which exhibits a distinct deviation—showing an unusually high number of SSRs in both IR regions and a corresponding reduction in the SSC (Figure S3). This atypical distribution aligns with the pronounced IR expansion in O. wissmannii var. eremastrum, which has incorporated large portions of the SSC into the IRs, leading to the relocation of SSRs.
The analysis of dispersed repeats revealed notable variation in the number and types of repeats, which include forward (F), reverse (R), palindromic (P), and complemented (C) repeats (Figure 8, Table S5). Forward repeats were the most abundant, ranging from 15 (H. oblongifolium) to 36 (O. variegata), with the newly sequenced O. sprengeri subsp. commutata and O. wissmannii var. eremastrum containing 25 and 20 forward repeats, respectively. Palindromic repeats were also common, ranging from 6 (O. wissmannii var. eremastrum) to 25 (C. dolichophylla, C. sunhangiana, Du. velutina, and M. quadrangula). Reverse repeats were less frequent, with counts ranging from absent to 18, the highest being in O. wissmannii var. eremastrum, while complemented repeats were the least frequent, observed in only two species, H. oblongifolium (1) and O. wissmannii var. eremastrum (5).
Dispersed repeats were distributed across a combination of protein-coding genes, tRNA genes, and IGS regions (Figure S4, Table S5). Among the protein-coding genes, ycf1 and ycf2 consistently exhibited the highest repeat counts across most species. Other protein-coding genes, such as petB, accD, petD, ndhA, rpl16, and rps15, also harbored notable repeat counts, while loci like psbB and infA contained repeats in fewer species. Additionally, dispersed repeats were identified in tRNA genes, including trnS-GCU, trnS-GGA, and trnK-UUU, which were distributed across multiple species. Palindromic repeats were frequently found in protein-coding genes like ycf1, ycf2, and accD.
A comparative analysis between the two newly sequenced plastomes revealed notable differences in the abundance and distribution of dispersed repeats. Orbea sprengeri subsp. commutata exhibited a greater number of forward repeats (25), distributed across IGS regions (21) and several protein-coding genes, including accD (2), petD (1), and ycf1 (1). Palindromic repeats were also more numerous (n = 14), all located in the IGS regions, while reverse repeats (n = 10) were likewise confined to IGS regions. No complement repeats were detected. In contrast, O. wissmannii var. eremastrum contained all four repeat types, including forward repeats, which were observed in both IGS (11) and petB (9), while palindromic (6), complemented (5), and reverse (18) repeats were limited to IGS. These patterns highlight species-specific repeat architectures, with O. sprengeri subsp. commutata showing broader distribution across both coding and non-coding regions, and O. wissmannii var. eremastrum displaying greater repeat type diversity, but with more localized distribution.
3.6. Selection Pressure
The Ka/Ks values of 79 unique protein-coding genes across 15 Ceropegieae plastomes were assessed to evaluate selection pressure (Table S6). After excluding genes with undefined or zero Ka/Ks values, 35 genes retained meaningful estimates (Figure 9). Of these, 31 genes exhibited Ka/Ks ratios below one, indicating that they were under purifying selection. Only four genes—accD, ndhE, ycf1, and ycf2—showed Ka/Ks values greater than one, suggesting that these genes may have experienced adaptive evolution. No gene exhibited a Ka/Ks ratio equal to one, indicating that none of the genes were evolving under neutral selection.
3.7. Phylogenomic Relationships
The phylogenomic relationships among 21 species of the tribe Ceropegieae and outgroup taxa were reconstructed based on 80 protein-coding genes using Bayesian inference (BI) and maximum likelihood (ML) methods. Both analyses produced identical topologies; as a result, only the ML tree is presented, showcasing well-supported branches with high bootstrap values and posterior probabilities (Figure 10). The tribe Ceropegieae was resolved as monophyletic, with distinct clades representing the subtribes Stapeliinae and Leptadeniinae.
Within Stapeliinae, the three Orbea taxa—O. sprengeri subsp. commutate, O. wissmannii var. eremastrum, and O. variegata—formed a well-supported subclade. However, O. wissmannii var. eremastrum and O. sprengeri subsp. commutata exhibiting closer evolutionary ties (posterior probabilities (PP) = 1; bootstrap (BP) = 100%), whereas O. variegata grouped more distantly within the same subclade alongside Stapelia gigantea. These species clustered within the broader Stapeliinae group, which included genera such as Desmidorchis, Huernia, Duvalia, and Monolluma. The genus Ceropegia formed a distinct group, appearing as a sister to stapeliad genera within the Stapeliinae. The subtribe Leptadeniinae, which included species such as L. pyrotechnica, L. albida, and P. caudatum, formed a distinct and well-supported clade. Anisotominae, represented by a single species, Sisyranthus trichostomus, was resolved as a sister lineage to the Stapeliinae clade. Heterostemminae, represented solely by H. oblongifolium, was positioned as the earliest diverging lineage within the tribe.
4. Discussion
The newly sequenced and annotated chloroplast genomes of O. sprengeri subsp. commutata and O. wissmannii var. eremastrum share a conserved quadripartite structure and identical gene content (114 unique genes), consistent with typical eudicots plastomes, including other members of Apocynaceae [48,75,76,77,78,79,80,81,82,83,84]. However, O. wissmannii var. eremastrum exhibits distinct plastome rearrangements, including an 8.4 kb inversion spanning ndhG to ndhF and an 8.9 kb expansion of the IR regions into the SSC. These rearrangements resulted in an increase in total plastome size, alterations in gene order, and duplication of several genes typically confined to the SSC, distinguishing it from O. sprengeri subsp. commutata and other Ceropegieae taxa.
In most higher plants, plastid DNA encodes eleven ndh genes [85,86] that produce NDH polypeptides forming the thylakoid NDH complex [87,88], which enables plants to withstand diverse terrestrial stresses and maintain photosynthetic efficiency [89]. This complex, functionally analogous to mitochondrial complex I, transfers electrons from NADH to plastoquinone [90]. Among these genes, ndhC, ndhK, and ndhJ are transcribed as a single operon (ndhC–J) within the LSC region [91], whereas ndhH, ndhA, ndhI, ndhG, ndhE, psaC, and ndhD form the ndhH–D operon in the SSC region [92]. The ndhF gene is also located in the SSC, and two identical copies of ndhB occur in the IRs (one per copy), likely transcribed independently as monocistronic mRNAs [90]. The NDH complex requires all eleven plastid-encoded subunits plus nucleus-derived components [89,93]; thus, inversions disrupting ndh operons could affect transcriptional coordination and complex assembly.
In O. wissmannii var. eremastrum, the 8.4 kb inversion disrupts the canonical ndhH–D operon (Figure 2), which may potentially influence transcriptional regulation and co-expression. Loss or pseudogenization of plastid ndh genes has occurred repeatedly and independently across diverse plant lineages. This pattern is most pronounced in heterotrophic taxa such as Orobanche and many Orchidaceae [94,95], but also in fully photosynthetic species including Pinus thunbergii [96], members of Ericaceae [97,98], Gentiana sect. Kudoa [99], some Cactaceae [100], Corydalis [101], and Capparis [102]. At present, the biological significance of the inversion observed in O. wissmannii var. eremastrum remains speculative, and it is unclear whether it represents a fixed structural feature or a rare plastome configuration. If validated, this inversion would represent the first documented case within Apocynaceae and could provide a useful system for investigating operon stability, transcriptional flexibility, and plastome evolution within the family. Targeted population-level sampling combined with long-read sequencing will be essential to determine whether this inversion reflects a stable plastome architecture, an isomeric variant, or possible plastome heterogeneity.
The total plastome sizes of O. sprengeri subsp. commutata and O. wissmannii var. eremastrum are 162,017 bp and 170,054 bp, respectively. Both fall within the range typically reported for Apocynaceae [75,103] and are comparable to the average plastome size in eudicots [104]. Variation in chloroplast genome size is generally attributed to differences in intergenic region length, expansion or contraction of IR regions, and differences in gene content [105]. In this study, the ~9 kb size difference between the two Arabian Orbea plastomes is mainly due to a large-scale expansion of the IR regions observed in O. wissmannii var. eremastrum, where each IR measures 39,937 bp. This represents a substantial increase over the typical IR size of 20–30 kb in most angiosperms [83]. In typical angiosperm plastomes, only a small portion (~1000 bp) of the ycf1 gene is duplicated in the IR [106]. However, in O. wissmannii var. eremastrum, IR expansion extends well into the SSC region, resulting in the duplication of the full ycf1, rps15, rpl32, ndhA, ndhF, ndhH, ndhI, trnL-UAG, and a pseudogenized copy of ccsA. Such large-scale IR expansions have been documented in other Apocynaceae taxa, including Alyxia sinensis from subfamily Rauvolfioideae [75] and members of the Marsdenieae tribe (Asclepiadoideae) such as Dischidia, Hoya, and Papuahoya [107,108]. Similar events have also been reported in distantly related lineages, including Plantago ovata (Plantaginaceae) [109], Asarum (Aristolochiaceae) [110], and Euphorbia (Euphorbiaceae) [111], suggesting that IR boundary dynamics are recurrent and potentially lineage-specific features of chloroplast genome evolution. The traveling of the gene from SSC or LSC to IRs or vice versa affects the rate of mutations; mostly, the genes that travel from LSC or SSC to IRs showed a low rate of evolution [103].
In contrast, O. sprengeri subsp. commutata displays a more typical IR/SSC boundary pattern, with the junction extending into rps15. This configuration is consistent with other Stapeliinae plastomes such as Desmidorchis penicillata, D. retrospiciens [80], M. quadrangula (syn. Caralluma quadrangula) [78], Ceropegia sunhangiana [112], C. longifolia, C. nilotica, C. dolichophylla, Huernia keniensis, and O. variegata [75].
Across both Orbea species, the IR/LSC boundaries were found to be more conserved than the IR/SSC boundaries, a pattern that is consistent with other Apocynaceae plastomes [75,78,80]. The evolutionary significance of IR boundary variation lies in its impact on plastome structure and gene content. Expansion of IRs can lead to gene duplications, as demonstrated in Pelargonium [113], while extreme contraction or complete loss of IRs—as observed in some Fabaceae species like Cicer arietinum [114] and in Passiflora (Passifloraceae) [115]—can result in gene loss and increased genome instability. Such structural changes can have downstream effects on genome stability, recombination frequency, and even evolutionary rates of genes [116]. Therefore, comparative analysis of IR boundaries offers valuable insight into the mechanisms of chloroplast genome evolution and the lineage-specific structural adaptations of plant plastomes.
Analyzing the intron and exon content of chloroplast genomes provides critical insights into genome evolution, RNA splicing mechanisms, and structural variations, and can yield valuable phylogenetic markers (e.g., [117,118]). In this study, examination of O. sprengeri subsp. commutata and O. wissmannii var. eremastrum revealed the presence of 17 unique intron-containing genes in each plastome, predominantly distributed across LSC and IR regions. This gene count and distribution pattern are consistent with those reported in diverse angiosperm lineages (e.g., [48,119,120]. Furthermore, several highly conserved features typical of land plant chloroplasts were observed, such as the presence of two introns within both ycf3 and clpP1, and the characteristically large intron (2527–2530 bp) associated with the trnK-UUU gene [109,121,122,123].
Codon usage analysis is a valuable tool for understanding the molecular evolution, translational efficiency, and nucleotide composition bias of plastid genomes. Each amino acid in a protein sequence may be encoded by one (as in methionine and tryptophan) to six synonymous codons, and the usage frequency of these codons can differ across species—and even among genes within the same organism [124,125]. In chloroplasts, codon usage is shaped by both mutational pressure and natural selection, and it can influence gene expression levels, protein structure, and the efficiency of translation [126,127,128]. In this study, codon usage and amino acid composition in O. sprengeri subsp. commutata and O. wissmannii var. eremastrum, along with other Ceropegieae plastomes compared, exhibited strong conservation. Preferred codons were predominantly A/U-ending, reflecting an AT-rich bias in the third codon position that is characteristic of most land plant chloroplast genomes [83,121,122,129]. This codon bias was mirrored in amino acid composition, with leucine being the most abundant (~10.5–10.9%), followed by isoleucine and serine, which are crucial for chloroplast-encoded proteins involved in photosynthesis and gene regulation [130]. Less frequent usage of codons encoding tryptophan and cysteine is consistent with their limited codon representation and functional specificity. These patterns align with findings in other species of Apocynaceae and angiosperms [78,80,121,122,131].
Mutational hotspots in chloroplast genomes—regions with elevated nucleotide diversity—are invaluable for developing DNA barcodes and resolving phylogenetic relationships [132]. In this study, six loci—accD, clpP, ndhF, ycf1, psbM–trnD, and rpl32–trnL—were identified as the most variable regions (Pi = 0.048–0.076) across Ceropegieae plastomes. These loci correspond to hotspot regions reported in other Apocynaceae plastomes [75,78,80]. While several studies have evaluated the discriminating power of conventional plastid markers in Apocynaceae (e.g., matK, rbcL, trnH–psbA, trnL–trnF) [133,134,135,136,137,138,139,140], the six highly variable loci identified here have not previously been evaluated as DNA barcodes. Traditional barcodes such as matK and rbcL exhibited low variability (Pi < 0.0025 and 0.0017, respectively), indicating limited discriminatory power for Ceropegieae. Similarly, the widely used trnL intron and trnL–trnF spacer—commonly applied in Ceropegieae phylogenetic studies [4,5,6,141,142,143,144,145]—show only moderate divergence (Pi ≤ 0.032), consistent with the findings of Alharbi [135], who also reported their limited resolution among closely related taxa.
Among the six hotspots, ycf1 and ndhF stand out: both have been proposed as superior plastid barcodes in diverse angiosperm lineages [146,147] and offer phylogenetic insight and species-level discrimination for applications in breeding [148,149,150]. AccD, encoding the acetyl-CoA carboxylase subunit D [151], has aided species delimitation in genera like Hexachlamys [152] and Chamaecyparis [153], although its use can be complicated by mitochondrial or nuclear paralogs [154]. Likewise, clpP, a plastid protease subunit, evolves rapidly in certain angiosperm lineages [155] and has been used as a barcode in Actinidiaceae [153], Dracaena [156], and Prunus [157], though its long sequence length can pose practical amplification challenges [156].
The intergenic spacers psbM–trnD and rpl32–trnL have also demonstrated high species-resolution capacity in various taxa, including Panax [158], Astragalus [159], Acacia [160], and Leptochloa [161], especially when used in combination with other markers. However, these regions often require careful alignment due to high sequence divergence and potential structural variation. Collectively, these six highly variable loci reflect a broader evolutionary pattern in which elevated substitution rates are localized to specific plastid regions rather than occurring uniformly across the genome [155]. Recent syntheses of plant organellar genome evolution emphasize that such localized mutation hotspots arise from the interaction of DNA repair mechanisms, functional constraints, and selection, rather than from genome-wide increases in mutation rates [162]. In this context, the candidate loci identified in this study lay the groundwork for future targeted DNA barcode validation research within the tribe Ceropegieae, particularly among morphologically challenging and closely related species.
Simple sequence repeats (SSRs), also known as microsatellites, consist of short DNA motifs (1–6 bp) that occur in tandem and are widely applied in DNA barcoding, population-level analyses, and phylogenetic research because they are highly variable and typically codominant [163,164,165]. In chloroplast genomes, SSR loci generally originate from replication slippage or errors that arise during repair or recombination events [166]. The composition and distribution of these repeats can provide insights into evolutionary patterns and may distinguish lineages or genera [167,168,169]. In the present analysis, mononucleotide SSRs were the most common repeat class detected across all plastomes, with A/T motifs being the most prevalent—a trend consistent with earlier reports from land plants [121,122,164,170,171].
Dispersed repetitive DNA sequences, another important class of plastid genome repeats, were also identified and are known to play a significant role in genome rearrangements and structural variation [172,173]. In addition, they may influence nucleotide substitution rates, thereby contributing to the evolutionary dynamics of the plastome [174]. Orbea wissmannii var. eremastrum exhibited a species-specific repeat profile, characterized by a higher number of reverse repeats (n = 18) and the presence of five complemented repeats, which were completely absent in O. sprengeri subsp. commutata and other closely related Stapeliinae taxa. This distinct repeat architecture distinguishes O. wissmannii var. eremastrum from its relatives, where forward and palindromic repeats are typically more abundant. In all examined species, most repeats were concentrated in IGS regions—a distribution pattern commonly observed in previous plastome studies [175,176]. These findings underscore the potential of SSRs and dispersed repeats as valuable resources for assessing genetic diversity and evolutionary divergence within Orbea species.
The Ka/Ks ratio (also referred to as dN/dS or ω) is a key metric used to infer the nature and strength of selective pressures on protein-coding genes. A Ka/Ks ratio <1 indicates purifying selection, where deleterious amino acid changes are eliminated, maintaining functional conservation. A ratio of 1 suggests neutral evolution, while values >1 indicate positive selection, where beneficial mutations are favored [177,178,179]. Analysis of 79 protein-coding genes across 15 Ceropegieae plastomes revealed that most genes are under strong purifying selection, reflecting their essential roles in plastid function. Notably, no genes were found to be evolving neutrally. However, four genes—accD, ndhE, ycf1, and ycf2—exhibited Ka/Ks ratios >1, indicating signals consistent with positive selection. The potential functional and adaptive significance of these genes is discussed below in a hypothesis-driven context, in relation to their known roles in plastid metabolism and stress adaptation.
The accD, which encodes a subunit of the plastid acetyl-CoA carboxylase complex critical for fatty acid biosynthesis [180], showed evidence of accelerated evolution. This gene has also been reported to evolve rapidly in Medicago ruthenica [181], Ficus [182], and cupressophytes [180], often due to repetitive sequence insertions that contribute to both high substitution rates and genome rearrangements. In Ceropegieae, many of which are succulents inhabiting arid environments, such selection on accD may reflect adaptive modifications in lipid metabolism that enhance membrane stability, cuticular wax formation, or water retention.
Similarly, ndhE, part of the NADH dehydrogenase complex involved in cyclic electron flow and chlororespiration [89], exhibited Ka/Ks patterns consistent with positive selection. This may suggest potential fine-tuning of photosynthetic energy balance under stress conditions such as drought or fluctuating light, consistent with the ecological niches of Ceropegieae. Unlike its loss in some non-photosynthetic plants [84], selection on ndhE here may indicate adaptive maintenance associated with stress resilience.
ycf1, one of the largest and most variable chloroplast genes, although its precise function has been a subject of debate, has been identified as Tic214, a vital component of the Arabidopsis TIC (Translocon at the Inner Chloroplast envelope) complex [146]. Despite its conserved function, ycf1 displays high sequence variability and has been identified as putatively positively selected in Ficus [182], Caragana [183], and Medicago ruthenica [181]. In Ceropegieae, elevated Ka/Ks values for ycf1 may reflect adaptive changes in plastid protein trafficking, potentially enhancing import specificity or efficiency under environmental stress.
ycf2, the largest plastid gene in angiosperms, is unequivocally identified as a functional gene whose products are essential for cell survival and plant viability [184], and also showed signatures consistent with adaptive evolution. Similar selection has been documented in Cerasus [185] and Zingiberaceae [186], where it is associated with adaptations to varying light conditions. In Ceropegieae, elevated Ka/Ks values for ycf2 may be associated with optimization of ATP-driven protein transport in response to the energy demands of plastid function under arid or fluctuating light conditions. Collectively, while most plastid genes remain under purifying selection, accD, ndhE, ycf1, and ycf2 may contribute to evolutionary flexibility, enabling persistence in diverse and challenging habitats.
Recent advances in phylogenomics—driven by the increasing accessibility of high-throughput sequencing—have substantially improved the resolution of plant evolutionary relationships compared with earlier approaches based on one or a few loci [187,188]. During the Sanger sequencing era, commonly used markers such as rbcL and matK provided broad phylogenetic frameworks (e.g., [189,190], culminating in the Angiosperm Phylogeny Group classification [191]. However, phylogenies inferred from a limited number of loci often yielded weakly supported or conflicting topologies due to rate heterogeneity and locus-specific evolutionary histories [192,193,194]. Plastome-scale datasets, owing to their conserved structure, compact genome size, and relatively low recombination rates [195,196], represent a powerful resource for plastid-based phylogenomic inference and hypothesis generation across diverse plant lineages [188]. Nevertheless, because plastid genomes constitute a single, typically maternally inherited locus [197,198], plastome-based phylogenies may be influenced by processes such as chloroplast capture, introgression, or incomplete lineage sorting [199,200,201], and should therefore be interpreted as reflecting plastid evolutionary histories rather than definitive species relationships.
In the present study, phylogenomic analysis of 21 plastomes produced a well-resolved plastid phylogeny of tribe Ceropegieae, with strong support for major nodes (Figure 10). The inferred relationships among subtribes are broadly congruent with previous hypotheses based on limited gene regions [4,5], but with significantly improved resolution. Within this plastid framework, Orbea taxa were placed within a well-supported clade corresponding to the stem-succulent stapeliads of subtribe Stapeliinae. However, the three Orbea plastomes did not form a monophyletic group: the newly sequenced Arabian taxa (O. sprengeri subsp. commutata and O. wissmannii var. eremastrum) were recovered as sister lineages, whereas O. variegata from South Africa was resolved in a separate clade with Stapelia gigantea. This pattern is consistent with earlier multilocus analyses indicating that relationships among Orbea species may be more closely associated with geographic structure than with floral morphology [6]. Similar biogeographic structuring has been reported in other succulent lineages, including Huernia [6], Erica L. [202], and Euphorbia subg. Athymalus [203]. While such patterns may reflect historical diversification across distinct ecological regions, these interpretations should be regarded as hypotheses that require explicit testing using nuclear genomic data and functional approaches.
From a conservation perspective, the plastome data generated here provide immediately applicable genomic resources for species identification, phylogenetic placement, and the development of informative plastid markers for Orbea, particularly endemic and threatened Arabian taxa. These data may support conservation planning by facilitating accurate taxonomic delimitation, identifying evolutionarily distinct lineages, and informing the selection of priority taxa for further genetic study in the Arabian Peninsula. In the longer term, integration of plastome data with nuclear genomic datasets, population-level sampling, and ecological information will be essential to refine species boundaries, assess gene flow, and robustly evaluate adaptive hypotheses across Orbea and allied Ceropegieae lineages.
5. Conclusions
This study provides the first complete chloroplast genomes of two Arabian Orbea taxa—O. sprengeri subsp. commutata and O. wissmannii var. eremastrum—and offers new insights into plastome structure, variation, and evolutionary placement of these taxa within the tribe Ceropegieae. Despite the limited taxon sampling within Orbea (only three plastomes out of over 60 described species), the findings reveal unique structural features specifically in the Arabian taxon O. wissmannii var. eremastrum, including a flip-flop inversion spanning ndhG to ndhF and extreme IR expansion, which contribute to plastome size variation, gene rearrangements, and gene duplication. The observed structural divergence in this taxon may be a sign of plastome heteroplasmy, prompting further investigation through broader population-level sampling. Although the current data set does not allow for broad generalizations across the genus Orbea, the results highlight the genomic distinctiveness of Arabian Orbea taxa analyzed here relative to the only previously sequenced African representative (O. variegata). Expanding plastome samples across Orbea is essential to capture its full genomic diversity and to clarify evolutionary trends within Ceropegieae. Within this context, the present study lays a foundation for future plastid phylogenomic, DNA barcoding, and conservation research of arid-adapted Arabian Orbea taxa.
The reference list from the paper itself. Each links out to its DOI / PubMed record.
- 1Liede-Schumann S. The Apocynaceae TEN (Taxonomic Expert Network)TAXON 2024731130113910.1002/tax.13220 · doi ↗
- 2Endress M.E. Meve U. Middleton D.J. Liede-Schumann S. Apocynaceae Flowering Plants. Eudicots: Apiales, Gentianales (Except Rubiaceae) Kadereit J.W. Bittrich V. Springer International Publishing Cham, Switzerland 2018207411
- 3Endress M.E. Liede-Schumann S. Meve U. An updated classification for Apocynaceae Phytotaxa 201415917519410.11646/phytotaxa.159.3.2 · doi ↗
- 4Meve U. Liede S. Subtribal division of Ceropegieae (Apocynaceae-Asclepiadoideae)TAXON 200453617210.2307/4135489 · doi ↗
- 5Meve U. Heiduk A. Liede-schumann S. Origin and early evolution of Ceropegieae (Apocynaceae-Asclepiadoideae)Syst. Biodivers.20171514315510.1080/14772000.2016.1238019 · doi ↗
- 6Bruyns P.V. Klak C. Hanáček P. Evolution of the stapeliads (Apocynaceae–Asclepiadoideae)—Repeated major radiation across Africa in an Old World group Mol. Phylogenet. Evol.20147725126310.1016/j.ympev.2014.03.02224721383 · doi ↗ · pubmed ↗
- 7Bruyns P.V. Stapeliads of Southern Africa and Madagascar Umdaus Press Pretoria, South Africa 2005 Volume 1330
- 8Bruyns P. Klak C. Hanáček P. A revised, phylogenetically-based concept of Ceropegia (Apocynaceae)S. Afr. J. Bot.201711239943610.1016/j.sajb.2017.06.021 · doi ↗