Ecological Drivers of Vertebrate Richness and Implications for Inland Wetland Survey in Korea
Yein Lee, Minkyung Kim, Jae Geun Kim, Sangdon Lee

TL;DR
This study examines how environmental factors influence vertebrate species richness in Korean wetlands and highlights the need for standardized data collection to improve conservation efforts.
Contribution
The study compiles and analyzes long-term wetland survey data to identify ecological drivers of vertebrate richness and advocates for standardized data protocols.
Findings
Species richness is higher in larger wetlands with healthier vegetation.
Standardized reporting formats and metadata are needed to enable effective long-term analysis.
Wetland area and NDVI positively correlate with species richness across all vertebrate groups.
Abstract
The Republic of Korea has conducted inland wetland surveys for more than 20 years. However, much of the information is available mainly in report documents, which makes cross-site comparison and long-term analysis difficult. We compiled 134 survey reports published between 2000 and 2021, calculated species richness for amphibians/reptiles, birds, and mammals in each wetland, and tested how richness relates to climate, topography, land use, and water quality. Species richness was generally higher in larger wetlands and where vegetation was healthier, and these patterns remained after accounting for spatial structure. Yet the report-based data is not sufficiently standardized, limiting reuse and the ability to track change over time. These results support the need for standardized survey records and an integrated, analysis-ready national wetland database. Wetlands have been recognized as…
Click any figure to enlarge with its caption.
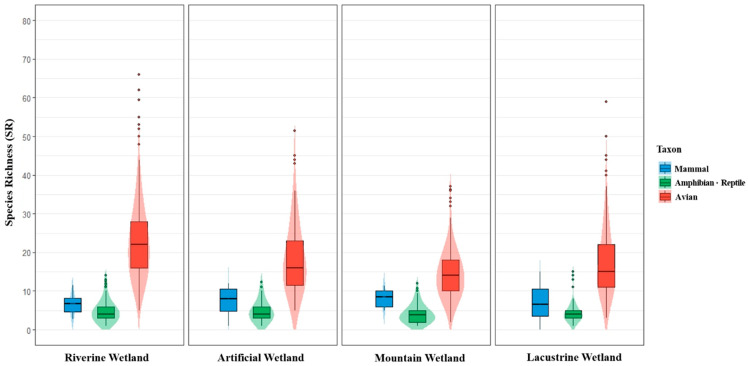 Figure 1
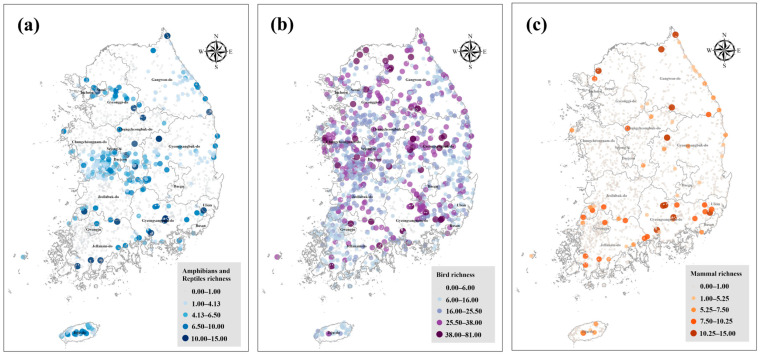 Figure 2
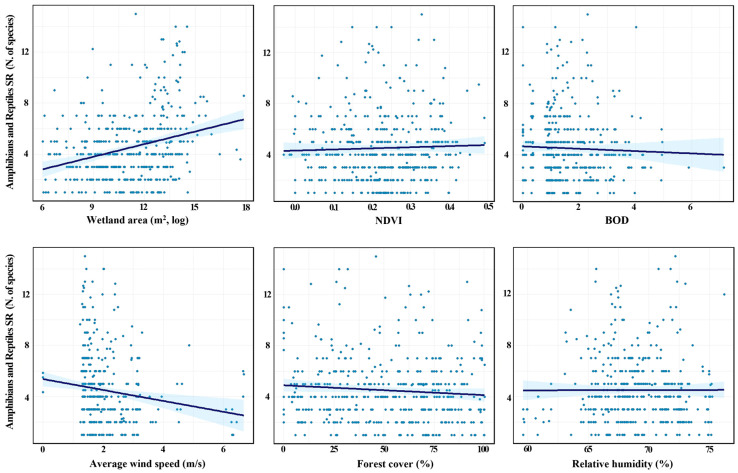 Figure 3
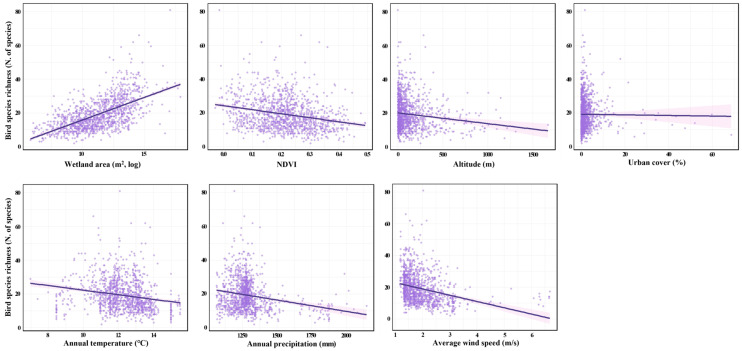 Figure 4
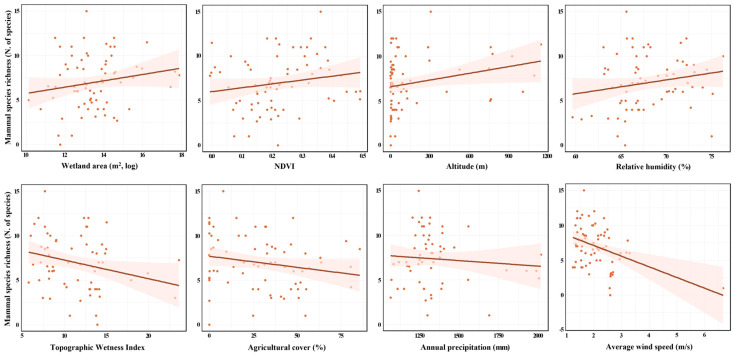 Figure 5
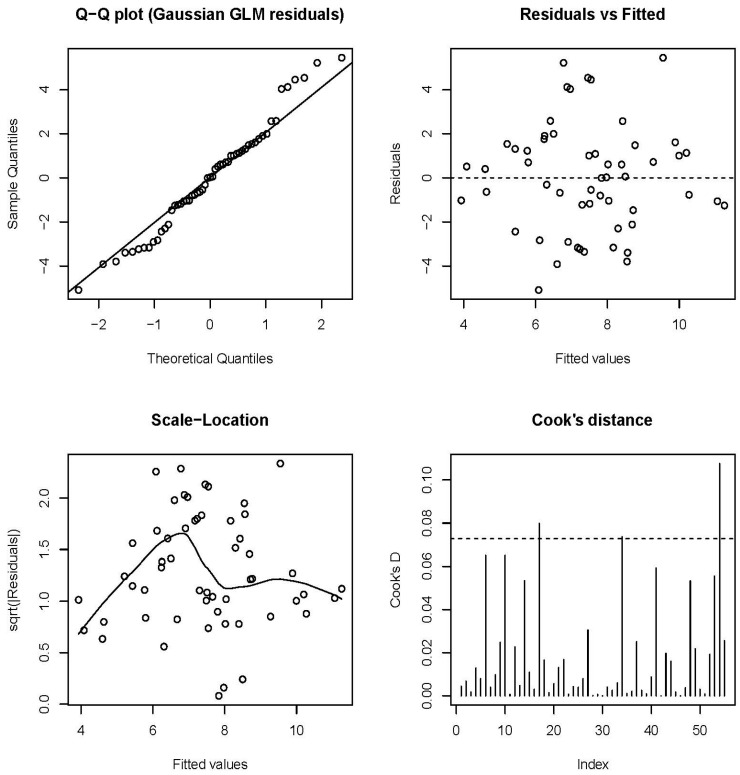 Figure 6
| Category | Variables | Unit | Range | Source |
|---|---|---|---|---|
| Wetland | Wetland area (log) | m2 | 4.16–17.93 | Wetland inventory 2704 [ |
| Wetland type | Four types (riverine, artificial, mountainous, lacustrine) | Wetland inventory 2704 [ | ||
| Topographic | Altitude | m | 0–1670 | SRTM DEM 30 m [ |
| Aspect | Unitless index | −1.00–1.00 | SRTM DEM 30 m [ | |
| TWI | Unitless index | 5.19–26.07 | SRTM DEM 30 m [ | |
| Land use/ | Urban cover | % | 0–75.6 | Land-cover map [ |
| Agricultural cover | % | 0–95.41 | Land-cover map [ | |
| Forest cover | % | 0–100 | Land-cover map [ | |
| NDVI | Unitless index | −0.30–0.50 | NDVI/LANDSAT 8 [ | |
| Climate | Annual temperature | °C | 6.97–15.87 | Bioclim_BIO1 [ |
| Annual precipitation | mm | 1060–2170 | Bioclim_BIO12 [ | |
| Relative humidity | % | 59.65–79.57 | Climatological normals 91′–20′ [ | |
| Average wind speed | m/s | 1.18–6.69 | Climatological normals 91′–20′ [ | |
| Water | BOD | mg/L | 0–7.14 | Water-quality monitoring 16′–23′ [ |
| Water temperature | °C | 0.02–21.21 | Water-quality monitoring 16′–23′ [ |
- —Korea Environmental Industry and Technology Institute (KEITI)
- —G-LAMP Program of the National Research Foundation of Korea (NRF)
- —National Research Foundation of Korea (NRF)
Peer Reviews
No public reviews on file for this paper yet. If you reviewed it on a platform where reviews are public (OpenReview, ICLR, NeurIPS, ICML), you can paste yours below so the community can read it here.
Videos
No videos yet. Explain this paper in a talk, walkthrough, or lecture? Add one.
Taxonomy
TopicsEcology and Conservation Studies · Species Distribution and Climate Change · Environmental Conservation and Management
1. Introduction
Wetlands are areas that are flooded or saturated with water for extended periods, keeping the soil moist and supporting vegetation adapted to these conditions [1,2,3]. The productivity of wetlands rivals that of tropical rainforests and coral reefs [4,5], providing essential water and habitats for numerous plant and animal species [6]. In addition, wetlands are recognized as indispensable ecosystems in the context of the climate crisis because they deliver a broad range of ecosystem services, including carbon storage, water purification, flood mitigation, freshwater provision, and groundwater recharge [6,7]. Accordingly, under the Ramsar Convention, the international community emphasized and protected the ecological and social values of wetlands. In line with these global trends, the Republic of Korea also enacted the Wetlands Conservation Act in 1999 and has conducted statutory wetland surveys since 2000.
Nature-based solutions that leverage nature’s capacity to address and mitigate climate crises have recently gained significant attention. Wetland ecosystems are recognized as crucial to this approach [8,9,10]. However, in Korea, recognition of the importance of wetlands for biodiversity conservation and ecosystem services has increased in recent years, yet national-scale studies integrate wetland biodiversity patterns with environmental drivers remain limited [10,11]. In particular, non-standardized survey datasets have constrained robust cross-site comparisons and long-term synthesis.
Wetlands are complex ecosystems in which climate, soil, and hydrological conditions are tightly interconnected [12,13]. Inland wetlands occurring along lakes and rivers, in mountainous areas, and on lowland floodplains function as ecotones between terrestrial and freshwater environments [2]. Owing to their shallow water depth, high soil moisture, and proximity to groundwater, their hydrological and water-quality conditions respond to changes in surrounding land use and precipitation. Wetland-associated terrestrial vertebrate species richness is generally shaped by habitat size and heterogeneity, landscape structure, and climatic constraints. Therefore, at the national scale, standardized, analysis-ready datasets that enable quantitative assessment of key ecological drivers and biotic variation across wetlands are essential, as they provide an evidence base for conservation priorities. Particularly at the policy stage, prioritizing wetland restoration and conservation or assessing ecosystem service values requires a standardized national-level database [6,14,15,16]. Such a database can serve as a core foundation linking long-term monitoring, research, and management.
This study reviews the status and potential applications of national-level wetland data and quantifies key ecological drivers of terrestrial vertebrate species richness focusing on statutory inland wetland survey datasets in Korea. First, we examine the scope and organization of inland wetland survey data compiled at the national level, including their structure and schema. Second, this study examines whether the established data are sufficiently standardized and quantified to be practically employed in applied and statistical studies, identifying problems uncovered during the analysis process. Third, for the quantitative analysis, this work applies generalized linear models (GLMs) and generalized additive models (GAMs) by integrating inland wetland biota data with public environmental data (e.g., climate, topography, and soil) to assess the effects of external environmental factors on patterns of terrestrial vertebrate taxa. Because observations may be spatially structured at the national scale, we test for spatial autocorrelation in model residuals and, where needed, use spatially explicit models to avoid inflated inference. Finally, based on structural limitations identified through this analysis, we propose standardization and technical improvements to support the future development of a nationally integrated wetland database.
2. Materials and Methods
2.1. Study Area
The study area comprises the Republic of Korea, in the southern part of the Korean Peninsula in East Asia (33°06′ to 38°45′ N, 124°11′ to 131°52′ E). The total peninsular area is 100,364 km^2^ [17], of which 70% comprises mountainous terrain [17]. The Republic of Korea has a temperate monsoon climate. During winter, this area is influenced by continental cold and dry air masses, whereas in summer, it is affected by maritime warm and humid air masses. The annual average temperature ranges from about 10 °C to 15 °C, and the annual average precipitation is between 1000 and 1800 mm [18].
Korea has been conducting statutory surveys by classifying wetlands as inland or coastal wetlands (tidal flats) [19]. According to the Wetlands Conservation Act of Korea, inland wetlands include freshwater wetlands such as lakes, marshes/swamps, rivers, and river estuaries (river mouths), whereas coastal wetlands refer to intertidal flats between the high and low-tide water marks [2,19]. This study focuses on the analysis of inland wetlands. The analysis covers all inland wetlands in South Korea (2704 sites, 1153.4 km^2^), including riverine (1326 sites, 990.7 km^2^), lacustrine (635 sites, 99.0 km^2^), mountainous (466 sites, 13.8 km^2^), and artificial (277 sites, 49.9 km^2^) wetlands [2].
2.2. National Inland Wetland Survey Data: Compilation and Standardization Assessment
We reviewed the statutory National Inland Wetland Survey (NIWS) to understand the current status and characteristics of the data structure. Inland wetlands are conserved and managed under the Wetland Conservation Act (1999) [20]. Although several agencies undertake site or jurisdiction-based monitoring, the National Institute of Ecology (NIE) Wetland Center provides the only continuous, nationwide survey dataset with a consistent reporting framework [2], making it the primary source for cross-site comparisons and standardization assessment in this study.
To understand the NIWS framework (survey components, scope, and cycle), we analyzed the Inland Wetland Survey Guidelines (2021) [21]. We then evaluated the availability, accessibility, and usability of the dataset accumulated through the NIWS. We manually digitized wetland-level biotic records from 134 NIWS reports and compiled them into an Excel database. To assess data availability and the level of standardization, we examined the datasets available for download from EcoBank (as of October 2025) and compared whether key metadata present in the original reports were retained in the downloadable datasets. The assessment covered both data availability (e.g., bulk-download availability and linkage to wetland history/records) and the presence of key metadata required for analysis.
2.3. Response Variables (Species Richness)
Species richness (SR), defined as the number of unique species recorded per wetland (presence-based), regardless of individual counts, was used as the response variable in this study. This study targets terrestrial vertebrates, including amphibians/reptiles, birds, and mammals, and independent analyses were conducted for each taxonomic group. Wetlands are a transitional zone between terrestrial and aquatic systems [9,22] and are characterized by complex interactions between the climate, soil, and hydrological factors. Terrestrial vertebrates were selected as the subject taxon for this study because they move between wetlands and the surrounding areas, participating in reproduction, predation, and material cycling [23,24]. These vertebrates are comprehensively affected by environmental conditions, including wetland landscape, hydrology and water quality, habitat connectivity, and surrounding land use.
Amphibians/reptiles primarily inhabit wetlands. Due to their low mobility, they are sensitive to changes in wetland water quality, depth, and temperature, and they can indirectly reflect the health of the wetland micro-environment [23]. In this study, amphibians and reptiles were grouped into a single category for analysis based on the raw data classification. Birds respond sensitively to structural complexity, vegetation cover, open water area, and hydrological connectivity [25]. In addition, birds use diverse habitats and travel long distances, and the wetland size and surrounding landscape influence their distribution. Finally, mammals create diverse microhabitats and increase spatial heterogeneity through various activities, such as foraging, predation, and burrowing, leading to cascading changes in associated biological communities [26]. In addition, because mammals mediate energy flow and primarily correspond to higher trophic levels in food chains [26,27], they can serve as indirect indicators of habitat health.
Species data for taxonomic groups were extracted and employed based on the results of biota surveys documented in NIWS reports (2000 to 2021, N = 134). Portable document format (PDF) reports were compiled into an Excel database, and data preprocessing focused on correcting errors and excluding ambiguous records. The taxonomic groups (e.g., bird data included in the mammal taxonomic data) were separated and removed. Species names were standardized based on the National Species List of Korea from the National Institute of Biological Resources to eliminate confusion due to synonyms and historical names. In addition, wetland data reconstructed into the Excel database were removed if they did not match the current wetland names or contained missing values.
Wetland surveys select target wetlands according to annual and regional plans. Therefore, although some wetlands may be resurveyed for history tracking and re-evaluation, the same wetlands are not repeatedly surveyed every year (The number of surveyed wetlands included in this study is summarized in Appendix A Table A1 by year and taxonomic group). Accordingly, this study was designed as a nationwide cross-sectional assessment rather than a time-series analysis. To avoid disproportionate influence from a small number of repeatedly surveyed wetlands, species richness was summarized at the wetland level by averaging year-specific richness values to derive mean species richness (SR_mean). Final sample sizes were 432 wetlands for amphibians/reptiles, 1183 wetlands for birds, and 72 wetlands for mammals.
2.4. Environmental Explanatory Variables
The explanatory variables in the statistical analysis were selected by reviewing the Inland Wetland Survey Guidelines (2021) [21] from the NIE and previous literature. We compiled survey items potentially associated with SR from the Guidelines and previous literature by taxonomic groups and retained only variables that could be constructed from publicly available national data. Data sources and access links for each variable are provided in Table 1 and the corresponding references.
The explanatory variables were categorized into five types: wetland information, topography, land use, climate, and water environment. In total, 15 environmental variables were selected (Table 1). Wetland information represents the area and type of each wetland, whereas topographic factors (digital elevation model [DEM], aspect, and Topographic Wetness Index [TWI]) describe the wetland topography and hydrological characteristics. Land-use/land-cover variables (urban [built-up/developed area], agricultural, and forest cover and the Normalized Difference Vegetation Index [NDVI]) characterize the landscape structure around wetlands. NDVI was obtained from the Landsat-based NDVI product (30 m) distributed by the Korea Institute of Geoscience and Mineral Resources (KIGAM) for 2019. NDVI was summarized using zonal statistics, calculating the mean value within each wetland boundary polygon. Because wetland polygons often include open-water surfaces (NDVI near zero or negative), polygon-mean NDVI can be lower than values typically reported for terrestrial vegetation. Climate factors, including annual temperature, precipitation, relative humidity, and wind speed, describe habitat conditions. Water environment factors (biochemical oxygen demand [BOD] and water temperature) reflect water-quality characteristics. Environmental predictors were compiled from the best-available national layers, each representing a specific reference period (e.g., a representative year, climate normals, or multi-year averages); the source period, aggregation, and the rationale for using the corresponding reference period for each layer are provided in Appendix A Table A2). These layers were used to characterize typical site conditions for cross-sectional inference, and we avoided interpreting the fitted models as year-wise changes in SR.
All variables were constructed in ArcGIS Pro [28]. Table 1 summarizes the units, ranges, and sources of each variable. For continuous variables, the final variables were selected after reviewing multicollinearity (VIF < 5). Wetland area was log-transformed to mitigate scale effect.
2.5. Statistical Analysis
This study first explored bivariate relationships using scatterplots with ordinary least squares trend lines for visualization only, to identify candidate environmental associations of terrestrial vertebrate SR in wetlands. This work applied GLMs and GAMs with SR as the response variable to estimate the effects of the explanatory variables. Due to differences in ecological characteristics and the data distribution of taxonomic groups, the models were constructed independently for each group (amphibians/reptiles, birds and mammals).
The general form of the GLMs is as follows:
In this equation, g(∙) denotes the link function, u_i_ is the expected SR for wetland i, a is the intercept, X_ik_ is the kth environmental variable (explanatory variable) for wetland i, and β_k_ is the corresponding regression coefficient. During model fitting, overdispersion was evident for amphibians/reptiles (N = 432) and birds (N = 1183); therefore, we used negative binomial models with a log link. For mammals (N = 72), we fitted a Gaussian GLM with an identity link because mammal SR showed continuous variation with little evidence of overdispersion unlike the amphibian/reptile and bird data. Model assumptions were evaluated using standard residual and influence diagnostics (Appendix A Figure A1). Across all wetlands with mammal SR data, zero values were rare; therefore, zero-inflated count models were not pursued. As a sensitivity check, we compared the Gaussian model with count-family alternatives fitted to an integer version of the response (Appendix A Table A3).
Spatial autocorrelation was assessed using Moran’s I on model residuals with a k-nearest neighbor spatial weights matrix (k = 8, row-standardized) and Monte Carlo permutation tests (1000 simulations). Sensitivity to neighborhood size was evaluated using k = 6 and 10, yielding consistent inference (Appendix A Table A4). Residual Moran’s I indicated significant positive spatial autocorrelation for the bird and amphibian/reptile negative binomial GLMs (NB-GLMs). Therefore, we refitted these two models as negative binomial generalized additive models (NB-GAMs) by adding a two-dimensional smooth of geographic coordinates, specified as s(Xm, Ym, k = 80) with smoothing parameters estimated by restricted maximum likelihood (REML) to capture broad-scale spatial structure. Moran’s I was recalculated on GAM residuals to confirm that spatial autocorrelation was mitigated. For mammals, residual Moran’s I was not significant; therefore, the Gaussian GLM was retained without an added spatial smooth.
All models considered the 15 explanatory variables summarized in Table 1. Stepwise model selection based on Akaike information criterion (AIC) was used to derive a parsimonious final model. Model fit was assessed using AIC and residual deviance, and explanatory power was quantified as explained deviance:
For each taxonomic group, we reported statistical significance of predictors in the final selected model at p < 0.05. All statistical analyses were performed in R v4.5.1 [36].
3. Results
3.1. Data Availability and Standardization Gaps in the Inland Wetland Dataset
This analysis evaluated the provision status, accessibility, usability, and standardization of datasets accumulated through NIWS. The findings reported below are based on datasets that could be retrieved as of October 2025.
The final output of the NIWS is the Inland Wetland Survey Reports published since 2000. A total of 154 volumes were produced between 2000 and 2024. These reports contain comprehensive wetland survey information, including wetland status, biota survey results covering more than 11 taxonomic groups, topography, sediment characteristics, and water-quality measurements (Appendix A Table A5). They also provide field-specific in-depth investigations, detailed raw field data, and evaluations and recommendations for conservation management. However, this information is provided in document format, limiting its direct reuse for quantitative analyses that require standardized analysis ready tables [37,38,39].
Data compiled through the NIWS are provided through EcoBank, operated by the NIE (nie-ecobank.kr). Reports from 2019 to 2024 are directly accessible via EcoBank, whereas reports compiled from 2000 to 2018 are distributed across public archives. Table 2 summarizes the formats and attributes of contents currently available. In practice, EcoBank mainly provides polygon spatial layers for inland wetlands (.shp) and associated map-based services and selected outputs such as species lists (.xlsx), vegetation map (.shp), and report files (.pdf).
Critically, EcoBank-downloadable tabular biota datasets represent only a subset of the report-based survey outputs (Table 2) and are heavily focused on species occurrence/abundance records. While the original NIWS reports include core metadata (e.g., survey dates, methods, site information, and survey frequency) that would support reconstruction of temporal structure and effort-aware interpretation, the downloadable datasets typically retain only a limited set of attributes. This simplification results in the loss of analysis-critical metadata such as survey dates, transect/segment identifiers, occurrence locations, survey frequency, and sampling effort. Consequently, time series cannot be reconstructed (e.g., by year, season, or month), and effort correction is not possible, raising concerns about bias in relative comparisons of abundance or occurrence across wetlands. Overall, these gaps constrain the usability of the current NIWS-derived datasets for a broad range of quantitative and applied research.
3.2. Baseline Patterns of Species Richness Across Inland Wetlands
Based on data from the NIWS established to date, we conducted a baseline analysis to describe the fundamental status and SR patterns of inland wetlands. We analyzed 134 reports published from 2000 to 2021 and calculated the SR as the number of species recorded per wetland. The range and distributional shape of the wetland SR by taxonomic group were examined using boxplots and violin plots (Figure 1). Figure 2 maps wetland SR onto the national wetland layer (N = 2704 sites).
For terrestrial vertebrates, SR was calculated as the number of species surveyed in each wetland. The number of wetlands included for each taxonomic group varied depending on data availability and preprocessing results. SR was calculated for 432 wetlands for, 1183 for birds, and 72 for mammals.
Amphibian/reptile SR ranged from 1 to 15 species (Mean = 4.5 (±2.7)) and was predominantly concentrated in riverine and lacustrine wetlands in major river systems, such as the Han, Geum, and Nakdong Rivers (Figure 2a). Among wetlands in the top 10% of amphibian/reptile SR (SR ≥ 8, N = 48), riverine wetlands accounted for 54% (N = 26), mountain wetlands for 20.8% (N = 10), artificial wetlands for 14.6% (N = 7), and lacustrine wetlands for 10.4% (N = 5; Figure 1). Furthermore, wetlands with top-10% amphibian/reptile SR were predominantly lowland sites at average elevations of 0 to 700 m, except for a single mountain wetland on Jeju (Sumunmulbangdui Wetland; elevation 1006 m). This pattern was concentrated at lower elevations relative to the overall elevation range of all wetlands (0 to 1670 m).
Among terrestrial vertebrate taxa, birds exhibited the widest SR range, from 2 to 81 species (Mean = 19.22 (±9.3)). Spatially, bird SR was widely distributed nationwide (Figure 2b). Among wetlands in the top 10% of bird SR (SR ≥ 31, N = 118), 70.3% (N = 83) were riverine wetlands (Figure 1), with high concentrations along the Nakdong Rivers and Western Coastal estuaries. Other wetland types followed in the order of lacustrine wetlands (13.6%, N = 16), artificial wetlands (10.2%, N = 12), and mountain wetlands (5.9%, N = 7). The highest SR within each wetland type was recorded at Cheonsu Bay Estuary Wetland (riverine; SR = 81), Mungyeong Doline Wetland (lacustrine; SR = 59), Sangju Gonggeomji Wetland (artificial; SR = 51.5), and Jeongeup Wolyeong Wetland (mountain; SR = 37). Each of these wetlands exhibited the highest SR within its respective wetland type.
Finally, mammal SR ranged from 0 to 15 species (Mean = 7.1 (±3.0)). Mammal richness was predominantly high in wetlands in northern Gangwon Province, eastern Gyeongsangbuk-do and Gyeongsangnam-do, and southern Jeollanam-do. Conversely, low SR values were observed in the Seoul metropolitan area and central inland regions (Figure 2c). Among wetlands with 10 or more recorded species (N = 15), mountain wetlands accounted for 40.0% (N = 6), riverine wetlands for 26.7% (N = 4), lacustrine wetlands for 20.0% (N = 3), and artificial wetlands for 13.3% (N = 2). The wetland with the highest mammal SR was the Mungyeong Doline Wetland (SR = 15).
3.3. Ecological Drivers of Species Richness (GLM/GAM Results)
This section presents the ecological drivers of species richness and implications derived from the data structure and its limitations. Because residual spatial autocorrelation was detected for amphibians/reptiles and birds in the NB-GLMs, we present NB-GAMs as the final models for these groups. After adding spatial smooth, residual Moran’s I was no longer significant, indicating that spatial dependence was effectively mitigated (Appendix A Table A4). For mammals, residual Moran’s I from the Gaussian GLM was not significant. Therefore, we retained the Gaussian GLM with an identity link without an added spatial smooth. Overall model performance (explained deviance) was 55.5% for amphibians/reptiles, 60.1% for birds, and 52.4% for mammals (Table 3). Model parameter estimates for each taxonomic group are reported in Table 4.
3.3.1. Amphibians and Reptiles
We analyzed the relationship between the SR of amphibians/reptiles and key environmental variables. We visualized bivariate associations using scatterplots with simple linear regression lines for selected predictors (Figure 3). In these bivariate plots, when examining simple linear regression, wetland area (m^2^, log) indicated a strong positive association, whereas the NDVI displayed a weak positive association. By contrast, BOD, forest cover (%), and average wind speed (m/s) showed negative bivariate associations with SR (Figure 3).
Amphibians/reptiles SR was modeled as a function of environmental predictors using an NB-GAM with a log link, including a two-dimensional smooth of coordinates s(Xm,Ym) to account for spatial structure (Table 4). In the final model, SR increased with wetland area (log-transformed; β = 0.0742, p < 0.001) and NDVI (β = 0.7355, p = 0.0198). After accounting for spatial structure, the remaining covariates were not statistically significant (p > 0.05). The spatial smooth term was highly significant (edf = 37.33, p < 0.001), and the model explained 55.5% of deviance (adjusted R^2^ = 0.516; Table 3). Residual spatial autocorrelation was no longer significant after including the spatial smooth (Appendix A Table A4).
3.3.2. Birds
The relationships between bird richness and critical environmental variables were analyzed. To visualize bivariate patterns, we produced scatterplots of SR against individual environmental variables with simple linear regression lines (Figure 4). When examining simple linear regression, the wetland area (m^2^, log) showed a strong positive association with bird richness, whereas NDVI, altitude (m), annual temperature (°C), annual precipitation (mm), and average wind speed (m/s) showed negative associations. Urban cover (%) revealed a weak negative association (Figure 4).
Birds SR was modeled using an NB-GAM with a log link, including a two-dimensional smooth of wetland coordinates s(Xm, Ym) to account for spatial structure (Table 4). In the final model, bird SR showed a strong positive association with wetland area (log-transformed; β = +0.1353, p < 0.001) and a positive association with NDVI (β = +0.3187, p = 0.025) (Table 4). Notably, NDVI showed a negative bivariate trend but became positive after accounting for spatial structure and other covariates. Urban cover showed a weak negative trend but did not reach statistical significance at α = 0.05 (β = −0.0041, p = 0.068), and the remaining covariates were not significant after accounting for spatial structure (p > 0.05). The spatial smooth term was highly significant (edf = 46.29, p < 0.001), and the model explained 60.1% deviance (adjusted R^2^ = 0.558; Table 3). Residual spatial autocorrelation was not significant after including the spatial smooth (Appendix A Table A4).
3.3.3. Mammals
In the final Gaussian GLM for mammals, wetland area (m^2^, log), NDVI, altitude (m), relative humidity (%), TWI, agricultural cover (%), annual precipitation (mm), and average wind speed (m/s) were significant predictors of mammal SR. Scatterplots with simple linear regression lines were used to visualize their bivariate relationships with SR (Figure 5). When examining simple linear regression, wetland area (m^2^, log), NDVI, altitude (m), and relative humidity (%) showed positive associations, whereas TWI, agricultural cover (%), annual precipitation (mm), and average wind speed (m/s) showed negative associations (Figure 5).
Controlling for other variables (Table 4), mammal SR increased significantly with higher NDVI (β = 9.52, p < 0.05). Wetland area and relative humidity also had positive effects (wetland area: β = 0.71, p < 0.05, relative humidity: β = 0.31, p < 0.05), and altitude (m) showed a weak, but significant positive effect (β = 0.007, p < 0.05).
In contrast, mammal SR decreased with increasing average wind speed and TWI (average wind speed: β = −2.57, p < 0.05; TWI: β = −0.28, p < 0.05). Mammal SR was also negatively associated with agriculture cover (%) and annual precipitation (mm) (agricultural cover: β = −0.06, p < 0.05; annual precipitation: β = −0.008, p < 0.05).
4. Discussion
4.1. Model Performance Comparison
This study presents an analysis of SR status by taxonomic group (amphibians/reptiles, birds, and mammals) for each wetland in Korea by aggregating the number of species recorded in survey reports (134 volumes total) published from 2000 to 2021.
In taxon-specific final models, explained deviance was 55.5% for amphibians/reptiles, 60.1% for birds, and 52.4% for mammals (Table 3). Residuals spatial autocorrelation was assessed using Moran’s I on Pearson residuals. Significant spatial autocorrelation was detected for amphibians/reptiles and birds in the initial negative binomial GLMs, but it was mitigated after adding a two-dimensional spatial smooth term in the negative binomial GAMs, whereas mammals showed no residual spatial autocorrelation.
For amphibians/reptiles, a model analysis of terrestrial vertebrates across Spain [40] presented similar explanatory power: 23.4% for amphibians and 29.4% for reptiles. However, local-scale studies that explicitly incorporate breeding sites, fine-scale wetland microhabitat conditions (e.g., water-level fluctuations and hydroperiods), water-quality parameters, and the presence/absence can achieve higher explanatory power (30–50%) [41,42]; therefore, our results should be interpreted with due regard to the limitations of nationwide, averaged predictors. For birds, the explained deviance (60.1%) falls within the range reported in national and regional GLM studies (30–60%) [40,43], while studies incorporating nonlinearities/interactions or machine-learning approaches sometimes exceed 60% [44,45]. For mammals, explained deviance was 52.4%, but interpretation warrants caution given the small sample size (N = 72); previous large-scale studies have reported values around 30% [40].
4.2. Drivers of Amphibian/Reptile Richness
The SR of amphibians/reptiles is primarily concentrated in river estuaries (river mouths) of major river basins and lowland wetlands (0 to 700 m) near lakes. In the final NB-GAM, SR increased with wetland area and NDVI (Table 4). The two-dimensional spatial smooth was also significant, indicating broad-scale geographic structure not captured by the measured predictors. Although bivariate plots suggested associations with water-quality and climatic variables, these effects were not retained as significant after accounting for covariates and spatial structure.
The positive area effect is consistent with higher richness in lager wetlands and in wetlands associated with large water bodies [46]. In addition, stabilized water levels and residence time are thought to enhance spawning and larval survival, particularly in amphibians [47]. NDVI as proxy for vegetation greenness, likely reflects food and shelter availability through vegetation and invertebrate supported resources [48], though responses may vary among reptile taxa [49].
Water-quality and land-cover variables showed limited support in the final model, but this does not preclude ecological importance. Rather, these relationships may require finer-resolution hydrological and water-quality indicators and habitat descriptors, together with improved effort-aware survey metadata, to better resolve taxon-specific drivers in future analyses.
4.3. Drivers of Birds Richness
Bird SR across Korea’s inland wetlands had the widest distribution range among terrestrial vertebrates, with high richness sites (top 10%) concentrated in riverine wetlands (70.3%). This pattern highlights the importance of river estuaries (river mouths) and floodplains as productive, and their function as habitats and resting sites for birds. This pattern likely reflects the strong environmental gradients and habitat mosaics in river mouths and floodplain settings, where freshwater interacts with brackish influences can create a diverse foraging and resting conditions [50]. This finding aligns with prior studies indicating that river mouths and floodplains provide heterogeneous habitat conditions and function as important stopover habitats for migratory birds [50,51].
Regarding environmental determinants, the wetland area (log) showed a consistent, positive effect on bird SR, supporting the typical species–area relationship. Larger wetlands are more likely to include greater environmental and habitat heterogeneity (e.g., larger wetland surface area, variation in vegetation cover, the presence and extent of open-water areas and more complex landscape composition and landscape heterogeneity), which can increase the number of available ecological niches and facilitate species coexistence [51,52,53,54]. In this context, NDVI can be interpreted as indicators related to vegetation that may contribute to habitat diversity.
In the final negative binomial GAM, bird species richness showed positively associated with wetland area and NDVI. The spatial smooth term was significant, and residual spatial autocorrelation was mitigated after including the spatial term (Moran’s I on GAM residuals was not significant). Urban cover and climate variables had only weak effects in the final model, and average wind speed, previously suggested as an important constraint, was not significant after accounting for spatial structure and covariates.
4.4. Drivers of Mammal Richness
Mammal SR was generally low in metropolitan and central inland regions, whereas higher values were more often observed in mountainous and artificial wetlands. In the final Gaussian GLM, SR increased with wetland area, NDVI, relative humidity, and altitude and decreased with average wind speed, agricultural cover, TWI, and annual precipitation. Large wetlands with greener vegetation may provide greater access to food, shelter, and seasonal resources [55,56], whereas higher agricultural cover can reduce habitat area, increase habitat fragmentation, and introduce anthropogenic disturbances, potentially limiting mammal persistence [57,58,59]. Higher wind speeds can inhibit mammal activity by making animals harder to detect and, ecologically, by disrupting scent trails in crucial foraging areas, increasing heat loss, and raising energy use [60,61].
Moreover, the data limitations must also be considered in the analysis of the mammal results. In the National Inland Wetland Survey, mammal taxonomic groups were surveyed only in intensive surveys, not in the general surveys. Consequently, data accumulation across regions and time periods is imbalanced. Given this data bias, future research should enhance analyses by incorporating methods to correct spatial unevenness and detection bias.
4.5. Implications from Cross-Taxon Drivers
The taxon-specific model analysis indicated that wetland area was a consistent positive predictor for amphibians/reptiles, birds and mammals, and NDVI also showed positive associations in these groups. To maintain and manage wetland species richness, conservation strategies tailored to each taxonomic group must be developed, considering their habitat utilization patterns. Particularly in Korea, where riverine wetlands cover over half the wetland area and factors related to wetland size and vegetation health have emerged as common critical environmental factors, protecting core river and estuary areas should be prioritized. Floodplains and riparian connectivity corridors must be managed to maintain wetland area and connectivity. Additionally, critical environmental factors that sustain populations of each taxonomic group must be periodically monitored to assess wetland health.
4.6. Implications for the Inland Wetland Survey: Data Structure Limitations and Future Improvements
Regarding the data from the NIWS Report, despite the abundance of survey data available for each wetland, insufficient database construction and data standardization efforts resulted in significant time and effort required during the analysis. To overcome these limitations and establish a usable national-level wetland ecological database, technical improvements and data standardization efforts are considered necessary.
First, we recommend implementing a metadata standardization module. When basic collection descriptions are missing, it is difficult to determine whether variation in SR reflects an ecological signal or differences in sampling intensity and design. Heterogeneous units, definitions, and preprocessing across reports also necessitate manual harmonization during integration, increasing the risk of error. A standardized metadata template with enforced code lists and automatic capture of core fields (e.g., survey effort, date/time, georeferenced location, investigator, and method) would mitigate these problems.
Second, a multiformat data delivery system should be established to enhance usability. All survey results should be released as narrative reports and in machine-readable format (e.g., CSV, Shapefile, and GeoJSON) along with an open API to ensure public access. Providing open-access data increases reusability and interoperability, substantially improving researchers’ abilities to discover, integrate, and analyze the data.
Third, a dataset versioning and citation system should be established to track annual updates with clear version identifiers, preventing duplication and omissions, and securing a foundation for long-term time-series analyses. Wetland recordkeeping must be standardized so that multi-year data for each site can be integrated under a single, persistent ID.
Fourth, to enable robust longitudinal inference in future work, it is important to complement externally sourced environmental layers with site-level environmental monitoring data accumulated by the surveying agency itself, consistently referenced to the survey year (e.g., water temperature, water-quality indicators such as BOD, and hydrological metrics including water level/residence time and hydroperiod), and released with standardized metadata. Linking these wetland–year environmental records to species-richness data via a persistent wetland ID would help reduce temporal mismatch in nationwide syntheses like ours and, over time, support wetland-specific change detection and evaluation of management effectiveness.
Finally, quality assurance and control workflow with automation should be introduced to flag coordinate errors, missing fields, and outliers at the point of entry. Automating the manual validation steps in this study would dramatically reduce processing time and substantially improve the reliability and reproducibility of the data. Developing and managing national-scale wetland data in this manner will improve its quality and accessibility, enhancing the reproducibility and scalability of wetland ecological research in Korea.
5. Conclusions
This study empirically identified structural limitations in national survey data and, using taxon-specific GLM/GAM approaches, quantified biota–environment relationships to guide ecological data standardization by analyzing 134 inland wetland survey reports compiled between 2000 and 2021. Wetland area was a consistent positive predictor for amphibians/reptiles, birds and mammals, and NDVI also showed positive associations in these groups. Moreover, format heterogeneity and missing metadata constrain time-series analyses, resulting in substantial data attrition. Because the analyses draw on secondary, report-based sources, limitations remain in survey precision, unmeasured environmental covariates, and sampling frequency. Future work should integrate standardized field protocols and be complemented by site-level environmental monitoring data accumulated by the survey institutions. Combined, these results underscore the need for a national, integrated wetland ecological database that combines standardized survey protocols, robust metadata governance, multiformat data delivery, and automated quality assurance and control.
The reference list from the paper itself. Each links out to its DOI / PubMed record.
- 1Ramsar Convention on Wetland An Introduction to the Convention on Wetland (Previously The Ramsar Convention Manual)5th ed.Ramsar Convention Secretariat Gland, Switzerland 2016910
- 2National Institute of Ecology Inland Wetland Status Data Book National Institute of Ecology Seocheon, Republic of Korea 2022979-11-6698-145-6
- 3Kim M.J. Son M.J. Won M.H. Wetland Administration: A One-Volume Guide MOE & NIE Seocheon, Republic of Korea 2024
- 4United States Environmental Protection Agency (EPA) Why Are Wetlands Important?Available online: https://www.epa.gov/wetlands/why-are-wetlands-important(accessed on 26 October 2025)
- 5Sundberg M.D. Coastal Impacts of Global Climate Change. EBSCO Research Starters, 2024 Available online: https://www.ebsco.com/research-starters/environmental-sciences/coastal-impacts-global-climate-change(accessed on 26 October 2025)
- 6Ramsar Convention on Wetland Global Wetland Outlook: State of the World’s Wetlands and Their Services to People Ramsar Convention Secretariat Gland, Switzerland 2018315
- 7Zedler J.B. Kercher S. Wetland resources: Status, trends, ecosystem services, and restorability Annu. Rev. Environ. Resour.200530397410.1146/annurev.energy.30.050504.144248 · doi ↗
- 8Thorslund J. Jarsjo J. Jaramillo F. Jawitz J.W. Manzoni S. Basu N.B. Chalov S.R. Cohen M.J. Creed I.F. Goldenberg R. Wetlands as large-scale nature-based solutions: Status and challenges for research, engineering and management Ecol. Eng.201710848949710.1016/j.ecoleng.2017.07.012 · doi ↗