Sustaining Rwanda's HIV response after elimination of PEPFAR funding: a modelling analysis of HIV epidemic and care continuum outcomes
April D. Kimmel, Zhongzhe Pan, Gad Murenzi, Ellen Brazier, Batya Elul, Benjamin Muhoza, Marcel Yotebieng, Kathryn Anastos, Denis Nash

TL;DR
This study models the impact of losing U.S. funding for HIV programs in Rwanda and finds that without sufficient government support, HIV rates could rise sharply.
Contribution
The study quantifies the potential reversal of HIV progress in Rwanda if PEPFAR funding is abruptly eliminated and government capacity is insufficient.
Findings
Without full government capacity, HIV prevalence could increase by 13.9%–38.7% and incidence by 69.0%–246.7% over 10 years.
Cumulative new HIV infections could reach up to 92,000 and deaths could increase by up to 51,200 under low coverage scenarios.
Gradual increases in coverage capacity can yield outcomes similar to or better than delayed full capacity.
Abstract
HIV prevention and treatment supported by the United States President's Emergency Plan for AIDS Relief (PEPFAR) have saved millions of lives. Rwanda is among the most successful countries worldwide in achieving global targets with PEPFAR support. Abrupt PEPFAR funding uncertainty raises concerns about continued HIV epidemic control. We projected the impact of the Government of Rwanda's (GoR's) capacity to offset PEPFAR funding elimination on adult HIV epidemic and care continuum outcomes over 10 years. Using an HIV policy model calibrated to Rwanda, we assessed capacity to sustain HIV services at: 50% (with no capacity by GoR to cover the PEPFAR funding gap), 75%, 90% and 100% (with full capacity by GoR to cover the gap). Scenarios involved reducing the number on antiretroviral therapy (ART), immediately discontinuing ART and proportionally decreasing HIV diagnosis, ART initiation, and…
Genes, proteins, chemicals, diseases, species, mutations and cell lines named across the full text — each resolved to its canonical identifier and authoritative record.
Click any figure to enlarge with its caption.
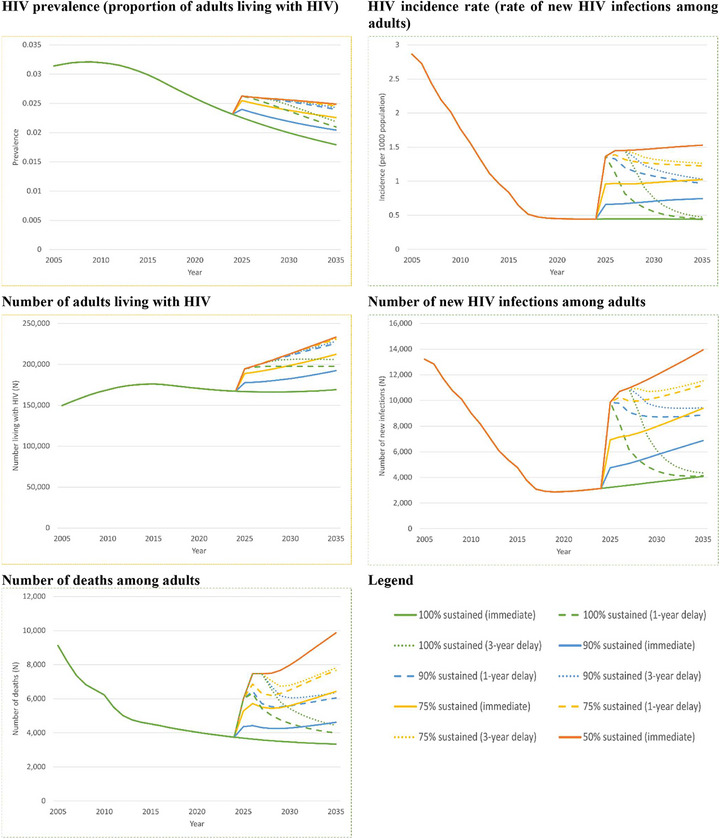 Figure 1
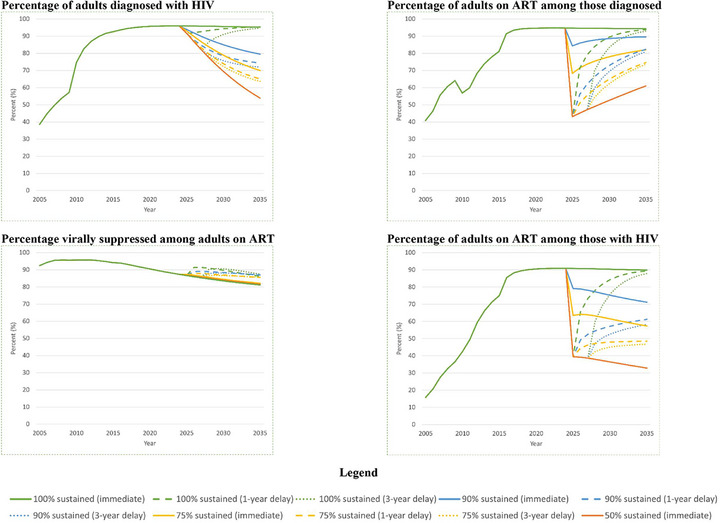 Figure 2
| Parameter | Baseline value(s) | Original data source(s) | |||
|---|---|---|---|---|---|
| Force of infection | |||||
| Probability of HIV transmission per unprotected sexual act when not virally suppressed, by sub‐population | 0.0007–0.0108 | Boily (2009) [ | |||
| Proportion consistently using condoms, by sub‐population | |||||
| Lower‐risk women | 0.032–0.224 | DHS Rwanda (2005, 2010, 2015) [ | |||
| Lower‐risk men | 0.108–0.560 | DHS Rwanda (2005, 2010, 2015) [ | |||
| Female sex workers | 0.275–0.353 | BBSS (2010) [ | |||
| Men who have sex with men | 0.402–0.408 | BBSS (2020) [ | |||
| Average number of sexual acts per month, by sub‐population | |||||
| Lower‐risk women and men | 0.948–1.834 | Braunstein (2011a) [ | |||
| Female sex workers | 130.0 | Braunstein (2011a) [ | |||
| Men who have sex with men | 8.938 | Binagwaho (2010) [ | |||
| Transition probabilities (monthly) for infectious compartments | |||||
| Susceptible population growth rates, by age, sex and urbanicity | 0.08%–0.48% | World Bank [ | |||
| Natural history disease progression, by sex | 0.033–0.049 | CA‐IeDEA (Rwanda, 2004–2020) [ | |||
| Diagnosis, by CD4 stratum and year | 0.018–0.102 | DHS Rwanda (2005, 2010, 2015) [ | |||
| Linkage to care, by CD4 stratum | 0.132–0.192 | Braunstein (2011b) [ | |||
| Loss to follow‐up, by CD4 stratum and ART status | 0.001–0.003 | CA‐IeDEA (Rwanda, 2004–2020) [ | |||
| On ART and virally suppressed, by CD4 stratum and year | 0.129–0.265 | CA‐IeDEA (Rwanda, 2004–2020) [ | |||
| On ART and virologic failure of available regimens, by CD4 stratum and year | 0.001–0.002 | CA‐IeDEA (Rwanda, 2004–2020) [ | |||
| Re‐engagement in care | 0.022–0.024 | CA‐IeDEA (Rwanda, 2004–2020) [ | |||
| Death on ART and virally suppressed, by sub‐population and CD4 stratum | 0.003–0.035 | CA‐IeDEA (Rwanda, 2004–2020) [ | |||
| Calibration targets, most recent year | |||||
| HIV prevalence (15–64 years), overall and by sex | 2.2%–3.7% | RPHIA (2019) [ | |||
| % on ART among diagnosed (15–44 years), overall and by sex | 96.2%–97.2% | RPHIA (2019) [ | |||
| % virally suppressed among on ART (15–44 years), overall and by sex | 83.1%–92.6% | RPHIA (2019) [ | |||
| Multiplicative adjustments for probabilities of diagnosis, ART initiation and ART re‐engagement | |||||
| 2025 adjustments | 2026+ adjustments | ||||
| CD4 >500 | CD4 >350–500 | CD4 >200–350 | CD4 | ||
| 100% sustained scenario | 1 | 1 | 1 | 1 | 1 |
| 90% sustained scenario | 0 | 0.4 | 0.6 | 0.9 | 1 |
| 75% sustained scenario | 0 | 0.1 | 0.25 | 0.5 | 0.7 |
| 50% sustained scenario | 0 | 0 | 0.05 | 0.1 | 0.3 |
- —National Institutes of Health10.13039/100000002
Peer Reviews
No public reviews on file for this paper yet. If you reviewed it on a platform where reviews are public (OpenReview, ICLR, NeurIPS, ICML), you can paste yours below so the community can read it here.
Videos
No videos yet. Explain this paper in a talk, walkthrough, or lecture? Add one.
Taxonomy
TopicsMiddle East and Rwanda Conflicts · HIV/AIDS Research and Interventions · HIV, Drug Use, Sexual Risk
INTRODUCTION
1
Rwanda is a global HIV success story, one of only nine countries worldwide achieving the 95‐95‐95 UNAIDS targets for epidemic control [1]. Rwanda's success relies substantially on commitment from the Government of Rwanda (GoR) through high levels of political will, a multisectoral response and implementation of evidence‐based approaches for HIV prevention and treatment [2]. While Rwanda has been moving towards sustainability of its HIV response [3], like many sub‐Saharan African countries, success of Rwanda's national response has hinged on support from external donors, especially the United States President's Emergency Plan for AIDS Relief (PEPFAR), which funded nearly 40% of the total HIV response and 50% of antiretroviral therapy (ART) in Rwanda, fiscal year 2023–2024 [4, 5].
PEPFAR's future, however, remains uncertain. Programme reauthorization by the US Congress was for only 1 year (vs. prior 5‐year reauthorizations) until 25 March 2025 [6]. On 20 January 2025, President Trump froze all US foreign aid for 90 days [7], although PEPFAR secured a limited waiver allowing some service continuation [8]. An abrupt, persistent elimination of PEPFAR funding will result in an approximately $60‐million‐dollar funding gap for Rwanda's national response and setbacks in epidemic control, despite the GoR's strong willingness to increase domestic HIV funding and anticipated temporary stocks of HIV treatment and laboratory testing supplies [9, 10, 11].
Leveraging the cohort study of the Central Africa International epidemiology Database on AIDS (CA‐IeDEA) and the calibrated CA‐IeDEA Rwanda HIV policy model [12], we projected the impact of the capacity for sustained HIV services, including the GoR's coverage of the PEPFAR funding gap, on adult HIV epidemic and care continuum outcomes.
METHODS
2
This study was approved by the Republic of Rwanda National Ethics Committee (RNEC660), Albert Einstein College of Medicine Office of Human Affairs (2021‐13394) and Virginia Commonwealth University Institutional Review Board (HM20008203). Consent was not obtained, as the study used secondary data with no identifiable information. Data were collected between 3 October 2024, and 28 February 2025.
2.1 Scenarios
2.1
Scenarios included: 50% sustained (no capacity by the GoR to sustain HIV services and cover the PEPFAR funding gap), 75% sustained, 90% sustained and 100% sustained (full capacity). Scenarios assumed complete, persistent and immediate elimination of PEPFAR support over 10 years starting in 2025 [4, 5]. Scenarios were operationalized by reducing the total on ART [13]. 50% sustained assumed a 50% reduction in the number on ART, 75% sustained a 25% reduction and 90% sustained a 10% reduction. 100% sustained assumed no reduction in the number on ART or no reduction in PEPFAR funding. Scenarios were constant over time.
In secondary analysis, we examined the timing of Rwanda's national response. We assessed the base case scenarios assuming 1‐ and 3‐year temporary delays in response. We also projected the impact of gradual increases in the GoR's response: (1) slow (50% sustained in year 1, 75% in year 2, 90% in year 3, 100% in years 4+); (2) moderate (75% sustained in year 1, 90% in year 2, 100% in years 3+); and (3) rapid (90% sustained in year 1, 100% in years 2+).
2.2 Model
2.2
We used the CA‐IeDEA Rwanda HIV policy model, a deterministic dynamic model of the HIV epidemic among adults aged 15–64 years [12]. The model includes compartments for HIV disease progression by CD4 stratum and care engagement and has 35 sub‐populations by age, sex, risk and urbanicity. Calibrated to Rwanda [12], the model projects epidemic and care continuum outcomes. Epidemic outcomes include: HIV prevalence (%), HIV incidence (number of new infections per 1000 population), annual number of new HIV infections, number with HIV and cumulative HIV‐related deaths. Care continuum outcomes include the percentage: diagnosed with HIV, on ART among those diagnosed, HIV virally suppressed among those on ART and on ART among those with HIV. We reported incremental differences and percentage change in mean projected outcomes for 50% sustained, 75% sustained and 25% sustained compared, separately, to 100% sustained between 2025 and 2035.
2.3 Model inputs and calibration
2.3
Model inputs were derived from individual‐level longitudinal data from the Rwanda cohort of CA‐IeDEA [14], estimated from Rwanda national surveys and population projections [15, 16, 17, 18, 19, 20, 21], and extracted from literature specific to Rwanda [9, 22, 23, 24, 25, 26, 27, 28, 29, 30, 31, 32, 33] (Table 1). The model calibration process is described elsewhere [12] and summarized in the Supplement; calibrated parameter values are in Table 1.
2.4 Model input adjustments to capture PEPFAR funding elimination
2.4
We adjusted the 2025 projected population distribution across compartments. Reductions in ART coverage were scenario‐specific and immediate and were applied proportionally to sub‐populations according to their distribution across compartments in 2025. Among those discontinuing ART in 2025, we assumed half remained in care with non‐ART‐related clinical support, while the remainder were lost from care. We assumed people virally suppressed, but for whom ART was abruptly discontinued due to PEPFAR funding elimination, had CD4 counts >500 cells/µl [34]; we also assumed those on ART and not virally suppressed, but for whom ART was abruptly discontinued, had CD4 counts >200–350 cells/µl [35].
We assumed changes in coverage capacity decreased probabilities of HIV diagnosis, ART initiation and re‐engagement in care [36]. Decreases reflect clinical and resource allocation decisions made due to limited availability of diagnostics, medication and related infrastructure, including clinic staffing, which can impact service delivery for HIV testing, ART, and retention and re‐engagement in care [36, 37, 38]; they also reflect behavioural changes resulting in delayed initial presentation to clinical care [36]. We modelled the decreases by applying multiplicative adjustments to parameters for HIV diagnosis, ART initiation and re‐engagement, assuming loss to follow‐up related to insufficient ART supply occurred immediately after funding cuts and was captured by sub‐population re‐distribution. Adjustments resulted in constant, scenario‐specific numbers on ART over time.
RESULTS
3
3.1 Baseline analysis
3.1
Decreased capacity for the GoR to cover a complete, persistent PEPFAR funding gap worsened adult HIV epidemic outcomes (Figure 1). Compared to 100% sustained at 10 years, HIV prevalence increased from 1.8% to 2.0% (90% sustained, +13.9%) and 2.5% (50% sustained, +38.7%). HIV incidence per 1000 population increased from 0.44 to 0.75 (90% sustained, +69.0%) and 1.53 (50% sustained, +246.7%). New HIV cases increased by nearly 2800 (+68.3%) and 9900 (+241.9%), respectively, in year 10, versus 100% sustained in year 10. Ten‐year cumulative new HIV cases increased from 40, 000 to 63, 000 (90% sustained, +58.1%) and 132, 000 (50% sustained, +229.1%). Over 10 years, the number with HIV increased to 192, 000 (90% sustained, +13.8%) and 233, 000 (50% sustained, +38.0%). Ten‐year cumulative deaths increased to 48, 000 (90% sustained, +25.9%) and 90, 000 (50% sustained, +133.8%), versus 38, 000 deaths (100% sustained).
Projected HIV epidemic outcomes in Rwanda among adults aged 15–64 years by 2035.
Decreasing capacity by the GoR to cover a complete, persistent PEPFAR funding gap had a varied impact on HIV care continuum outcomes (Figure 2). The percentage diagnosed with HIV had continual reductions, with decreases from 95.3% for 100% sustained to 79.5% (90% sustained, –16.6%) and 53.9% (50% sustained, –43.5%) by 2035. Similarly, the percentage on ART among those with HIV decreased from 90.0% for 100% sustained to 71.2% (90% sustained, –20.7%) and 32.8% (50% sustained, –63.4%) in 10 years. The percentage on ART among diagnosed in 2025 had as high as a 54.5% decrease (50% sustained vs. 100% sustained). However, these reductions diminished over time: in 2035, ART coverage among those diagnosed with HIV decreased from 94.3% for 100% sustained to 89.6% (90% sustained, –5.0%) and 61.0% (50% sustained, –35.3%). Finally, the percentage virally suppressed given ART remained similar across scenarios (∼1% difference), but had a downward trend.
Projected HIV care continuum outcomes in Rwanda among adults aged 15–64 years by 2035.
3.2 Secondary analysis
3.2
HIV epidemic outcomes were sensitive to the timing of the GoR's response. Outcomes generally worsened as delays in covering the PEPFAR funding gap grew, although the impact of the delays diminished as coverage capacity decreased. Higher, and more delayed, coverage capacity had outcomes similar to lower, and less delayed, coverage capacity. For example, by 2035, the number of new infections projected for a 3‐year delay in 90% sustained was similar to immediate 75% sustained (both 9400), while the number with HIV projected from a 3‐year delay in 75% sustained was similar to 50% sustained (232, 000 vs. 233, 000). When coverage capacity increased gradually, outcomes generally were similar to or better than for delayed full coverage. For example, the number with HIV for slow was similar to a 3‐year delay in 100% sustained (205, 000 vs. 206, 000), while there were 5000–17, 000 fewer with HIV for moderate and rapid than for a 1‐year delay in 100% sustained. At times, outcomes for slow were worse than for a 1‐year delay in 100% sustained, such as for cumulative new infections (+23% increase).
For HIV care continuum outcomes, findings varied regarding the timing of the GoR's response. Higher, and more delayed, coverage capacity had outcomes similar to lower, and less delayed, coverage capacity. For example, by 2035, the percentage diagnosed for a 3‐year delay in 90% sustained was similar to immediate 75% sustained (72.0% vs. 69.9%), while the percentage on ART among diagnosed for a 1‐year delay in 90% sustained was similar to immediate 75% sustained (82.3% vs. 82.0%). Notably, delays in full coverage (100% sustained) had minimal impact on percentage diagnosed and percentage on ART among diagnosed versus immediate full coverage. However, across all scenarios, the percentage virally suppressed increased with coverage delays. Here, the percentage increase was highest for a 1‐year delay, although this generally decreased as coverage capacity diminished. Outcomes for gradual increases in coverage capacity generally were similar to those for delayed full coverage, although the percentage virally suppressed given ART worsened as the speed of response accelerated.
DISCUSSION
4
Given an abrupt, complete and persistent 10‐year withdrawal of PEPFAR funding, the decreasing capacity of the GoR to sustain PEPFAR‐supported HIV services worsened epidemic outcomes but had a varied impact on care continuum outcomes. Delayed coverage of the same coverage capacity worsened all outcomes except for full capacity, for which there was a minimal impact on some HIV epidemic and care continuum outcomes. Higher, and more delayed, coverage capacity had outcomes similar to lower, and less delayed, coverage capacity. HIV epidemic and care continuum outcomes for gradual increases in coverage capacity were generally similar to or better than for full, but delayed, coverage capacity.
Progressively lower capacity to cover the PEPAR funding gap substantially worsened HIV epidemic outcomes, but had a varied impact on care continuum outcomes. In particular, for HIV care continuum outcomes, there were immediate, sharp reductions in the percentage on ART among diagnosed, with these reductions diminishing over time, while the percentage virally suppressed given ART remained similar, although gradually decreasing, across all coverage capacities. The former is due to reductions in the number diagnosed with HIV and by stable, scenario‐specific numbers on ART over time. That is, for people diagnosed with HIV who have either discontinued ART or cannot initiate ART due to resource constraints, downstream consequences of lack of treatment may include virologic failure, disease progression and higher risk of AIDS‐related illness, which can lead to increased mortality. Increased mortality, combined with the stable, scenario‐specific numbers on ART, can reduce the number diagnosed with HIV and thus, increase the percentage on ART among diagnosed. The latter is due to our assumption that provision of treatment and care for those on ART was similar regardless of capacity constraints [39]. The downward trend in the percentage virally suppressed given ART across all scenarios reflects the increasing percentage on ART having virologically failed all available ART regimens, highlighting the importance of making available multiple therapeutic drug classes for the treatment of HIV to continue to achieve targets even when there are capacity constraints.
Delayed capacity to cover the PEPFAR funding gap worsened HIV epidemic and care continuum outcomes, except for the full coverage capacity scenario and one outcome: percentage virally suppressed given ART. Notably, HIV prevalence in the presence of a delay was similar regardless of coverage capacity, except for full capacity. This is due to the immediate, sharp increase in new infections, which could have long‐lasting effects on HIV prevalence and number with HIV. Surprisingly, the percentage virally suppressed given ART increased with coverage capacity delays. This is because, compared to no delays, a greater number for whom ART was discontinued progressed to lower CD4 cell counts. In our model, those with lower CD4 cell counts are more likely to initiate ART than those with higher CD4 cell counts; therefore, a greater number initiated ART and became virally suppressed, resulting in a higher proportion virally suppressed than without coverage delays.
When there were gradual increases in coverage capacity, HIV epidemic and care continuum outcomes were generally similar to or better than for full, but delayed, coverage. At times, compared to shorter delays in full coverage, outcomes worsened for slow increases (e.g. for cumulative new HIV infections) and moderate to rapid increases (e.g. for percentage virally suppressed given ART) in coverage capacity. The former is due to a longer time with insufficient ART supply, which increased the percentage virally suppressed. The latter can be explained by the more rapid consumption of all available ART regimens due to faster recovery of the ART supply.
Findings suggest that a swift response to the PEPFAR funding gap, even if with limited or gradual increases in coverage capacity, could have similar or better outcomes than delayed but higher coverage capacity. The GoR is intensifying its efforts to self‐sustain HIV programmes and limit the impact of the abrupt HIV financing gap left by PEPFAR, which information suggests has disrupted availability of HIV test kit, viral load test kit, and ART and has interrupted service delivery due to staffing layoffs or clinic closures [11, 40]. In response, the GoR is increasing government budgets alongside economic development [41], as well as engaging the private sector to sustain the HIV response [4, 42]. With continued effort and political priority of self‐sustaining HIV programmes, Rwanda has the potential to begin covering the PEPFAR funding gap with limited delay in initiating this coverage. Doing so may provide important insights for other countries facing similar situations and mobilizing to respond. Systematically collecting data on site‐ and programme‐level evolution alongside the GoR's sustainment efforts could, additionally, substantially improve situational awareness and future modelling efforts. However, such data collection may be challenging in the current context, given pressing priorities imposed by the funding crisis.
The HIV policy model used in this study was developed and calibrated using the Rwanda cohort of CA‐IeDEA. Cohort collaborations, such as CA‐IeDEA, have played an important role in guiding Rwanda's HIV response and across the sub‐Saharan Africa region. These cohorts provide the real‐world, longitudinal data necessary for Ministries of Health to evaluate programme impact, identify areas where course corrections may be needed and plan for sustainability. Leveraging these data to inform policy underscores the importance of cohort‐based infrastructure in supporting national decision‐making over the coming months and years. Their use in the current study highlights the importance of supporting Ministries of Health in using robust analytic infrastructure—including cohort data platforms—to inform programmatic planning and mitigate the impacts of abrupt transitions to government health programmes.
Our study is among the first to project the impact of sustaining HIV programmes on HIV epidemic and care continuum outcomes, given the elimination of PEPFAR funding. Our findings support that abrupt elimination of PEPFAR funding could have a significant impact on progress towards ending the HIV epidemic as a public health threat, which had largely been achieved by the GoR, with 50% of its total ART budget supported by PEPFAR [5]. Our findings align with other modelling studies done in low‐ and middle‐income countries (LMICs). In South Africa, where PEPFAR funding supported 11% of the total HIV budget, a full extraction of PEPFAR funds resulted in a 50% increase in HIV incidence in 10 years and reduced the percentage diagnosed and percentage on ART among diagnosed by 3% and 14% in 5 years, respectively [43]. Among 26 LMICs where PEPFAR supports 45% of total HIV spending, a full extraction of PEPFAR funds resulted in a 283% increase in cumulative new HIV infections and 191% increase in HIV‐related deaths over 5 years [44]. These align with our finding that sustaining Rwanda's HIV budget could result in a 70%–247% increase in HIV incidence, 58%–229% increase in cumulative new infections, 17%–44% reduction in percentage diagnosed and 5%–35% reduction in percentage on ART among diagnosed. The differences in magnitude are possibly because our scenarios were defined by only restricting ART availability, which other work assumed was not affected or affected additional HIV‐related programmes (e.g. prevention programmes) besides ART. Further, our findings of increased cumulative deaths (1460–5120 annually) are consistent with the preliminary assessment of excess HIV‐related deaths (562 in 1 year) due to pauses in PEPFAR funding [45]. Our projected cumulative deaths are likely higher because we examined a persistent elimination of PEPFAR funding versus a 90‐day pause in funding.
Our study has limitations. First, we assumed immediate, scenario‐specific discontinuation of ART, although reports suggest ART stockouts were not expected for 3–6 months [11]. Therefore, we may have overestimated the impact of PEPFAR funding elimination. Conversely, in defining scenarios in terms of ART coverage decreases only, we did not capture disruptions in staff availability to deliver ART and related services. While we operationalized our scenarios to align with survey findings on the ability to deliver HIV services—including the frequent cancellations and reduced activity related to HIV testing, HIV treatment and services for care re‐engagement [36]—after the extraction of PEPFAR funding, our approach to capture staff shortages may have underestimated the impact of PEPFAR funding elimination on outcomes. Second, we examined the impact of PEPFAR funding elimination only on individuals aged 15–64 years and did not assess its impact on HIV prevention services (e.g. pre‐exposure prophylaxis (PrEP)) and mother‐to‐child transmission. This is because our model structure does not allow for this assessment; therefore, model projections do not reflect the potential impact on infants, children and adolescents at risk for and living with HIV. Thus, our projections are limited in terms of these groups and by definition do not estimate the overall impact on epidemiologic and care continuum outcomes of PEPFAR funding elimination. Third, we assumed that when the PEPFAR funding gap was covered, HIV testing and ART would re‐initiate at a rate similar to the PEPFAR funding elimination. However, the extraction of PEPFAR funding may result in health workforce layoffs and closure of HIV‐related infrastructure [46], which could have a long‐lasting impact on HIV service delivery and population outcomes. Fourth, given the lack of data, we assumed scenario‐specific reductions in ART coverage were applied proportionally to sub‐populations according to their 2025 distribution across compartments, although this assumption can be updated as new data emerge. Fifth, model simplifications may have resulted in inexact model projections, particularly for key populations. We neither modelled acute HIV nor sexual contact between MSM and heterosexual populations. We did not parameterize the model to reflect trends in condom use among female sex workers (FSWs) and men who have sex with men (MSM), as the condom use time horizon (i.e. most recent sex act, in the past month, in the past 12 months) was reported inconsistently, and because we did not model partner types. For example, for MSM, data on consistent condom use in the past month were available in later reports [47, 48], but not in earlier reports [49]. For FSWs, while data on consistent condom use in the past month were available over time, the data were not consistent in terms of partner type—reported overall only [18, 49] or disaggregated by partner type only [47, 48]—with no information on partner type distribution. We also did not calibrate the model to historical data on FSWs and MSM, although some literature suggests lower antiretroviral coverage and viral suppression in these sub‐populations [23, 50, 51] versus the overall population [52]. Ultimately, our parameterization and calibration simplifications for FSWs and MSM may have resulted in overestimates of analysis outcomes. Future research projecting the impact of PEPFAR elimination, particularly for key populations, will benefit from model updates that address these simplifications. Finally, we did not explicitly model the death of the susceptible population. Rather, we modelled the average rates of population growth in susceptible compartments by sub‐population, an approach that simultaneously captures entry, maturation and mortality within each compartment. We implemented this approach given its mathematical tractability, coupled with the availability of historical data on the size of the adult population in Rwanda, for multiple sub‐populations, over time [53]. However, using a fixed population growth rate for a given sub‐population, as in our model, may result in artificially lower birth rates or may eclipse short‐term variation or decreasing trends in population growth that a model structure with separate parameters related to birth, death and maturation rates may otherwise capture. Nonetheless, prior work suggests that model projections fit multiple sources of historical data and can be used to inform population policy in Rwanda [12].
CONCLUSIONS
5
The ability to sustain HIV budgets, given the persistent elimination of PEPFAR funding, would greatly limit progress to end the public health threat posed by the HIV epidemic and the achievement of 95‐95‐95 UNAIDS targets in Rwanda. Rapid response to cover the PEPFAR funding gap and to sustain HIV treatment and prevention programmes is key to minimizing the effect of PEPFAR funding elimination in Rwanda.
COMPETING INTERESTS
The authors declare no competing interests.
AUTHOR CONTRIBUTIONS
ADK and GM conceptualized the research. ADK and ZP designed the analysis. ZP conducted the analysis. ADK and ZP drafted the manuscript. ADK, ZP, GM, EB, BE, BM, MY, KA and DN interpreted the data and critically reviewed and revised the manuscript.
FUNDING
Research reported in this publication was supported by the U.S. National Institutes of Health's (NIH) National Institute of Allergy and Infectious Diseases, the Eunice Kennedy Shriver National Institute of Child Health and Human Development, the National Cancer Institute, the National Institute of Mental Health, the National Institute on Drug Abuse, the National Heart, Lung, and Blood Institute, the National Institute on Alcohol Abuse and Alcoholism, the National Institute of Diabetes and Digestive and Kidney Diseases and the Fogarty International Center under Award Number U01AI096299 (Central Africa IeDEA). Informatics resources are supported by the Harmonist project under Award Number, R24AI24872.
DISCLAIMER
This work is solely the responsibility of the authors and does not necessarily represent the official views of any of the institutions mentioned above. This work is subject to the NIH Public Access Policy. Through acceptance of this federal funding, NIH has been given a right to make this manuscript publicly available in PubMed Central upon the Official Date of Publication, as defined by NIH.
Supporting information
Supporting Information
The reference list from the paper itself. Each links out to its DOI / PubMed record.
- 1Joint United Nations Programme on HIV/AIDS . AID Sinfo: Global data on HIV epidimiology and response. 2024. [cited 2025 March 21]. Available from: https://aidsinfo.unaids.org/.
- 2Rwanda Ministry of Health . National HIV/AIDS targets: 2018‐2020‐2030. 2015.
- 3Joint United Nations Programme on HIV/AIDS . HIV sustainability planning: analytical resource. 2024 [cited 2025 March 21]. Available from: https://sustainability.unaids.org/wp‐content/uploads/2024/08/Rwanda__‐Executive‐Summary‐May‐2024.pdf.
- 4Joint United Nations Programme on HIV/AIDS . Impact of US funding cuts on HIV programmes in Rwanda. 2025. accessed January 21, 2026. Available from: https://www.unaids.org/en/resources/presscentre/featurestories/2025/march/20250318_Rwanda_fs.
- 5Centers for Disease Control and Prevention Global Health Center . CDC in Rwanda: HIV and TB. 2024. [cited 2025 April 15]. Available from: https://www.cdc.gov/global‐health/countries/rwanda.html#cdc_generic_section_3‐hiv‐and‐tb.
- 6Consolidated Appropriations Act, 2024, Publ. L. No. 118‐42, 138 Stat. 460 (2024). Accessed January 21, 2026. https://www.congress.gov/bill/118th‐congress/house‐bill/2882/text..
- 7The White House . Executive Order, Reevaluating and Realigning United States Foreign Aid. 2025. [updated January 20, 2025]. Available from: https://www.whitehouse.gov/presidential‐actions/2025/01/reevaluating‐and‐realigning‐united‐states‐foreign‐aid/.
- 8United States Department of State . Info Memo for the PEPFAR Implementing Agencies and PEPFAR Country Coordinators. 2025. [updated February 1, 2025]. Available from: https://docs.google.com/document/u/0/d/e/2PACX‐1v Qg N Tp C 6F 5oa Onkeb Qok J_2e Yg M_Ic QNT 7al IL 6R 3P 16Ef 4Z 0pm Qby 3Y 1e Hb Jc Tx K_y J 8EPV Niibx ON/pub?pli=1.