Current and Future Cost Burden of Myocardial Infarction in Australia: Dynamic Multistate Markov Model
Tamrat Befekadu Abebe, Jenni Ilomaki, Adam Livori, J. Simon Bell, Jedidiah I. Morton, Zanfina Ademi

TL;DR
This study estimates the current and future healthcare costs of myocardial infarction in Australia, projecting a burden of over AUD 85 billion over 20 years.
Contribution
The novel use of a dynamic multistate Markov model to project MI-related healthcare costs in Australia over two decades.
Findings
The current annual chronic management cost of MI is estimated at AUD 14,412 per person.
Projected total healthcare cost from MI is AUD 85.1 billion between 2019 and 2038.
Costs are higher for older individuals, males, and those in the most socioeconomically disadvantaged group.
Abstract
Myocardial infarction (MI) imposes a significant health burden to the Australian population. However, detailed economic implication of MI on the Australian healthcare system has not been exhaustively explored. To estimate the current chronic management cost and project the future healthcare cost burden of MI, from the Australian healthcare system perspective. A generalized linear model with a gamma outcome distribution and negative inverse link function was used to estimate the current chronic management cost burden of MI while a dynamic multistate Markov model constructed to project the future healthcare cost burden of MI over 20 years (2019–2038). For all projected costs, 5% annual discounting was applied in the base case, as per Australian guidelines. We identified all people, 59,260, aged ≥ 30 years discharged from a public or private hospital following MI between 2012 and 2017…
Genes, proteins, chemicals, diseases, species, mutations and cell lines named across the full text — each resolved to its canonical identifier and authoritative record.
Click any figure to enlarge with its caption.
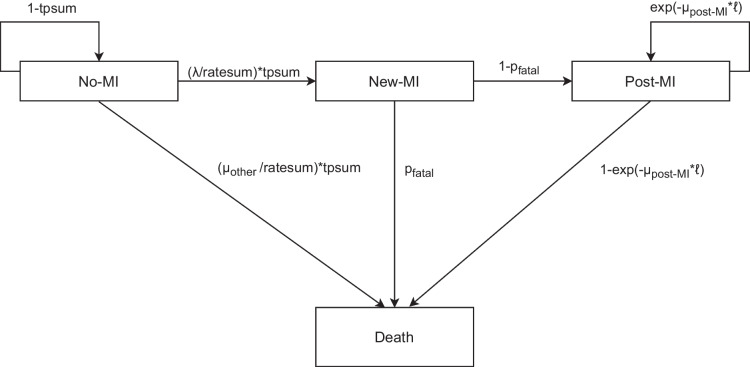 Figure 1
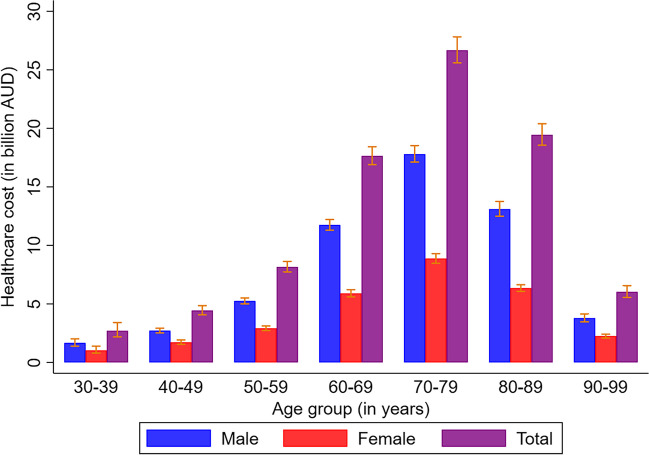 Figure 2
- —Victorian Medical Research Acceleration Fund
- —http://dx.doi.org/10.13039/100008710Dementia Australia Research Foundation
- —http://dx.doi.org/10.13039/501100016005Yulgilbar Foundation
- —Monash University
Peer Reviews
No public reviews on file for this paper yet. If you reviewed it on a platform where reviews are public (OpenReview, ICLR, NeurIPS, ICML), you can paste yours below so the community can read it here.
Videos
No videos yet. Explain this paper in a talk, walkthrough, or lecture? Add one.
Taxonomy
TopicsHealth Systems, Economic Evaluations, Quality of Life · Global Health Care Issues · Healthcare Policy and Management
INTRODUCTION
Ischemic heart disease was responsible for more than 9.4 million deaths and 185 million disability-adjusted life years globally in 2021.^1^ Acute coronary syndrome (ACS), comprising acute myocardial infarction (MI) and unstable angina, was responsible for 51,000 events in Australia in 2018, of which 40,200 were new events (34,000 non-fatal and 6200 fatal).^2^ The impact of MI extends beyond morbidity and mortality. MI is associated with profound economic costs for the individuals who experience MI and the healthcare system.^3–8^
The staggering cost impact of coronary heart disease (CHD) was reported by studies from European Union and the USA.^3,7^ In Australia, the Heart Foundation reported ACS would cost the Australian Government 1.9 billion Australian dollars (AUD) in 2017/2018.^5^ Furthermore, ACS accounted for AUD 3.7 billion in productivity loss, AUD 620.3 million in out-of-pocket costs and AUD 644.6 million in informal care costs.^4^ A recent study projected cardiovascular diseases (CVD) would cost the Australian healthcare system around AUD 61.9 billion between 2020 and 2029.^8^
Current Australian cost estimates are reported at the broad level—there is still a paucity of data related to current cost burden of MI by important sociodemographic characteristics including age, sex, comorbidities, socioeconomic disadvantage and year of follow-up.^4–6,8^ Moreover, previous Australian projection studies were based on the Australian National Health Survey which may lack granular clinical data on MI.^9,10^ Hence, the current study used a robust, large, linked data, which is capable of providing accurate and generalizable cost estimates for people with MI.
The overall objective of this study was to estimate the current and future healthcare cost burden of MI in Australia from a healthcare system perspective.
METHOD
Methods for Estimating the Current Cost Burden of Myocardial Infarction
Data Sources
The cohort for estimating the current chronic management cost of MI was identified from the VAED. We included people discharged from public or private hospitals across Victoria after admission due to MI (International Classification of Diseases (ICD)−10-Australian Modified (AM) codes: I21-I22) between 1 July 2012 and 30 June 2017 (with follow-up data until 30 June 2018).^11–14^ To estimate costs, the Australian Institute of Health and Welfare (AIHW) linked data from the VAED to data from the Pharmaceutical Benefits Scheme (PBS) related to medication dispensing (see Supplementary figure S1 for details) and to data from the Medicare Benefits Schedule (MBS) related to investigations and procedures (see Supplementary figure S2 for details).^11^ The AIHW also linked the cohort to National Death Index (NDI) to track vital status.^11^ Hospital admission costs were derived from the National Hospital Cost Data Collection (NHCDC) report covering the years 2012/13 to 2017/18 (see Supplementary Figure S3 for details). Our study adopted a healthcare system perspective, and all costs were adjusted to 2019 AUD using the Health Price Index^15^ to make the values consistent with the cost burden projection (which begun in 2019).
Exposures
We stratified the chronic management costs of MI by a number of demographic and clinical characteristics, including age, sex, type of MI (ST-elevation MI (STEMI; ICD-10-AM codes I210-I213) and non-STEMI (I214-I219)), comorbidities (hypertension and diabetes), socioeconomic disadvantage and duration of follow-up (i.e. time since the MI).^11^ Diabetes and hypertension status were defined via secondary diagnosis codes during admission with MI.^11,14^ The Australian Index of Relative Socioeconomic Disadvantage (IRSD) was used to summarize information about the economic and social condition within an area.^11,16^ We assigned an IRSD to each individual based on their last known postcode before admission for MI.^11^ Using the IRSD, areas were split into quintiles (relative to the entire population of Australia), the first quintile being the most socioeconomic disadvantaged and the fifth quintile being the least disadvantaged.^6,11,16^
Statistical Analysis
A generalized linear model with a gamma outcome distribution and negative inverse link function, weighted by person-years of follow-up, was used to estimate cost. Univariable models were fit to estimate the overall chronic management cost by age (where age was the mid-point of each age group (in 5-year intervals) and parameterized with spline effects), type of MI, presence of comorbidity status (diabetes and hypertension), socioeconomic disadvantage (IRSD) and year of follow-up. Multivariable models were fitted to estimate the adjusted overall chronic management costs after adjusting for covariates listed above. The crude and adjusted chronic management cost were presented as annual cost per person with the respective 95% confidence intervals (CIs).
Methods for Projecting the Future Cost Burden of Myocardial Infarction
Model Overview
A dynamic multistate Markov model was constructed to project the cost burden of MI for the Australian population aged 30 to 99 years, covering the period from 2019 to 2038 in annual cycles. The main outcome from the model was total healthcare costs—a combination of acute events cost of MI and chronic management cost following MI (i.e. any health-related cost after index MI).
Model Structure
The core dynamic multistate Markov model (Fig. 1) was adopted from a previous Australian projection of health burden of MI for the period 2019 to 2038.^13^ Briefly, the model constitutes four health states including three alive health states and one death health state (the only absorbing health state). The alive health states were “alive, with no MI”, “alive, new MI” and “alive, post-MI”. The death health state could be due to “death, without MI (i.e. death other)”, “fatal-MI” or “death, post-MI”. Transitions between health states were simulated using a Markov model. The dynamic nature of the model reflects the consideration of demographic change over the course of projection time where people who were aged under 30 years in previous years could enter the model once they reach age 30.Figure 1. Structure of the multistate Markov model and associated transition probabilities. MI, myocardial infarction; ℓ: 1-year period, λ: myocardial infarction incidence rate, µ_other_: mortality rate for people without myocardial infarction (i.e. other mortality), µ_post-MI_: post-myocardial infarction all-cause mortality rate, p_fatal_: proportion of fatal myocardial infarction ratesum: λ + µ_other_; tpsum: 1-exp(-ratesum* ℓ). Ratesum is the sum of incidence rate of Myocardial infarction and mortality rate for people without myocardial infarction (i.e. other mortality); tpsum: transition probability of ratesum.
Population
The Australian population aged 30 to 99 years in 2018 was used as the initial population for projection (see Supplementary Table S1).^17^ This population was then followed in annual cycles from 2019 to 2038. Australian residents and migrants were included in the model throughout the projection time whenever they were eligible to be part of the model (i.e. once they aged from 29 to 30 years at the beginning of each cycle or immigrated into Australia).^18^ The cohort exited the model under one of the three conditions: (a) after the 20-year follow-up; (b) upon reaching age 99, even if not been followed for the full 20 years; or (c) upon death before the end of follow-up period. The model assumed the age- and sex-specific rates and proportion remained constant throughout the projection period.
Data Sources
Data inputs to derive the transition probabilities for the dynamic model were primarily sourced from the VAED. Description of the VAED and data linkage was stated above.^11,13^ Victoria is the second populous state in Australia with a population of more than 6.5 million (25.6% of the total population) in 2021.^19^ Furthermore, Victoria has a similar age, sex, socioeconomic status, remoteness and ancestry distribution compared with the total Australian population.^19^ Thus, our sample is likely reasonably representative of Australia. In addition to the VAED, age-group and sex-specific prevalence of MI and all-cause mortality from the general Australian population was supplemented from the AIHW and Australian Bureau of Statistics (ABS), respectively.^20,21^
Costs incorporated in the dynamic model were based on the healthcare system perspective. Acute event costs related to hospitalization due to MI were sourced from the NHCDC version 10 round 24 for 2019/20 (see Supplementary table S2).^22^ In the base case, we assumed that half of the death due to MI (i.e. fatal-MI) occurred while hospitalized and, therefore, would incur acute events cost.^6,8^ Furthermore, we assumed that the acute event costs were the same by age and sex.^22^
Chronic management costs were based on the predicted single-year age follow-up costs for the cohort with MI in the VAED. To generate cost inputs for the dynamic model, a generalized linear model was fit with a spline effects of age and time since index MI, and an interaction between the two, stratified by sex. These models were then used to estimate the chronic management cost of MI by sex, age and year of follow-up (see Supplementary Table S3). All costs in projections were adjusted to 2019 AUD using the Health Price Index.^15^
Estimating Transition Probabilities for the Dynamic Multistate Markov Model
Proportions and rates used in the dynamic multistate Markov model were estimated using generalized linear models. Full details of the models applied to estimate the rates and proportion have been described elsewhere.^13^ The estimated rates were converted to transition probabilities.^23^
Outcomes
Once the model was populated by the transition probabilities and proportions, outcomes related to health burden of MI were projected including number of MI events and years of life lived with MI.^13^ To project the acute events cost of MI over 20 years, the acute event cost described above was multiplied by the number of non-fatal MIs and half of the projected number of fatal-MIs. Likewise, the projected chronic management cost was calculated by multiplying the projected years of life lived with MI (undiscounted) with the single year age estimated chronic management cost for cohorts in the VAED. The projected total healthcare cost was calculated by combining the projected acute events cost and chronic management cost. For all projected costs, a 5% annual discounting was applied in the base case.^23^ The 5% annual discount rate reflects the Pharmaceutical Benefits Advisory Committee guideline for costs and health benefits that occur beyond the first year.^24^ Projected costs were presented by age-group and yearly projection period, stratified by sex, at a population level.
Sensitivity and Scenario Analysis
To derive the 95% uncertainty intervals (UI) for the projected cost burden outcomes, Monte-Carlo simulation with 1000 iterations was performed by drawing distributions appropriate for each parameter (see Supplementary Table S4). Scenario analyses were also performed including: (a) varying the discount rate (0% and 3%), (b) considering all people with fatal-IS would incur acute event costs and (c) changing the duration of projection from 20 to 10 years (2019–2028). All analyses were performed using Stata version 18.0 (StataCorp, USA).
Model Validation
Model validation was performed based on the assessment of the Validation Status of Health Economics decision models.^25^ To check face validity, we compared our projected, undiscounted total healthcare cost of MI for 2019 to 2021 to the AIHW reported cost of coronary heart disease (CHD) for year 2019 to 2021 (for further details, see Supplementary material page 19 and Supplementary Figure S4).^15,26,27^
RESULT
Current Annual Chronic Management Costs Following Myocardial Infarction
A total of 59,260 people with MI (with 135,649-person years of follow-up) were included in the study and followed for up to 6 years. The overall adjusted annual chronic management cost per person was AUD 14,412 (95% CI 14,282, 14,542). People with NSTEMI had higher chronic management costs per person, 15,112 AUD (95% CI 14,957, 15,266), compared to people diagnosed with STEMI, AUD 12,052 (95% CI 11,834, 12,270). Males incurred higher chronic management cost per person than females, AUD 14,666 (95% CI 14,499, 14,833) and AUD 13,959 (95%CI 13,748, 14,171), respectively (Table 1). Table 1. Estimated Chronic Management Cost Following Myocardial Infarction Using Cohorts in the Victorian Admitted Episode DatasetVariableNPerson-years of follow-upTotal chronic cost per person (in AUD)Total chronic cost per person (in AUD)UnadjustedLBUBAdjusted**LBUBOverall59,260135,64913,84813,73813,95714,41214,28214,542NSTEMI44,04797,42115,10014,95915,24015,11214,95715,266STEMI15,21338,22810,65710,49810,81612,05211,83412,270Sex Male39,69092,50113,62413,49313,75414,66614,49914,833 Female19,57043,14814,32714,12614,52813,95913,74814,171Age (in years) 30–399832601831977978839931986849954 40–49460212,124857183718771910188769325 50–5910,33027,21694659308962110,097992110,274 60–6913,77234,79813,16812,96613,37013,77513,55014,000 70–7913,77731,19617,62517,34917,90117,29417,01317,575 ≥ 8015,79627,71416,51116,27516,74516,87016,60817,132Hypertension Yes55,147124,56514,47914,35914,60014,61814,48414,751 No411311,0836746655869359676928910,064Diabetes Yes18,13537,34319,99419,69320,29618,99418,69219,296 No41,12598,30511,51311,40611,62012,28912,16312,416IRSD quintile 1 (most disadvantaged)12,10026,41714,81414,62315,00414,50914,30114,717 211,38525,29914,51814,39714,63914,43614,30114,573 311,28526,22314,36614,25014,48014,39914,26814,530 412,25728,15814,19314,05714,33014,35514,19514,515 5 (least disadvantaged)977822,77414,04813,87714,21914,31814,11614,519Follow-up Year 159,26047,76615,45415,31115,59615,87015,71216,026 Year 240,29734,58012,91012,80113,02013,42013,29813,542 Year 329,26824,65711,08510,96211,21011,67711,53711,817 Year 420,26516,38197139575985110,36010,20410,516 Year 512,6459340864384988787932391589488 Year 659562925778576387932848283138652N number of people with myocardial infarction, NSTEMI non-ST-segment elevated myocardial infarction, STEMI ST-elevated myocardial infarction, IRSD index of relative socioeconomic disadvantage, LB lower bound of the confidence interval (2.5%), UB upper bound of the confidence interval (97.5%), AUD Australian dollar^*^Total chronic management cost is the composite of hospital admission cost, medication cost and Medicare Benefits Schedule cost^**^Total chronic management cost adjusted for age, sex, hypertension, diabetes, index of relative socioeconomic disadvantage and follow-up time
Chronic management cost per person increased with age. People in the most socioeconomically disadvantaged quintile (first quintile) had the highest chronic management cost per person. The annual chronic management cost per person declined with years of follow-up, where the highest cost per person incurred in the first year of follow-up, AUD 15,870 (95% CI 15,712, 16,026). There was a slight increase in the chronic management cost after adjusting for covariates compared to the unadjusted estimates across the sociodemographic, clinical and socioeconomic status variables.
Crude estimates of hospital admission cost, MBS cost and medication cost also exhibited the same patterns as the adjusted annual chronic management cost per person (see Supplementary Table S5 and Supplementary Figure S1-Supplemetary Figure S3). Hospital admission cost accounted the highest proportion 63.5% (AUD 8789) of the total healthcare cost followed by drug cost 19.0% (AUD 2636) and Medicare cost 17.5% (AUD 2422) (see Supplementary Table S5).
Projection of the Cost Burden of Myocardial Infarction for the Australian Population Using a Dynamic Model
The projected total healthcare cost of MI was AUD 85.1 billion (95% UI 80.8 billion, 89.8 billion) from 2019 to 2038, with chronic management cost accounting for 93.6% (AUD 79.6 billion) and acute events cost accounting for 6.4% (AUD 5.5 billion) of the total healthcare cost (see Fig. 2, Tables 2 and 3 and Supplementary table S6). The cost burden was higher for males than females throughout the projection period (see Supplementary table S7-S15). Stratification of the cost burden by age-group and sex also showed higher cost burden for males than females across the age groups (see Tables 2 and 3, Fig. 2 and Supplementary Table S6). The highest cost burden was observed in 70–79 years age-group in both sexes (Tables 2 and 3, Fig. 2 and Supplementary table S6).Figure 2. Projected healthcare cost of Myocardial infarction for Australian population aged between 30 and 99 years over 20 years (2019–2038) stratified by sex. AUD, Australian dollar.Table 2. Projected Acute Events Cost of Myocardial Infarction by Age Group for the Australian Population aged 30–99 Years Over the 20-Year Period (2019–2038)Age groupN**Acute costLBUBProjected acute cost of myocardial infarction for male population 30–3934,410214,998,330173,460,975260,874,800 40–4953,857333,075,606271,228,822403,363,390 50–5980,192502,328,696409,161,484605,812,936 60–69118,738740,540,772602,516,116889,044,688 70–79148,647907,675,976735,770,8961,097,754,584 80–89123,505720,355,908587,836,324866,915,348 90–9948,849271,169,817220,782,216326,226,007 Total608,1973,690,145,0243,537,532,1603,828,261,376Projected acute cost of myocardial infarction for female population 30–39797749,943,56739,595,00461,123,676 40–4914,95392,344,90974,593,543112,724,911 50–5926,700167,096,358134,831,359202,428,434 60–6948,240300,008,850244,049,620363,202,356 70–7974,304450,966,180367,700,570546,060,436 80–8979,267465,254,876380,367,176564,013,884 90–9943,277250,596,123204,136,348302,235,794 Total294,7191,776,210,8161,689,022,4641,873,094,272Projected total acute cost of myocardial infarction for total population 30–3942,387264,941,897213,055,979321,998,476 40–4968,810425,420,515345,822,365516,088,301 50–59106,892669,425,054543,992,843808,241,370 60–69166,9781,040,549,622846,565,7361,252,247,044 70–79222,9511,358,642,1561,103,471,4661,643,815,020 80–89202,7721,185,610,784968,203,5001,430,929,232 90–9992,126521,765,940424,918,564628,461,801 Total902,9165,466,355,8405,226,554,6245,701,355,648N* number of people, LB lower bound of the uncertainty interval (2.5%), UB upper bound of the uncertainty interval (97.5%), AUD Australian dollar^^Number of people for acute events cost projection is based on the number of people with non-fatal myocardial infarction and half of the people with fatal myocardial infarctionTable 3Projected Chronic Management Cost Following Myocardial Infarction by Age-Group for the Australian Population Aged 30–99 Years Over the 20-Year Period (2019–2038)Age groupN**Chronic costLBUBProjected chronic cost of myocardial infarction for male population 30–39464,6061,451,262,1441,176,832,7201,796,880,848 40–49773,0282,383,477,3442,205,623,0882,584,058,864 50–591,204,2444,750,677,0244,531,126,3684,995,023,584 60–691,796,45111,003,290,62410,593,402,30411,453,784,128 70–792,180,74916,881,441,02416,237,848,96017,584,345,728 80–891,623,73812,380,295,29611,802,833,15213,008,690,432 90–99504,5843,511,594,4563,203,460,6003,855,601,792 Total8,547,40052,362,039,29649,803,747,32855,279,443,968Projected chronic cost of myocardial infarction for female population 30–39298,082985,087,856746,000,4721,339,383,208 40–49392,4881,626,624,7601,460,030,5601,831,360,160 50–59584,3562,744,633,2802,561,714,3522,951,426,608 60–69866,8015,594,447,2005,307,299,7125,899,661,344 70–791,069,8348,425,865,2808,039,659,3288,821,699,392 80–89888,2965,880,180,1605,627,954,6886,146,802,464 90–99379,9451,994,671,5761,848,151,8802,156,077,480 Total4,479,80127,251,509,24825,606,905,85629,042,716,672Projected total chronic cost of myocardial infarction for total population 30–39762,6882,436,350,0001,922,833,1923,136,264,056 40–491,165,5164,010,102,1043,665,653,6484,415,419,024 50–591,788,6007,495,310,3047,092,840,7207,946,450,192 60–692,663,25216,597,737,82415,900,702,01617,353,445,472 70–793,250,58325,307,306,30424,277,508,28826,406,045,120 80–892,512,03418,260,475,45617,430,787,84019,155,492,896 90–99884,5295,506,266,0325,051,612,4806,011,679,272 Total13,027,20179,613,548,54475,410,653,18484,322,160,640N number of people, LB lower bound of the uncertainty interval (2.5%), UB upper bound of the uncertainty interval (97.5%), AUD Australian dollar^*^Number of people for chronic management cost projection is based on the number of people with prevalent myocardial infarction at the beginning of each cycle
Scenario Analyses
The projected total healthcare cost increased by 18.1% (AUD 15.4 billion) when the annual discounting rate was reduced from 5 to 3% (Table 4). Furthermore, applying no annual discounting rate, increased the projected total healthcare cost by 56.3% (AUD 47.9 billion). Assuming all fatal-MI events occurred while hospitalized increased the projected acute events cost by 1.9% (AUD 103 million) and the total healthcare cost by 0.1%. Reducing the projection period from 20 to 10 years (2019–2028) decreased the projected total healthcare cost by 41.4% (AUD 35.2 billion). Table 4. Results of Scenario Analyses for Projected Acute Events, Chronic Management and Total Healthcare Cost for the Australian Population Aged 30–99 YearsOutcomeNEstimate (in AUD)LBUBScenario analyses for male population 20-year projection base case analysis 5% discount Acute cost608,1973,690,145,0243,537,532,1603,828,261,376 Chronic cost8,547,40052,362,039,29649,803,747,32855,279,443,968 Total cost9,155,59856,052,183,04053,479,501,82458,976,018,432 3% discount Acute cost608,1974,387,661,8244,278,142,9764,626,365,952 Chronic cost8,547,40061,925,998,59258,877,444,09665,409,359,872 Total cost9,155,59866,313,662,46463,261,302,78469,774,573,568 0% discount Acute cost608,1975,862,155,2645,620,211,2006,078,915,584 Chronic cost8,547,40082,078,638,08078,004,420,60886,698,246,144 Total cost9,155,59887,940,792,32083,872,645,12092,534,407,168 All fatal MI^†^ 5% discount Acute cost624,8283,752,227,3283,597,041,1523,891,004,928 Chronic cost8,547,40052,362,039,29649,803,747,32855,279,443,968 Total cost9,172,22956,114,266,11253,540,831,23259,037,667,328 10-year projection 5% discount Acute cost268,0002,071,633,1521,984,139,2642,150,857,216 Chronic cost3,958,76430,448,887,80828,968,259,58432,147,044,352 Total cost4,226,76432,520,521,72831,049,043,96834,195,828,736Scenario analyses for female population 20-year projection base case analysis 5% discount Acute cost294,7191,776,210,8161,689,022,4641,873,094,272 Chronic cost4,479,80127,251,509,24825,606,905,85629,042,716,672 Total cost4,774,52029,027,721,21627,350,888,44830,844,469,248 3% discount Acute cost294,7192,163,521,2802,010,777,3442,229,997,568 Chronic cost4,479,80132,067,782,65630,104,608,76834,180,655,104 Total cost4,774,52034,182,154,24032,189,181,95236,333,748,224 0% discount Acute cost294,7192,830,135,0402,691,332,3522,985,469,440 Chronic cost4,479,80142,176,221,18439,571,988,48044,982,644,736 Total cost4,774,52045,006,352,38442,387,193,85647,859,097,600 All fatal MI^†^ 5% discount Acute cost305,6461,817,300,9921,729,118,7201,915,579,776 Chronic cost4,479,80127,251,509,24825,606,905,85629,042,716,672 Total cost4,785,44729,068,810,24027,391,600,64030,886,912,000 10-year projection 5% discount Acute cost128,509989,287,744939,698,3041,042,637,440 Chronic cost2,168,90216,373,737,47215,444,387,84017,438,158,848 Total cost2,297,41117,363,025,92016,419,580,92818,449,604,608Scenario analyses for total population 20-year projection base case analysis 5% discount Acute cost902,9165,466,355,8405,226,554,6245,701,355,648 Chronic cost13,027,20179,613,548,54475,410,653,18484,322,160,640 Total cost13,930,11885,079,904,25680,830,390,27289,820,487,680 3% discount Acute cost902,9166,551,183,1046,288,920,3206,856,363,520 Chronic cost13,027,20193,993,781,24888,982,052,86499,590,014,976 Total cost13,930,118100,495,816,70495,450,484,736106,108,321,792 0% discount Acute cost902,9168,692,290,3048,311,543,5529,064,385,024 Chronic cost13,027,201124,254,859,264117,576,409,088131,680,890,880 Total cost13,930,118132,947,144,704126,259,838,976140,393,504,768 All fatal MI^†^ 5% discount Acute cost930,4745,569,528,3205,326,159,8725,806,584,704 Chronic cost13,027,20179,613,548,54475,410,653,18484,322,160,640 Total cost13,957,67685,183,076,35280,932,431,87289,924,579,328 10-year projection 5% discount Acute cost396,5093,060,920,8962,923,837,5683,193,494,656 Chronic cost6,127,66646,822,625,28044,412,647,42449,585,203,200 Total cost**6,524,17549,883,547,64847,468,624,89652,645,433,344N* number of people, LB lower bound of the 95% uncertainty interval (2.5%), UB upper bound of the 95% uncertainty interval (97.5%), AUD Australian dollar^*^Number of people for acute events cost projection is based on the number of people with non-fatal myocardial infarction and half of the people with fatal myocardial infarctionNumber of people for chronic management cost projection is based on the number of people with prevalent myocardial infarction at the beginning of each cycleNumber of people for total healthcare cost projection is the sum of people considered for acute events and chronic management cost projection^**^Total cost is the sum of acute events cost and chronic management cost (i.e. total healthcare cost)^†^Assuming that all fatal myocardial infarction events happened after hospitalization in the dynamic model and full costs is implemented
DISCUSSION
The overall current annual chronic management cost of MI was estimated to be AUD 14,412 per person. The projection of the healthcare cost burden of MI showed an increasing burden for the Australian healthcare system for the coming years incurring a total of AUD 85.1 billion between 2019 and 2038.
Our study showed that hospital admission cost accounted for the highest proportion of the total chronic management cost per person. Consistently, Ademi et al. also reported people with coronary artery disease incurred the highest cost in hospitalization.^28^
Our study also showed a higher overall chronic management cost in the first-year follow-up and gradually declined afterwards. This was consistent with multiple studies which have demonstrated higher proportion of readmissions within the first 12 months (most importantly the first 30 days) after index MI because of cardiovascular- and non-cardiovascular reasons.^11,29^ These readmissions incur resource use ranging from investigation to treatment.^28,30^
A higher chronic management cost was observed in our study for people in most socioeconomically disadvantaged quintile. Socioeconomic disadvantage plays a crucial role in the burden of MI, with studies indicating higher hospital readmission and mortality rates among those in the most disadvantaged quintile.^6,11,31^
The cost burden of MI is expected to increase for the coming years as per our dynamic model projection. Our findings uphold a previous study conducted by Marquina et al. which projected the cost burden of CVD (mainly MI and stroke) in Australia.^8^ Differences in cost burden between our study (AUD 46.8 billion over 10 years) and Marquina et al. (AUD 61.9 billion)^8^ could be attributed to the conditions selected for the model and the types of data sources retrieved to model the cost projection.
The projected healthcare cost burden of MI indicates the significance of proactive prevention strategies to reduce the disease burden for the Australian population. Priority setting in population-wide primary prevention strategies will have a profound effect on curbing the incidence of MI.^32,33^ Secondary prevention strategies are also important in reducing the recurrence of MI and could curb follow-up costs related to rehospitalization and have been shown to be cost-effective.^34^
Strengths and Limitations
The main strength of our study was the use of a large, representative dataset, the VAED, to estimate the current and future burden cost burden of MI. Linking multiple data sources to derive granular cost data also ensured we captured all costs for all individuals, without recall bias.
However, our study has several limitations. First, costs related to acute events were assumed to be similar regardless age and sex. Second, a conventional approach was taken in projecting the health burden of MI where rates and proportions were considered to remain stable throughout the projection time.^13^ As a result, the projected health burden of MI has likely been overestimated^13^ as studies showed that conventional approach of projecting the mortalities associated with CHD was higher than trend-based projections.^35,36^ Consequently, our projection of the healthcare cost burden of MI has also likely been overestimated. Thus, consideration should be given while interpreting the projection estimates where the results might change based on the assumed rates and proportions used for the dynamic model. Third, while the Victorian population (our data source) is likely representative of the Australian population, it is possible there are differences between Victoria and the rest of Australia.
Fourth, productivity loss due to MI was not considered in our study.^4,8^ Furthermore, costs associated with social and informal care were also not considered in our study.^7^ Hence, our estimated current and projected future cost burden of MI would have even been higher if productivity loss, social and informal care costs were also included in the model.
Lastly, we were unable to validate our model using publicly available data on the total cost of MI. However, we conducted face validation using the estimated cost of CHD provided by AIHW.^15,26,27^ Our CVD cost estimates among people with MI were slightly lower than the estimates from the AIHW’s for CVD costs attributable to CHD (for further details, see Supplementary Material Page 19 and Supplementary Figure S4). This discrepancy can likely be attributed, at least in part, to the inclusion of non-MI conditions (e.g. angina) in the AIHW’s CHD cost estimates.
CONCLUSION
Our projections suggest that MI will cost the Australian healthcare system over AUD 85 billion in the coming years. Cost estimates based on key sociodemographic characteristics and socioeconomic disadvantage are expected to inform future health economic modelling studies for MI prevention strategies and interventions.
Supplementary Information
Below is the link to the electronic supplementary material.Supplementary file1 (DOCX 551 KB)
The reference list from the paper itself. Each links out to its DOI / PubMed record.
- 1AIHW. Estimating the incidence of stroke and acute coronary syndrome using the National Integrated Health Services Information Analysis Asset: Australian Institute of Health and Welfare 2022. Available from: https://www.aihw.gov.au/reports/heart-stroke-vascular-diseases/incidence-of-stroke-acute-coronary-syndrome/contents/summary. Accessed 4 June 2023.
- 2American Heart Association. Cardiovascular disease: A costly burden for America projections through 2035. American Heart Association; 2017. p 3-14. https://www.heart.org/-/media/Files/About-Us/Policy-Research/Fact-Sheets/Public-Health-Advocacy-and-Research/CVD-A-Costly-Burden-for-America-Projections-Through-2035.pdf. Accessed 10 Jan 2024.
- 3Heart Foundation. Economic Cost of Acute Coronary Syndrome in Australia:The Cost to Individuals and Their Families: Heart Foundation; 2018. Available from: https://www.heartfoundation.org.au/getmedia/02b 2ea 88-59db-4caf-96e 8-83ccab 3945 af/Economic_cost_of_ACS_in_Australia__the_cost_to_individulas_and_their_families.pdf. Accessed 1 Jan 2024.
- 4Heart Foundation. Economic Cost of Acute Coronary Syndrome in Australia: The Cost to Governments: Heart Foundation 2018. Available from: https://www.heartfoundation.org.au/getmedia/8ba 34ebc-e 4b 7-44d 7-a 5a 6-15feac 1b 86d 8/Economic_cost_of_ACS_in_Australia__the_cost_to_governments.pdf. Accessed 3 Jan 2024.
- 5Hastings, K., Marquina, C., Morton, J. et al. Projected New-Onset Cardiovascular Disease by Socioeconomic Group in Australia. Pharmaco Economics 40, 449–460 (2022). 10.1007/s 40273-021-01127-110.1007/s 40273-021-01127-1PMC 876153535037191 · doi ↗ · pubmed ↗
- 6ABS. Australian National Health Survey, First Results 2011. Australian Bureau of Statistics 2012. Available from: https://www.abs.gov.au/AUSSTATS/[email protected]/Lookup/4364.0.55.001Explanatory%20Notes 602011-12?Open Document. Accessed 21 Oct 2023.
- 7ABS. National Health Survey: First results, 2017–18 financial year. Australian Bureau of Statistics 2018. Available from: https://www.abs.gov.au/statistics/health/health-conditions-and-risks/national-health-survey-first-results/latest-release. Accessed 21 Oct 2023.
- 8Abebe TB, Morton JI, Ilomaki J, Ademi Z. Future burden of myocardial infarction in Australia: impact on health outcomes between 2019 and 2038. European Heart Journal - Quality of Care and Clinical Outcomes. 10(5)421–430, 10.1093/ehjqcco/qcad 06210.1093/ehjqcco/qcad 062PMC 1130719837852668 · doi ↗ · pubmed ↗