The ability of SABRE, a new quantitative receptor function model, to quantify receptor binding from even challenging concentration-effect data with a single unified fit
Barbara Olah, Vera Tarjanyi, Gabor Viczjan, Ignac Ovari, Andras Csoto, Zoltan Szilvassy, Bela Juhasz, Judit Zsuga, Rudolf Gesztelyi, Tamas Erdei

TL;DR
This paper introduces a new model called SABRE that improves the analysis of receptor binding data using a single unified fit, even with challenging datasets.
Contribution
The paper presents a new multiline model within the SABRE framework that enables reliable receptor binding analysis with a single global fit.
Findings
The multiline SABRE model provides reliable results even with uncertain or challenging data.
A six-model global fitting approach was found to be the most suitable for the analyzed data.
The study highlights the importance of fitting SABRE equations effectively to functional data.
Abstract
The Signal Amplification, Binding affinity, and Receptor-activation Efficacy (SABRE) model is the most recent general and quantitative model of receptor function. A specific extension of the SABRE model enables the determination of Kd (the equilibrium dissociation constant of the agonist-receptor complex) and q (the fraction of receptors remaining operable after pretreatment with an irreversible receptor antagonist) from exclusively functional data. In the present investigation, we reevaluated the concentration-effect (E/c) data of our related recent study on the SABRE model to assess the properties of our newly developed multiline model, inspired by professional criticism of our previous study in question. We have found this multiline model, constructed within the framework of the SABRE model, to be capable of providing reliable results via one global fitting (i.e., with a single…
Click any figure to enlarge with its caption.
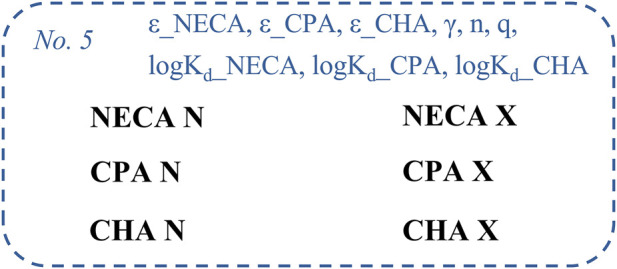 FIGURE 1
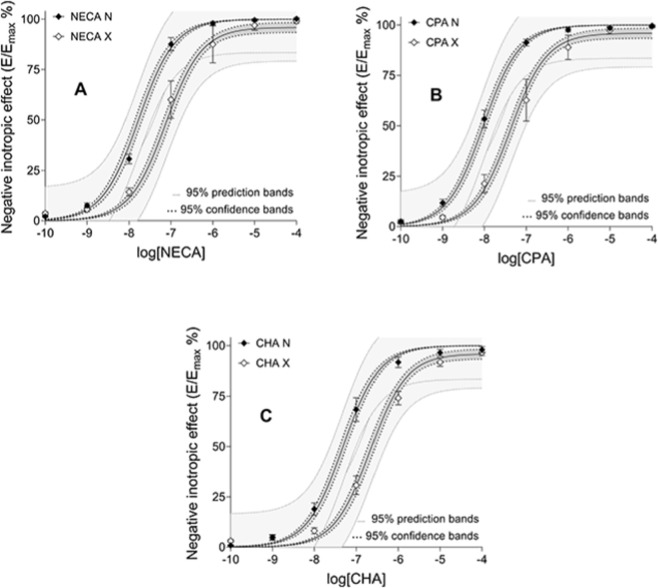 FIGURE 2
| Parameters | NECA N | NECA X | CPA N | CPA X | CHA N | CHA X |
|---|---|---|---|---|---|---|
| ε parameters | = 1.00 | |||||
| n | = 1.00 | |||||
| γ | 85.43 | |||||
| 44.29 to 254.20 | ||||||
| 0.9833 | ||||||
| logKd parameters | −5.84 | −6.09 | −5.38 | |||
| −6.12 to −5.37 | −6.38 to −5.62 | −5.66 to −4.91 | ||||
| 0.9372 | 0.9495 | 0.9441 | ||||
| Kd | 1.4 µM | 0.8 µM | 4.2 µM | |||
| q | 0.22 | |||||
| 0.17 to 0.27 | ||||||
| 0.6058 | ||||||
| R2 | 0.9878 | 0.9329 | 0.9833 | 0.9127 | 0.9684 | 0.9734 |
| Gl. R2 | 0.9603 | |||||
| Adj. R2 | 0.9597 | |||||
Peer Reviews
No public reviews on file for this paper yet. If you reviewed it on a platform where reviews are public (OpenReview, ICLR, NeurIPS, ICML), you can paste yours below so the community can read it here.
Videos
No videos yet. Explain this paper in a talk, walkthrough, or lecture? Add one.
Taxonomy
TopicsReceptor Mechanisms and Signaling · Neuropeptides and Animal Physiology · Computational Drug Discovery Methods
Introduction
1
Modelling the function of receptors (in a pharmacological sense) can be useful in solving practical problems and may also provide valuable information about the underlying mechanisms of biological phenomena (Motulsky and Christopoulos, 2004; Kenakin, 2022). The most recent general and quantitative receptor function model is the Signal Amplification, Binding affinity, and Receptor-activation Efficacy (SABRE) model (Buchwald, 2017; Buchwald, 2019; Buchwald, 2020; Buchwald, 2022; Buchwald, 2023; Buchwald, 2025a). In addition to providing a tool to understand and simulate experimental phenomena, this model can be used to obtain estimates for K_d_ (the equilibrium dissociation constant of the agonist-receptor complex) and q (the fraction of the operable receptors after partial irreversible receptor inactivation) from purely functional data, specifically from appropriately constructed concentration-effect (E/c) curves (Buchwald, 2022).
In a previous study from our laboratory, we aimed to demonstrate the utility and main features of the SABRE model by evaluating E/c data generated with three A_1_ adenosine receptor full agonists in isolated, paced guinea pig left atria, before and after a pretreatment with an irreversible A_1_ adenosine receptor antagonist (Olah et al., 2025). In that study, we developed four fitting strategies of the SABRE model and compared them with one another. Finally, we recommended a two-step procedure (consisting of the third and fourth fitting strategies) as the best way to evaluate the presented sort of data (Olah et al., 2025).
Soon after, the results of our above-mentioned study (Olah et al., 2025) were commented on by Buchwald (2025b) and a single-step procedure was suggested as a more appropriate manner to achieve the same goal. We have found the core idea of this improvement noteworthy. Thus, we hereby propose our own new multiline model, designed for the current version of the GraphPad Prism software, that uses the same nomenclature and “fitting logic” as before (Olah et al., 2025), but incorporates the improvement suggested by Buchwald (2025b). Accordingly, we have named this multiline model the “fifth” fitting strategy, as a continuation of the four fitting strategies described in our previous work (Olah et al., 2025).
Methods
2
The reevaluated data
2.1
In the present study, we reevaluated the E/c data that were used in a recent study (Olah et al., 2025) and were originally generated in an earlier investigation from our laboratory (Gesztelyi et al., 2013). These E/c curves were constructed with NECA (5′-(N-ethylcarboxamido)adenosine), CPA (N ^ 6 ^-cyclopentyladenosine) and CHA (N ^ 6 ^-cyclohexyladenosine), generally considered to be A_1_ adenosine receptor full agonists (Fredholm et al., 2001; Deb et al., 2019). The E/c curves were constructed in the absence (labelled “N”) and presence (labelled “X”) of a pretreatment with FSCPX (8-cyclopentyl-N ^ 3 ^-[3-(4-(fluorosulfonyl)benzoyloxy)propyl]-N ^ 1 ^-propylxanthine), an irreversible A_1_ adenosine receptor antagonist (Srinivas et al., 1996). Thus, we worked with “Furchgott-type” data, i.e., E/c data obtained at different levels of the operable receptors (Furchgott, 1966; Furchgott and Bursztyn, 1967).
For curve plotting and fitting, the independent variable (X value) was the common logarithm of the molar concentration of the agonists. To obtain the dependent variable (Y value), the percentage decrease in the initial contractile force of the isolated and paced guinea pig left atria was first determined (E), and then this effect value was expressed as the percentage of the maximal effect (E_max_) achieved in the given experimental system during the given study (E/E_max_ %). Thus, in fact, we created E/E_max_ % vs. logc curves but, for simplicity, we called them E/c curves in this investigation as well.
The fifth fitting strategy, i.e., our newly proposed multiline model (constructed within the SABRE model)
2.2
Based on the suggestion of Buchwald (2025b), our new recommendation for fitting our “Furchgott-type” E/c data is the following six-model global fitting, presented as a multiline model designed for GraphPad Prism (RRID:SCR_002798):
Here, the six-model global regression means that a separate equation should be fitted to each data set (six equations for the E/c curves of the six experimental groups of the original investigation: Gesztelyi et al., 2013). For this curve fitting, some parameters were shared among some data sets (Figure 1; Table 1). In the final regression, n and the three ε parameters were constrained to unity (to improve the reliability of the other estimates), as previously (Olah et al., 2025). Importantly, a single fitting can provide all estimates for the parameters.
*The fifth fitting strategy of the SABRE receptor function model applied to six data sets, consisting of E/c curves of three synthetic A1 adenosine receptor full (or close to full) agonists (NECA, CPA, CHA), constructed in isolated, paced guinea pig left atria, in the absence (“N”) or presence (“X”) of a pretreatment with FSCPX, an irreversible A1 adenosine receptor antagonist. The SABRE parameters, which were shared among the data sets (at least before their constraint to unity), are marked in blue. E/c, concentration-effect; SABRE, Signal Amplification, Binding affinity, and Receptor-activation Efficacy; NECA, 5′-(N-ethylcarboxamido)adenosine; CPA, N
6 -cyclopentyladenosine; CHA, N
6 -cyclohexyladenosine; FSCPX: 8-cyclopentyl-N
3 -[3-(4-(fluorosulfonyl)benzoyloxy)propyl]-N
1 -propylxanthine.*
The parameters characterizing the postreceptorial signal handling (γ and n) apply to all data sets, while the parameters describing the particular agonist-receptor interactions (ε_NECA, ε_CPA, ε_CHA, logK_d__NECA, logK_d__CPA and logK_d__CHA) refer only to the data set pairs generated with the same agonist. Furthermore, the parameter characterizing the efficiency of the pretreatment with FSCPX (q) applies only to the three data sets that underwent this pretreatment. For the classic appearance of the multiline model, see: Supplementary Appendix.
Data processing and presentation
2.3
Curve plotting and fitting were implemented with GraphPad Prism 10.6.1 for Windows (GraphPad Software Inc., La Jolla, CA, USA).
The precision of regression was characterized by the width of the 95% confidence interval (CI) of the best-fit values. For computing 95% CIs, the “asymmetrical” option was always chosen. The precision of the curve fitting and the precision of the E/c curve data were characterized by the distance of the best-fit curve from the corresponding 95% confidence bands and by the 95% prediction bands, respectively.
When setting the way in which the software checks how well the experimental data define the model, the option “Identify ambiguous fits” was chosen.
The degree to which each variable parameter was intertwined with all the others was indicated by dependency, the value of which could range from 0 (independent parameter) to 1 (redundant parameter). Dependency values greater than 0.9 and 0.99 could be considered high and unacceptably high, respectively.
The goodness of fit of the model was quantified by the “individual” and global values of the coefficient of determination (R^2^) and the adjusted value of the global R^2^. This adjusted global R^2^ is much lower than the global R^2^ if the model contains redundant parameters (Graphpad, 2025).
Results
3
The logK_d_ and q values provided by the fifth fitting strategy were similar to the corresponding values obtained previously using the third fitting strategy (Olah et al., 2025). Moreover, the related reliability measures (95% confidence limits and dependency) showed some improvement owing to the fifth fitting strategy (Table 1). The γ and (especially) q values (plus the related reliability measures) determined with the fifth fitting strategy were also close to the corresponding data obtained with the fourth fitting strategy (Olah et al., 2025) (Table 1). The measures characterizing the fitting as a whole (the different sorts of R^2^) and the appearance of the best-fit curves and their confidence and prediction bands were also similar to those presented in our original work (Olah et al., 2025) (Table 1; Figure 2).
*The E/c curves of three A1 adenosine receptor full agonists, NECA (panel (A)), CPA (panel (B)) and CHA (panel (C)), generated in isolated, paced guinea pig left atria in the absence (filled symbols) and presence (open symbols) of a pretreatment with FSCPX, an irreversible A1 adenosine receptor antagonist. The x-axis shows the common logarithm of the molar concentration of the given agonist, while the y-axis denotes the direct negative inotropic effect expressed as a percentage of the maximal effect achieved in this system (±SEM). The continuous lines show the best-fit curves of the SABRE model, fitted according to the fifth fitting strategy. For more details (sharing, constraints), see: Table 1. The thick dotted lines indicate the 95% confidence bands, while the thin dotted lines represent the 95% prediction bands. E/c, concentration-effect; SABRE, Signal Amplification, Binding affinity, and Receptor-activation Efficacy; NECA, 5′-(N-ethylcarboxamido)adenosine; CPA, N
6 -cyclopentyladenosine; CHA, N
6 -cyclohexyladenosine; FSCPX, 8-cyclopentyl-N
3 -[3-(4-(fluorosulfonyl)benzoyloxy)propyl]-N
1 -propylxanthine.*
Discussion
4
In the present study, we have improved our previous work (Olah et al., 2025) by elaborating a fifth fitting strategy incorporating Buchwald’ suggestion, the core idea of which is that each agonist-related parameter should be individualized (for the specific agonist used: NECA, CPA and CHA) (Buchwald, 2025b). Thus, instead of ε and logK_d_, ε_agonist and logK_d__agonist (e.g., ε_NECA and logK_d__NECA) should be fitted. The curve fitting software, used here, allows the E/c curves generated with a particular agonist to be fitted only to the equation that contains the corresponding agonist-related parameters. This maneuver is similar to the one that allows the E/c curves without and with an FSCPX pretreatment to be fitted separately (and adequately). In this way, six equations can be obtained (as a combination of the three agonists and the two outcomes of the FSCPX pretreatment). The global nature of regression can be ensured by sharing the agonist-related parameters (ε_agonist and logK_d__agonist), γ, n and q.
In fact, the six equations in question were almost ready as the fourth fitting strategy (Olah et al., 2025). To finalize these equations, we replaced the nonspecific parameter ε and the specific logK_d_ values of the three agonists with the appropriate individualized parameters (ε_NECA, ε_CPA, ε_CHA, logK_d__NECA, logK_d__CPA and logK_d__CHA). To ensure a single unified fit, all these individualized agonist-related parameters were shared among the data sets (in addition to γ, n and q). The fitting constraints, which assigned each of the six equations to the corresponding one of the six data sets, could be left the same for the fifth strategy as for the fourth strategy.
Conclusion
5
Our present work has demonstrated that the most recent method for estimating K_d_ values of agonist-receptor complexes from E/c data (Buchwald, 2022), an application of the SABRE receptor function model (Buchwald, 2017; 2019), is capable of providing reliable results through one global fitting (i.e., with a single unified fit), even for our data with some challenge. This challenge stemmed from the fact that our E/c curves, constructed in the presence of an irreversible antagonist, did not show a decrease in their maximal effect (as compared to the corresponding control E/c curves), rendering these “Furchgott-type” data somewhat uncertain. Our results further emphasize the importance of finding the best way to fit the equations of the SABRE model to this type of functional data. In the present case, this “best way” was a properly constructed multiline model (i.e., a six-model global fitting).
The reference list from the paper itself. Each links out to its DOI / PubMed record.
- 1Buchwald P. (2017). A three-parameter two-state model of receptor function that incorporates affinity, efficacy, and signal amplification. Pharmacol. Res. Perspect. 5, e 00311. 10.1002/prp 2.311 28603630 PMC 5464340 · doi ↗ · pubmed ↗
- 2Buchwald P. (2019). A receptor model with binding affinity, activation efficacy, and signal amplification parameters for complex fractional response Versus occupancy data. Front. Pharmacol. 10, 605. 10.3389/fphar.2019.00605 31244653 PMC 6580154 · doi ↗ · pubmed ↗
- 3Buchwald P. (2020). A single unified model for fitting simple to complex receptor response data. Sci. Rep. 10, 13386. 10.1038/s 41598-020-70220-w 32770075 PMC 7414914 · doi ↗ · pubmed ↗
- 4Buchwald P. (2022). Quantification of receptor binding from response data obtained at different receptor levels: a simple individual sigmoid fitting and a unified SABRE approach. Sci. Rep. 12, 18833. 10.1038/s 41598-022-23588-w 36336760 PMC 9637741 · doi ↗ · pubmed ↗
- 5Buchwald P. (2023). Quantitative receptor model for responses that are left- or right-shifted versus occupancy (are more or less concentration sensitive): the SABRE approach. Front. Pharmacol. 14, 1274065. 10.3389/fphar.2023.1274065 38161688 PMC 10755021 · doi ↗ · pubmed ↗
- 6Buchwald P. (2025 a). Quantification of signal amplification for receptors: the Kd/EC 50 ratio of full agonists as a gain parameter. Front. Pharmacol. 16, 1541872. 10.3389/fphar.2025.1541872 40264679 PMC 12011844 · doi ↗ · pubmed ↗
- 7Buchwald P. (2025 b). Commentary: the flexibility of SABRE, a new quantitative receptor function model, in fitting challenging concentration-effect data. Front. Pharmacol. 16, 1675039. 10.3389/fphar.2025.1675039 41064444 PMC 12500538 · doi ↗ · pubmed ↗
- 8Deb P. K. Deka S. Borah P. Abed S. N. Klotz K. N. (2019). Medicinal chemistry and therapeutic potential of agonists, antagonists and allosteric modulators of A 1 adenosine receptor: current status and perspectives. Curr. Pharm. Des. 25, 2697–2715. 10.2174/1381612825666190716100509 31333094 · doi ↗ · pubmed ↗