Preliminary analysis of lifestyle and genetic factors for hyperuricemia and gout prevalence in the Yunnan Miao population of China
Qiaohong Li, Salma Saeed Khan, Hao Yan, Weiying Kong, Lu Qin, Linmei Wu, Lingjie Li, Weijun Gong, Hua Zheng, Haiyan Li

TL;DR
This study explores the prevalence of hyperuricemia and gout in the Miao population of Yunnan, China, linking it to lifestyle and potential genetic factors.
Contribution
The study provides preliminary insights into the interplay of lifestyle and SLC2A9/SLC22A12 genetic variations in hyperuricemia and gout among the Miao ethnic group.
Findings
Hyperuricemia and gout were more common in males and associated with alcohol, smoking, and higher BMI.
The hyperuricemia/gout group showed elevated uric acid, creatinine, and triglycerides, along with hematological changes.
SLC2A9_rs10939650 showed a possible association with hyperuricemia/gout, but no SNPs remained significant after Bonferroni correction.
Abstract
Hyperuricemia and gout are common public health problems, stemming from both genetic and lifestyle factors. Evidence from multi-ethnic regions in Yunnan Province remains limited. This preliminary study examined hyperuricemia and gout prevalence, related biomarkers, lifestyle patterns, and SLC2A9/SLC22A12 genetics variations among 88 participants from the Miao community in Yunnan Province China. A cross-sectional survey and biochemical study were conducted. Demographic and lifestyle data were collected, and blood samples were analyzed for serum biochemical indicators. Eight SNPs in SLC2A9 and SLC22A12 were genotyped. Logistic regression models were applied to allele and genotype data. Demographic and clinical analyses for Miao villagers (n = 88) suggested that the morbidities of hyperuricemia and gout were more frequent in male and showed significant association with alcohol…
Genes, proteins, chemicals, diseases, species, mutations and cell lines named across the full text — each resolved to its canonical identifier and authoritative record.
Click any figure to enlarge with its caption.
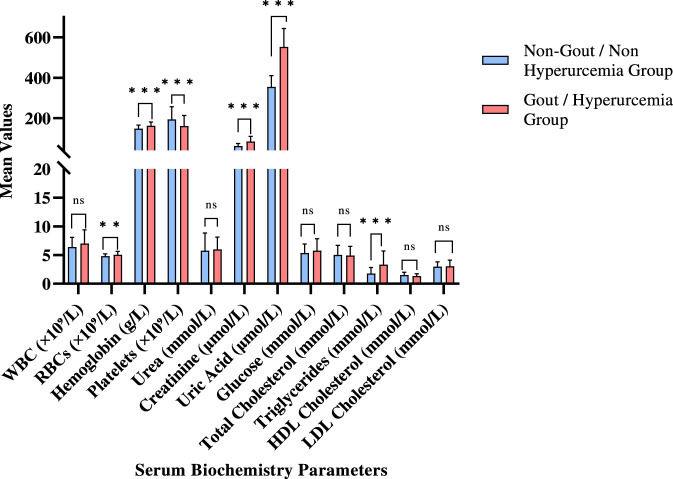 FIGURE 1
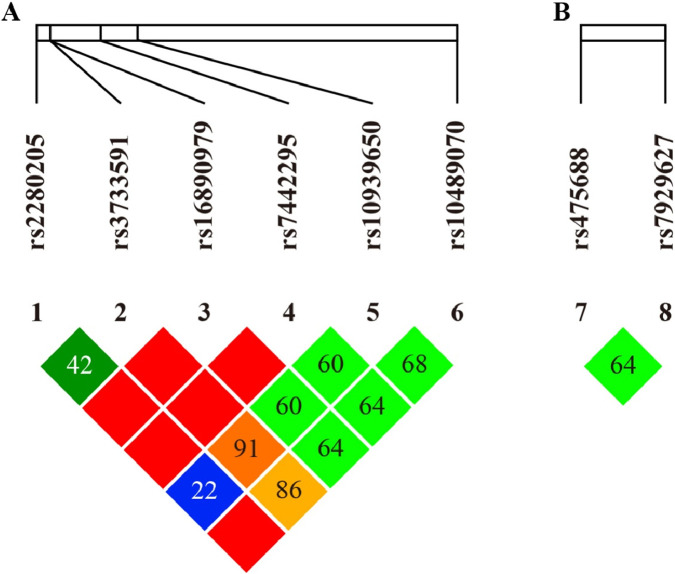 FIGURE 2
| SNP rsID | F-seq (5′-3′) | R-seq (5′-3′) |
|---|---|---|
| rs10489070 | GATGAGGTGCTCAAATGGGAAAG | AGGTCTAGCATGGCCCCAGATT |
| rs10939650 | CAGATAGAGACAGCCTCCTACTGACCT | GCTCTGGTCTGTGACTGTGTCCA |
| rs2280205 | GATGCCCCCTGTACTCAAGGTG | AAAATGAGCATCCACGCCTCTC |
| rs3733591-rs16890979 | CATTGAGGCCACAGAGCTGGTA | CCCTGCTGAAAGTCCATGTGTG |
| rs475688 | ATGGCAGCTTGACTCCCAACAC | GCCCTGCATCAGCATGAGAAC |
| rs7442295 | GGTGGCTGGGGCTTAAAATCAC | AAGAGGGCTGTCCCCAAAGGT |
| rs7929627 | CACTCAGGACAGGATACCCAGATG | GCCCCCATTTCTGTGGGTAGAG |
| Category | Subgroup | Hyperuricemia/Gout group (n = 49) | Non-Hyperuricemia/Non-gout group (n = 39) | χ2/t value |
|
|---|---|---|---|---|---|
| Gender | Female | 8 (16.33) | 28 (71.79) | 27.64 | <0.001* |
| Male | 41 (83.67) | 11 (28.21) | — | — | |
| Family history of hyperuricemia | No | 39 (79.59) | 36 (92.31) | 2.79 | 0.09 |
| Yes | 10 (20.41) | 3 (7.69) | — | — | |
| Family history of gout | No | 39 (79.59) | 35 (89.74) | 1.67 | 0.20 |
| Yes | 10 (20.41) | 4 (10.26) | — | — | |
| Medical history | None | 29 (60.42) | 35 (89.74) | 9.52 | <0.001* |
| Present | 19 (39.58) | 4 (10.26) | — | — | |
| Non—traumatic joint pain | No | 35 (71.43) | 37 (94.87) | 8.02 | <0.001* |
| Yes | 14 (28.57) | 2 (5.13) | — | — | |
| Subcutaneous tophi | No | 42 (89.36) | 39 (100.00) | 4.41 | 0.04* |
| Yes | 5 (10.64) | 0 (0.00) | — | — | |
| Consumption of whole grains | Occasional | 24 (48.98) | 26 (66.67) | 2.77 | 0.25 |
| Rarely | 23 (46.94) | 12 (30.77) | — | — | |
| Frequently | 2 (4.08) | 1 (2.56) | — | — | |
| Meat—based soups | Occasionally | 21 (42.86) | 20 (51.28) | 0.77 | 0.68 |
| Rarely | 6 (12.24) | 5 (12.82) | — | — | |
| Frequently | 22 (44.90) | 14 (35.90) | — | — | |
| Vegetable soups | Occasionally | 16 (33.33) | 15 (38.46) | 0.26 | 0.88 |
| Rarely | 3 (6.25) | 2 (5.13) | — | — | |
| Frequently | 29 (60.42) | 22 (56.41) | — | — | |
| Fresh fruit consumption | Occasionally | 24 (48.98) | 24 (61.54) | 2.17 | 0.34 |
| Rarely | 12 (24.49) | 5 (12.82) | — | — | |
| Frequently | 13 (26.53) | 10 (25.64) | — | — | |
| Tea consumption frequency | Occasionally | 18 (36.73) | 7 (18.42) | 3.59 | 0.17 |
| Rarely | 23 (46.94) | 24 (63.16) | — | — | |
| Frequently | 8 (16.33) | 7 (18.42) | — | — | |
| Alcohol consumption | Occasionally | 19 (38.78) | 2 (5.26) | 19.01 | <0.001* |
| Rarely | 18 (36.73) | 31 (81.58) | — | — | |
| Frequently | 12 (24.49) | 5 (13.16) | — | — | |
| Smoking status | No | 20 (40.82) | 30 (76.92) | 11.54 | <0.001* |
| Yes | 29 (59.18) | 9 (23.08) | — | — | |
| Exercise frequency | Occasionally | 9 (18.37) | 14 (35.90) | 3.95 | 0.14 |
| Rarely | 18 (36.73) | 9 (23.08) | — | — | |
| Frequently | 22 (44.90) | 16 (41.03) | — | — | |
| Age | — | 47.57 ± 16.76 | 51.95 ± 14.14 | −1.30 | 0.20 |
| Height (cm) | — | 157.23 ± 7.61 | 152.64 ± 6.91 | 2.53 | 0.01* |
| Waist circumference (cm) | — | 85.81 ± 12.32 | 74.36 ± 13.30 | 2.30 | 0.03* |
| BMI (kg/m2) | — | 23.89 ± 3.94 | 21.21 ± 3.11 | 2.98 | <0.001* |
| Parameters | Subgroup | Hyperuricemia/Gout group (n = 57) | Non-hyperuricemia/Non-gout group (n = 56) | χ2/t |
|
|---|---|---|---|---|---|
| Gender | Female | 9 (15.79) | 41 (73.21) | 37.76 | <0.001* |
| Male | 48 (84.21) | 15 (26.79) | — | — | |
| Age |
| 47.63 ± 17.69 | 48.88 ± 15.72 | — | — |
| Nitrite | Positive | 10 (17.54) | 12 (21.43) | 0.27 | 0.60 |
| Negative | 47 (82.46) | 44 (78.57) | — | — | |
| Vitamin C | Positive | 4 (7.02) | 5 (8.93) | 0.14 | 0.71 |
| Negative | 53 (92.98) | 51 (91.07) | — | — | |
| Occult blood | Positive | 3 (5.26) | 2 (3.57) | 0.19 | 0.66 |
| Negative | 54 (94.74) | 54 (96.43) | — | — | |
| Protein | Positive | 1 (1.75) | 0 (0.00) | 0.99 | 0.32 |
| Negative | 56 (98.25) | 56 (100.00) | — | — | |
| Bilirubin | Positive | 5 (8.77) | 5 (8.93) | 0.00 | 0.98 |
| Negative | 52 (91.23) | 51 (91.07) | — | — | |
| Urobilinogen | Positive | 11 (19.30) | 11 (19.64) | 0.00 | 0.96 |
| Negative | 46 (80.70) | 45 (80.36) | — | — | |
| White blood cells (WBC) | Positive | 6 (10.53) | 10 (17.86) | 1.25 | 0.26 |
| Negative | 51 (89.47) | 46 (82.14) | — | — | |
| pH | — | 5.99 ± 0.53 | 5.94 ± 0.53 | 0.54 | 0.59 |
| Specific gravity | — | 1.02 ± 0.01 | 1.02 ± 0.01 | −0.68 | 0.50 |
| SNPs | Allele | HWEa | MAF | MAF (1,000 g - CHBS)b | Inferred LD pair | |
|---|---|---|---|---|---|---|
|
| rs16890979 | C/T | 1.000 | 0.013 T | 0.010 T | rs7442295 ( |
| rs7442295 | A/G | 1.000 | 0.013 G | 0.010 G | rs16890979 ( | |
| rs10939650 | C/T/G | 0.704 | 0.279 C | 0.466 C | None | |
| rs2280205 | G/A/C | 0.242 | 0.332 A | 0.197 A | Weak LD with rs7929627 | |
| rs3733591 | C/T | 0.357 | 0.534 C | 0.334 C | Independent SNPs | |
| rs10489070 | C/G | 1.000 | 0.151 G | 0.132 G | None | |
|
| rs7929627 | A/G | 0.347 | 0.396 G | 0.428 G | Weak LD with rs2280205 |
| rs475688 | C/T | 0.401 | 0.315 T | 0.459 T | Low LD (No strong LD candidate) | |
| SNPs | Non-Miao villagers (HC) group | Miao people with gout (MG) group | OR (95% CI) |
| ||
|---|---|---|---|---|---|---|
|
| % |
| % | |||
|
| ||||||
| Allele | C: 13 | 38.2% | 16 | 66.7% | 1.000 (ref.) | - |
| T: 21 | 61.8% | 8 | 33.3% | 0.31 (0.10–0.92) | 0.035* | |
| Codominant model | CC: 3 | 17.6% | 6 | 50.0% | 1.000 (ref.) | - |
| CT: 7 | 41.2% | 4 | 33.3% | 0.29 (0.05–1.61) | 0.16 | |
| TT: 7 | 41.2% | 2 | 16.7% | 0.14 (0.02–1.04) | 0.055 | |
| Dominant model | CC: 3 | 17.6% | 6 | 50.0% | 1.000 (ref.) | - |
| (CT + TT vs. CC) | CT + TT: 14 | 82.4% | 6 | 50.0% | 0.21 (0.04–1.13) | 0.069 |
| Recessive model | CC + CT: 10 | 58.8% | 10 | 83.3% | 1.000 (ref.) | - |
| (TT vs. CC + CT) | TT: 7 | 41.2% | 2 | 16.7% | 0.29 (0.05–1.67) | 0.16 |
|
| ||||||
| Allele | C: 30 | 88.2% | 24 | 100 | 1.000 (ref.) | - |
| T: 4 | 11.8% | 0 | 0% | 0.00 (0.00–NA) | 0.999 | |
| Codominant model | CC: 13 | 76.5% | 12 | 100% | 1.000 (ref.) | - |
| CT: 4 | 23.5% | 0 | 0% | 0.00 (0.00–NA) | 0.999 | |
| TT: 0 | 0% | 0 | 0% | NA | NA | |
| Dominant model | CC: 13 | 76.5% | 12 | 100% | 1.000 (ref.) | - |
| CT + TT: 4 | 23.5% | 0 | 0% | 0.00 (0.00–NA) | 0.999 | |
| Recessive model | CC + CT: 17 | 100% | 12 | 100% | 1.000 (ref.) | - |
| TT: 0 | 0% | 0 | 0% | NA | NA | |
|
| ||||||
| Allele | A: 30 | 88.2% | 24 | 100% | NA | NA |
| G: 4 | 11.8% | 0 | 0% | 0.00 (0.00–NA) | 0.999 | |
| Codominant model | AA: 13 | 76.5% | 12 | 100% | 1.000 (ref.) | - |
| AG: 4 | 23.5% | 0 | 0% | 0.00 (0.00–NA) | 0.999 | |
| GG: 0 | 0% | 0 | 0% | NA | NA | |
| Dominant model | AA: 13 | 76.5% | 12 | 100% | 1.000 (ref.) | - |
| AG + GG: 4 | 23.5% | 0 | 0% | 0.00 (0.00–NA) | 0.999 | |
| Recessive model | AA + AG: 17 | 100% | 12 | 100% | 1.000 (ref.) | - |
| GG: 0 | 0% | 0 | 0% | NA | NA | |
|
| ||||||
| Allele | G: 27 | 79.4% | 16 | 66.6% | 1.000 (ref.) | - |
| A: 7 | 20.6% | 8 | 33.3% | 1.93 (0.61–6.09) | 0.26 | |
| Codominant model | GG: 10 | 58.8% | 6 | 50.0% | 1.000 (ref.) | - |
| GA: 7 | 41.2% | 4 | 33.3% | 0.95 (0.20–4.56) | 0.95 | |
| AA: 0 | 0% | 2 | 16.7% | NA | 0.11 | |
| Dominant model (GA + AA vs. GG) | GG: 10 | 58.8% | 6 | 50.0% | 1.000 (ref.) | - |
| GA + AA: 7 | 41.2% | 6 | 50.0% | 1.43 (0.34–5.97) | 0.62 | |
| Recessive model (AA vs. GG + GA) | GG + GA: 17 | 100% | 10 | 83.3% | 1.000 (ref.) | - |
| AA: 0 | 0% | 2 | 16.7% | NA | 0.11 | |
|
| ||||||
| Allele | C: 15 | 44.1% | 4 | 16.7% | 1.000 (ref.) | - |
| T: 19 | 55.9% | 20 | 83.3% | 3.95 (1.11–14.0) | 0.034* | |
| Codominant model | CC: 4 | 23.5% | 0 | 0% | 1.000 (ref.) | - |
| CT: 7 | 41.2% | 4 | 33.3% |
| 0.055 | |
| TT: 6 | 35.3% | 8 | 66.7% |
| 0.009* | |
| Dominant model | CC: 4 | 23.5% | 0 | 0% | 1.000 (ref.) | - |
| CT + TT: 13 | 76.5% | 12 | 100% |
| 0.013* | |
| Recessive model | CC + CT: 11 | 64.7% | 4 | 33.3% | 1.000 (ref.) | - |
| TT: 6 | 35.3% | 8 | 66.7% | 3.67 (0.84–15.9) | 0.083 | |
|
| ||||||
| Allele | C: 29 | 85.3% | 20 | 83.3% | 1.000 (ref.) | - |
| G: 5 | 14.7% | 4 | 16.7% | 1.16 (0.28–4.77) | 0.84 | |
| Codominant model | CC: 12 | 70.6% | 8 | 66.7% | 1.000 (ref.) | - |
| CG: 5 | 29.4% | 4 | 33.3% | 1.20 (0.25–5.76) | 0.82 | |
| GG: 0 | 0% | 0 | 0% | NA | NA | |
| Dominant model | CC: 12 | 70.6% | 8 | 66.7% | 1.000 (ref.) | - |
| CG + GG: 5 | 29.4% | 4 | 33.3% | 1.20 (0.25–5.76) | 0.82 | |
| Recessive model | CC + CG: 17 | 100% | 12 | 100% | 1.000 (ref.) | - |
| (GG vs. CC + CG) | GG: 0 | 0% | 0 | 0% | NA | NA |
|
| ||||||
| Allele | A: 16 | 47.1% | 11 | 45.8% | 1.000 (ref.) | - |
| G: 18 | 52.9% | 13 | 54.2% | 1.05 (0.38–2.91) | 0.92 | |
| Codominant model | AA: 4 | 23.5% | 3 | 12.5% | 1.000 (ref.) | - |
| AG: 8 | 47.1% | 5 | 20.8% | 0.83 (0.14–4.97) | 0.84 | |
| GG: 5 | 29.4% | 4 | 16.7% | 0.80 (0.12–5.41) | 0.82 | |
| Dominant model | AA: 4 | 23.5% | 3 | 12.5% | 1.000 (ref.) | - |
| (AG + GG vs. AA) | AG + GG: 13 | 76.5% | 9 | 37.5% | 0.92 (0.18–4.76) | 0.92 |
| Recessive model | AA + AG: 12 | 70.6% | 8 | 33.3% | 1.000 (ref.) | - |
| GG: 5 | 29.4% | 4 | 16.7% | 0.60 (0.13–2.83) | 0.52 | |
|
| ||||||
| Allele | C: 22 | 64.7% | 20 | 83.3% | 1.000 (ref.) | - |
| T: 14 | 41.2% | 4 | 16.7% | 0.37 (0.10–1.32) | 0.12 | |
| Codominant model | CC: 7 | 41.2% | 8 | 66.7% | 1.000 (ref.) | - |
| CT: 8 | 47.1% | 4 | 33.3% | 0.44 (0.09–2.11) | 0.30 | |
| TT: 2 | 11.8% | 0 | 0% | 0.00 (0.00–NA) | 0.999 | |
| Dominant model | CC: 7 | 41.2% | 8 | 66.7% | 1.000 (ref.) | - |
| CT + TT: 10 | 58.8% | 4 | 33.3% | 0.35 (0.07–1.67) | 0.19 | |
| Recessive model | CC + CT: 15 | 88.2% | 12 | 100% | 1.000 (ref.) | - |
| TT: 2 | 11.8% | 0 | 0% | 0.00 (0.00–NA) | 0.999 | |
| SNPs | Non-Miao villagers (HC) group | Miao people with hyperuricemia (MH) group | OR (95% CI) | p value | ||
|---|---|---|---|---|---|---|
|
| % |
| % | |||
|
| ||||||
| Allele | C: 13 | 38.2% | 53 | 57.6% | 1.000 (ref.) | - |
| T: 21 | 61.8% | 39 | 42.4% | 0.46 (0.21–1.01) | 0.053 | |
| Codominant model | CC: 3 | 17.6% | 15 | 32.6% | 1.000 (ref.) | - |
| CT: 7 | 41.2% | 23 | 50.0% | 0.66 (0.15–2.83) | 0.57 | |
| TT: 7 | 41.2% | 8 | 17.4% | 0.23 (0.05–1.10) | 0.065 | |
| Dominant model | CC: 3 | 17.6% | 15 | 32.6% | 1.000 (ref.) | - |
| (CT + TT vs. CC) | CT + TT: 14 | 82.4% | 31 | 67.4% | 0.44 (0.11–1.79) | 0.25 |
| Recessive model | CC + CT: 10 | 58.8% | 38 | 82.6% | 1.000 (ref.) | - |
| (TT vs. CC + CT) | TT: 7 | 41.2% | 8 | 17.4% | 0.30 (0.09–1.02) | 0.054 |
|
| ||||||
| Allele | C: 30 | 88.2% | 92 | 100% | 1.000 (ref.) | - |
| T: 4 | 11.8% | 0 | 0% | 0.00 (0.00–NA) | <0.001 | |
| Codominant model | CC: 13 | 76.5% | 46 | 100% | 1.000 (ref.) | - |
| CT: 4 | 23.5% | 0 | 0% | 0.00 (0.00–NA) | 0.003* | |
| TT: 0 | 0% | 0 | 0% | NA | NA | |
| Dominant model | CC: 13 | 76.5% | 46 | 100% | 1.000 (ref.) | - |
| CT + TT: 4 | 23.5% | 0 | 0% | 0.00 (0.00–NA) | 0.003* | |
| Recessive model | CC + CT: 17 | 100% | 46 | 100% | 1.000 (ref.) | - |
| TT: 0 | 0% | 0 | 0% | NA | NA | |
|
| ||||||
| Allele | A: 30 | 88.2% | 92 | 100% | 1.000 (ref.) | - |
| G: 4 | 11.8% | 0 | 0% | 0.00 (0.00–NA) | <0.001* | |
| Codominant model | AA: 13 | 76.5% | 46 | 100% | 1.000 (ref.) | - |
| AG: 4 | 23.5% | 0 | 0% | 0.00 (0.00–NA) | 0.003* | |
| GG: 0 | 0% | 0 | 0% | NA | NA | |
| Dominant model | AA: 13 | 76.5% | 46 | 100% | 1.000 (ref.) | - |
| AG + GG: 4 | 23.5% | 0 | 0% | 0.00 (0.00–NA) | 0.003* | |
| Recessive model | AA + AG: 17 | 100% | 46 | 100% | 1.000 (ref.) | - |
| GG: 0 | 0% | 0 | 0% | NA | NA | |
|
| ||||||
| Allele | G: 27 | 79.4% | 56 | 60.9% | 1.000 (ref.) | - |
| A: 7 | 20.6% | 36 | 39.1% | 2.48 (1.01–6.12) | 0.048 | |
| Codominant model | GG: 10 | 58.8% | 18 | 39.1% | 1.000 (ref.) | - |
| GA: 7 | 41.2% | 20 | 43.5% | 1.59 (0.53–4.74) | 0.41 | |
| AA: 0 | 0% | 8 | 17.4% |
| 0.009* | |
| Dominant model (GA + AA vs. GG) | GG: 10 | 58.8% | 18 | 39.1% | 1.000 (ref.) | - |
| GA + AA: 7 | 41.2% | 28 | 60.9% | 2.22 (0.78–6.33) | 0.14 | |
| Recessive model (AA vs. GG + GA) | GG + GA: 17 | 100% | 38 | 82.6% | 1.000 (ref.) | - |
| AA: 0 | 0% | 8 | 17.4% |
| 0.009* | |
|
| ||||||
| Allele | C: 15 | 44.1% | 22 | 23.9% | 1.000 (ref.) | - |
| T: 19 | 55.9% | 70 | 76.1% | 2.51 (1.13–5.59) | 0.024* | |
| Codominant model | CC: 4 | 23.5% | 3 | 6.5% | 1.000 (ref.) | - |
| CT: 7 | 41.2% | 16 | 34.8% | 3.05 (0.62–15.1) | 0.17 | |
| TT: 6 | 35.3% | 27 | 58.7% | 6.00 (1.23–29.3) | 0.027* | |
| Dominant model | CC: 4 | 23.5% | 3 | 6.5% | 1.000 (ref.) | - |
| CT + TT: 13 | 76.5% | 43 | 93.5% | 4.41 (1.01–19.3) | 0.049 | |
| Recessive model | CC + CT: 11 | 64.7% | 19 | 41.3% | 1.000 (ref.) | - |
| TT: 6 | 35.3% | 27 | 58.7% | 2.61 (0.87–7.81) | 0.086 | |
|
| ||||||
| Allele | C: 29 | 85.3% | 76 | 82.6% | 1.000 (ref.) | - |
| G: 5 | 14.7% | 16 | 17.4% | 1.22 (0.41–3.63) | 0.72 | |
| Codominant model | CC: 12 | 70.6% | 32 | 69.6% | 1.000 (ref.) | - |
| CG: 5 | 29.4% | 12 | 26.1% | 0.90 (0.26–3.09) | 0.87 | |
| GG: 0 | 0% | 2 | 4.3% |
| 0.32 | |
| Dominant model | CC: 12 | 70.6% | 32 | 69.6% | 1.000 (ref.) | - |
| CG + GG: 5 | 29.4% | 14 | 30.4% | 1.05 (0.32–3.46) | 0.94 | |
| Recessive model | CC + CG: 17 | 100% | 44 | 95.7% | 1.000 (ref.) | - |
| (GG vs. CC + CG) | GG: 0 | 0% | 2 | 4.3% |
| 0.32 |
|
| ||||||
| Allele | A: 16 | 47.1% | 58 | 63.0% | 1.000 (ref.) | - |
| G: 18 | 52.9% | 34 | 37% | 0.52 (0.24–1.13) | 0.099 | |
| Codominant model | AA: 4 | 23.5% | 18 | 39.1% | 1.000 (ref.) | - |
| AG: 8 | 47.1% | 22 | 47.8% | 0.61 (0.17–2.23) | 0.45 | |
| GG: 5 | 29.4% | 6 | 13.0% | 0.27 (0.05–1.36) | 0.11 | |
| Dominant model | AA: 4 | 23.5% | 18 | 39.1% | 1.000 (ref.) | - |
| (AG + GG vs. AA) | AG + GG: 13 | 76.5% | 28 | 60.9% | 0.48 (0.14–1.68) | 0.25 |
| Recessive model | AA + AG: 12 | 70.6% | 40 | 87.0% | 1.000 (ref.) | - |
| GG: 5 | 29.4% | 6 | 13.0% | 0.36 (0.10–1.32) | 0.12 | |
|
| ||||||
| Allele | C: 22 | 64.7% | 62 | 67.4% | 1.000 (ref.) | - |
| T: 14 | 41.2% | 30 | 32.6% | 0.89 (0.40–1.97) | 0.77 | |
| Codominant model | CC: 7 | 41.2% | 21 | 45.7% | 1.000 (ref.) | - |
| CT: 8 | 47.1% | 20 | 43.5% | 0.83 (0.26–2.67) | 0.76 | |
| TT: 2 | 11.8% | 5 | 10.9% | 0.83 (0.14–5.06) | 0.85 | |
| Dominant model | CC: 7 | 41.2% | 21 | 45.7% | 1.000 (ref.) | - |
| CT + TT: 10 | 58.8% | 25 | 54.3% | 0.83 (0.28–2.49) | 0.74 | |
| Recessive model | CC + CT: 15 | 88.2% | 41 | 89.1% | 1.000 (ref.) | - |
| TT: 2 | 11.8% | 5 | 10.9% | 0.91 (0.16–5.14) | 0.92 | |
Peer Reviews
No public reviews on file for this paper yet. If you reviewed it on a platform where reviews are public (OpenReview, ICLR, NeurIPS, ICML), you can paste yours below so the community can read it here.
Videos
No videos yet. Explain this paper in a talk, walkthrough, or lecture? Add one.
Taxonomy
TopicsGout, Hyperuricemia, Uric Acid · Thyroid Disorders and Treatments · Diet, Metabolism, and Disease
Introduction
1
Gout, an inflammatory condition triggered by the accumulation of monosodium urate crystal in the joints, predominantly affects middle-aged and elderly individuals (Ahn, 2023). Hyperuricemia, the condition in which there is high concentration of uric acid in blood serum (serum uric acid ≥420 μmol/L), is a major risk factor for gout and is linked to diabetes, kidney disease, and cardiovascular/metabolic disorders (Du et al., 2024). Gout and hyperuricemia prevalence increased with genetic predisposition, unhealthy and poor diets, obesity, and metabolic syndrome (Kim et al., 2024; Zhang et al., 2022a), particularly in rural communities with distinct lifestyles (Dehlin et al., 2020). Generally, gout and hyperuricemia prevalence is unequal, with higher rates in developed countries due to dietary habits, lifestyle factors, poor nutrition (junk food), obesity, and diabetes (Kuo et al., 2015). In China, the burden of gout increases with age (peak at 55–64 years), primarily attributable to prolonged hyperuricemia and frequent comorbidities including hypertension, dyslipidemia, and chronic kidney disease (Xian et al., 2025; Xie et al., 2025). For example, Hypertriglyceridemia strongly linked with gout risk (He et al., 2024; Li et al., 2024a; Chang et al., 2025), while higher body mass index (BMI) exacerbates gout susceptibility in elderly men due to higher alcohol consumption and energy rich diets (Jin et al., 2024). For the Chinese population, two kidney-related genes were reported for influencing the incidence of gout, namely, the Low-Density Lipoprotein-Related Protein 2 (LRP2) and the Catechol-O-Methyltransferase (COMT) (Dong et al., 2015).
The Yunnan Province, home to multi-ethnic populations (Q. Zhang et al., 2021), is located in the southwestern border region of China (He et al., 2022). Statistically, although Yunnan exhibits a high hyperuricemia prevalence (15.8%), its gout prevalence is lower than that observed in Northeast China (24.6%) (Ying et al., 2019). These regional differences are attributed to variation in rural-urban dietary patterns, genetic background, alcohol consumption, and obesity (Huang et al., 2020). For example, traditional plant-based diets in the Southwest China region have been associated with lower rates of hyperuricemia and gout (Liu et al., 2018). The plant-based diets such as whole grains, vegetables, and fruits with low-purine properties play a significant role in lowering the risk of hyperuricemia and gout (Wu et al., 2023b). However, an increasing trend has emerged due to modern lifestyle factors, such as physical inactivity, high meat/seafood consumption, and frequent alcohol intake (Jakše et al., 2019; Zhu et al., 2022). A nationwide epidemiological survey (2015–2017) reported rising prevalence of hyperuricemia (17.7%) and gout (3.2%) compared with earlier national estimates (6.4% overall prevalence, with 7.9% in males and 4.9% in females) (Ji et al., 2025). Alarmingly, high uric acid levels are also becoming more common among Chinese children and adolescents, especially boys (26.6%), older teens (31.7%), and overweight individuals (50.6%) (Song et al., 2022). Overall, gout prevalence in China rises with age and is influenced by sexes, ethnicity, smoking, and metabolic diseases (Ji et al., 2025).
Genetic predispositions play a crucial role in hyperuricemia and gout. Many studies highlight the importance of two renal urate reabsorption transporters, such as GLUT9 and URAT1 (Pavelcova et al., 2020). GLUT9, encoded by SLC2A9, is a glucose transporter expressed in liver and kidney (DeBosch et al., 2014; Torres et al., 2014; Novikov et al., 2019; Chung and Kim, 2021). Variants such as rs16890979 in SLC2A9 gene may impair urate reabsorption, leading to elevated serum uric acid level and promoting joint urate crystal formation (Torres et al., 2014). URAT1, encoded by the SLC22A12 gene on chromosome 11, is an organic anion transporter (OAT) involved in renal urate handling (Stiburkova et al., 2013). Similarly, mutations in the SLC22A12 gene can reduce uric acid excretion and contribute to hyperuricemia and gout (Perdomo-Ramírez et al., 2023). While SLC2A9 and SLC22A12 polymorphisms have been associated with serum uric acid levels in Asian populations, including Chinese, their significance varies by gender and genotype. For instance, the SLC2A9_rs3733591 variant was significantly associated with hyperuricemia only in females (p = 0.003), whereas SLC22A12_rs893006 showed no significant association in an elderly Chinese cohort (p = 0.061) (Liu J. et al., 2020). Despite these findings, the relevance of these genetic variants (SLC2A9 and SLC22A12) to hyperuricemia and gout prevalence has not yet been studied in the Chinese Miao population.
Wuding county, located in north-central Yunnan, is a multi-ethnic region comprising 24 ethnic minority groups, including the Miao, Yi, and Hui peoples. Longyintan Village—a Miao community in Wuding county—exhibits hyperuricemia and gout prevalence. Although previous work reported that the prevalence of hyperuricemia is highest in the Miao people and lowest in the Hui people (Wu et al., 2017), no study has investigated the specific risk factors effecting the Miao population in Yunnan, China. Therefore, this cross-sectional study conducted in Longyintan Village (Yunnan, China) aimed to evaluate demographic, clinical, and genetic factors—including SLC2A9 and SLC22A12 variants—associated with hyperuricemia and gout prevalence among the Miao population.
Materials and methods
2
Subjects and sample collection
2.1
This study employed a household survey approach to investigate the prevalence of hyperuricemia and gout as well as associated with risk factors, among residents of Longyintan villagers. A total of 143 epidemiological questionnaires and 113 blood and urine samples were collected. As a Miao village, the Longyintan is a relatively isolated Miao village with a common pattern of internal marriages. In addition, 34 non-Miao residents from neighboring village were randomly selected as a control for the genetic comparisons, and blood samples were obtained from them. The questionnaire was designed according to the guidelines of the Chinese Society of Rheumatology (Tian et al., 2021).
Researchers, together with physicians from the Yunnan First People’s Hospital, Chuxiong Prefecture People’s Hospital and Maojie Town Health Center, conducted the questionnaire survey and collected biological samples. For each participant, demographic characteristics (including age, educational background), medical history (including family history of hyperuricemia/gout), and dietary habits were recorded. Besides, two tubes of approximately 3 mL of residual peripheral blood were collected from each participant, including both Miao residents of Longyintan and non-Miao individuals from neighboring villages, for biochemical analysis and genotyping. This study adhered to the principles of the declaration of Helsinki. Ethical approval was granted by the Ethics Committee of Yunnan First People’s Hospital and written informed consent was obtained from all participants.
Diagnostic criteria
2.2
According to the 2023 Multidisciplinary Expert Consensus on the Diagnosis and Treatment of Hyperuricemia Related Diseases in China, hyperuricemia is defined as a serum uric acid >420 μmol/L in both men and women (Li et al., 2024b). Gout was diagnosed based on the 2015 European Alliance of Associations for Rheumatology (EULAR)/American College of Rheumatology (ACR) classification criteria (Neogi et al., 2015).
Measurement of biochemical profiles
2.3
Following previously established protocols (Fischbach et al., 2021; Vargas-Morales et al., 2021), blood samples were analyzed for white blood cells (WBC), Red Blood Cell (RBC), Hemoglobin (Hb), Platelet Count (PLT), renal function (creatinine, and uric acid), and metabolic parameters including glucose, Total Cholesterol (TC), Triglycerides (TG), High-Density Lipoprotein Cholesterol (HDL-C), and Low-Density Lipoprotein Cholesterol (LDL-C). Urine samples underwent standardized urinalysis including pH, Specific gravity SG, nitrites, vitamin C, occult blood, bilirubin, urobilinogen, and leukocytes. All laboratory tests were performed at the Yunnan First People’s Hospital, under routine internal quality control procedures.
Genotyping of polymorphisms
2.4
Genomic DNA was extracted from EDTA-anticoagulated whole blood using a commercial kit according to the manufacturer’s instructions. Eight SNPs were analyzed: SLC2A9 (rs16890979, rs10489070, rs2280205, rs3733591, rs10939650, and rs7442295) and SLC22A12 (rs475688 and rs7929627). Genotyping was performed using the SNaPshot Multiplex Kit (Thermo Fisher Scientific) with primers designed using Primer3Plus (Varliero et al., 2021) (Table 1). PCR amplification was performed with initial denaturation at 95 °C for 2 min, followed by 11 cycles of 94 °C for 20 s, 65 °C for 40 s (decreasing by 0.5 °C per cycle), and 72 °C for 1.5 min, followed by 24 cycles of 94 °C for 20 s, 59 °C for 40 s and 72 °C for 1.5 min, and a final extension at 72 °C for 2 min. PCR products were purified with Exonuclease I/Shrimp Alkaline Phosphatase (ExoI/SAP; Thermo Fisher). SNaPshot extension and SAP cleanup (Promega) were performed before capillary electrophoresis using an ABI sequencer. Genotypes were analyzed with GeneMapper Software v6.5 (Liang et al., 2025).
Statistical analysis
2.5
Statistical analysis was carried out using SPSS 26.0 (IBM Corp., Armonk, NY, United States) (Chen-Xu et al., 2019). Continuous variables were assessed for normality using the Shapiro-Wilk test. Normally distributed data (age, BMI, and uric acid) were presented as mean ± standard deviation (SD), whereas non-normally distributed data (e.g., WBC and creatinine) were summarized as median (interquartile range). Categorical variables were expressed as frequencies and percentages. Group comparisons between gout/hyperuricemia and non-gout/non-hyperuricemia groups were performed using independent t-tests for normally distributed variables and Mann-Whitney U tests (reported with Z-values) for skewed data. Chi-square or Fisher’s exact tests were used for categorical variables such as lifestyle factors, and dietary factors).
For genetic associations testing, multivariable logistic regression was performed to estimate unadjusted odds ratios (ORs) and 95% confidence intervals (CIs) under codominant, dominant, and recessive models. Covariates included age, sex, BMI, and ancestry principal components minimize the population stratification bias (Yang et al., 2014; Tseng et al., 2024). To account for multiple testing in genetic analyses, Bonferroni correction was applied for multiple comparisons (significance threshold = 0.05/number of SNPs) (Fan et al., 2024). Statistical significance was defined as p < 0.05 (two-tailed), with p < 0.01 considered highly significant (indicated by asterisks in tables). Hardy-Weinberg equilibrium (HWE) was tested for all SNPs to ensure genotyping quality (Yan et al., 2018; Cho et al., 2024). Linkage disequilibrium (LD) analysis was conducted using Haploview v4.2. Pairwise LD was calculated using the r ^2^ metric, and LD blocks were defined according to the Gabriel algorithm (Gabriel et al., 2002) with default confidence interval settings. SNPs with a minor allele frequency ≥0.05 and genotype call rate ≥95% were included, using the study population as the reference (Dong et al., 2015; Barrett et al., 2005). Besides, LD between SNPs was assessed using R ^2^ values (Chen et al., 2022).
Results
3
Demographic and clinical characteristics of participants
3.1
Although 143 villagers from the Longyintan Village (Total population: 224) participated in the initial screening, only 88 participants had complete questionnaires and biochemical information and were therefore included in the epidemiological analysis. Among them 39 participants were classified into non-hyperuricemia/non-gout group, and 49 into hyperuricemia/gout group (36 hyperuricemia, 13 gouts).
Significant demographic and clinical differences between two groups were observed (Table 2). Hyperuricemia and gout were substantially more common in men (83.7% vs. 28.2%) and were associated with a higher prevalence of pre-existing medical conditions (39.6% vs. 10.3%), %), non-traumatic joint pain (28.6% vs. 5.1%), and visible urate crystal deposits called tophi (10.6% vs. 0%). Lifestyle factors differed as well: frequent alcohol consumption (24.5% vs. 13.2%) and smoking (59.2% vs. 23.1%) were notably more common among affected individuals.
Anthropometric measurements also varied significantly. The hyperuricemia/gout group had higher body weights (59.2 vs. 49.4 kg), larger waist circumference (85.8 vs. 74.4 cm), and elevated BMI (23.9 vs. 21.2 kg/m^2^). Height was marginally greater in the affected group (157.23 vs. 152.64 cm, p = 0.01). In contrast, no significant group differences were detected in age education level, family history of hyperuricemia and gout, dietary habits, physical activity, sleep patterns, or mobile network usage (Supplementary Table S1). Notably, dietary intakes such as meats, grains, fruits, soup and consumption of processed foods did not differ meaningfully between the groups. Suggesting food choices may be less influential than other factors in this population.
Biochemical indicators in non-hyperuricemia/non-gout and hyperuricemia/gout groups
3.2
A total of 113 villagers underwent serum biochemistry testing and urinalysis, comprising 56 non-gout/non-hyperuricemia group and 57 gout/hyperuricemia group (hyperuricemia prevalence = 50.44%). As shown in Figure 1 and Supplementary Table S2, several biochemical indices (such as red blood cell (RBC) count, hemoglobin, platelet count, alanine aminotransferase (ALT), total bilirubin, creatinine, uric acid, and triglycerides) differed significantly between groups (p < 0.05). Renal function markers showed clearest separation: serum uric acid levels were 56% higher in the hyperuricemia/gout group (553.13 vs. 354.73 μmol/L, p < 0.001), and serum creatinine levels were 37% elevated (84.66 vs. 61.80 μmol/L, p < 0.001), indicating reduced kidney filtration efficiency.
Serum Biochemistry analysis. Comparison between Non-Hyperuricemia/Non-Gout and Hyperuricemia/Gout group. Data are presented as Mean ± SD. Error bars represent standard deviation (SD). “ns” indicates statistically non-significant and “” indicates statistically significant difference (*, p < 0.05; **, p < 0.01; **, p < 0.00).
Hematological parameters also differed. Affected individuals had higher RBC counts (5.08 vs. 4.81 ×10^9^/L, p = 0.01) and hemoglobin (162.77 vs. 147.50 g/L, p < 0.001), suggesting potential compensatory erythropoiesis or dehydration. Alongside a 17% reduction in platelet count (161.09 vs. 194.14 ×10^9^/L, p < 0.001), a finding that may reflect inflammatory consumption or altered marrow activity. Elevated ALT 47% higher in gout patients (28.22 vs. 19.15 U/L, p = 0.04) suggested mild hepatic stress. Metabolic differences included higher triglyceride levels (3.35 vs. 1.80 mmol/L, p < 0.001), whereas HDL-C was lower but not statistically significant (1.35 vs. 1.52 mmol/L, p = 0.06) (Figure 1). White blood cell (WBC) count, total cholesterol, Low-Density Lipoprotein Cholesterol (LDL-C), glucose, and most urinary indicators did not differ significantly. Total bilirubin was unexpectedly lower in the hyperuricemia/gout group (10.50 vs. 13.85 mmol/L, p = 0.04), warranting further investigation (Table 3).
Urinalysis comparisons
3.3
Urinalysis parameters (nitrites, vitamin C, occult blood, protein, urobilinogen, WBC, pH, and specific gravity) showed no statistically significant differences between groups, apart from the expected gender imbalance. These findings suggest that urinary abnormalities were not prominent features distinguishing hyperuricemia/gout from unaffected participants in this population. But the total bilirubin was paradoxically lower in hyperuricemia/gout group (10.50 vs. 13.85 mmol/L, p = 0.04), warranting further investigation (Table 3).
Hardy–Weinberg equilibrium test
3.4
Eight SNPs in SLC2A9 (rs3733591, rs16890979, rs7442295, rs2280205, rs10939650, and rs10489070) and SLC22A12 (rs475688 and rs7929627) were analyzed. All SNPs confirmed to Hardy–Weinberg equilibrium (p > 0.05; Table 4), supporting reliable genotyping quality and indicating no major deviations due to population structure or selection. Minor allele frequencies were consistent with reference data from the 1,000 Genomes Han Chinese population.
Linkage disequilibrium (LD) patterns
3.5
Pairwise LD analysis revealed complete LD between SLC2A9 rs16890979 and rs7442295 (r ^ 2 ^ = 1.00), consistent with their identical minor-allele frequencies (MAF = 0.013) and HWE equilibrium (p = 1.00), reveled they are from the same haplotype block (Figure 2A). Other SLC2A9 SNPs pairs showed weak to moderate LD (all r ^ 2 ^ < 0.8). Within SLC22A12, rs7929627 displayed weak LD with SLC2A9 rs2280205 (Figure 2B), whereas other cross-gene comparisons showed little evidence of LD. No strong LD was observed for rs10489070 or for most remaining SNP pairs (Figure 2; Table 4).
*Pairwise linkage disequilibrium (LD) heatmaps. (A) SLC2A9: rs16890979 and rs7442295 are in complete LD (r
2 = 1.00), forming a single haplotype block while other SNPs pairs show weak to moderate LD. (B) SLC22A12: overall weak LD was observed among the analyzed SNPs, including rs7929627. Values shown in the diamonds represent r
2 × 100.*
To ensure the quality and reliability of our genotyping results, we evaluated all analyzed SNPs in SLC2A9 and SLC22A12 for Hardy-Weinberg Equilibrium (HWE). As shown in Table 4, HWE test confirmed that the observed genotype frequencies for all SNPs, including the gout-associated rs3733591 (p. Arg294His) and rs16890979 (p. Val282Ile) variants in SLC2A9 as well as the neutral rs475688 in SLC22A12, matched expected frequencies under random mating (all p > 0.05). This adherence to HWE indicates our genotyping data were technically robust, free from significant population stratification, and unaffected by selection bias. These results provide confidence that the allele frequency differences we detected between gout and non-gout hyperuricemia groups reflect true biological associations rather than technical or population genetic artifacts.
Associations between gene polymorphisms and hyperuricemia/gout
3.6
This study examined the associations between genetic variants in the SLC2A9 and SLC22A12, and the risk of hyperuricemia and gout within a Miao population of Longyintan Village. In the first comparison, we analyzed genetic differences between the non-gout/non-hyperuricemia group (MC) and the gout/hyperuricemia group (MGH) within the Miao villagers themselves. No significant difference was observed for the genotype frequencies for any of the eight SNPs studied (Supplementary Table S3). Given the relative isolation of the Longyintan community and the high prevalence of hyperuricemia and gout, we hypothesized a potential genetic predisposition in this population.
To further explore the genetic susceptibility, comparisons were then made between Miao population with gout (MG) and with hyperuricemia (MH) and non-Miao healthy controls (HC) from neighboring villages. These analyses revealed that several SLC2A9 variants differed significantly between groups, whereas SLC22A12 variants showed no significant differences.
Genetic associations with gout: MG vs. HC
3.6.1
Table 5 shows that the T allele of SLC2A9_rs3733591 was significantly less frequent in the MG compared with HC (61.8% vs. 33.3%, OR = 0.31, 95% CI: 0.10–0.92, p = 0.035). In contrast, the T allele of SLC2A9_rs10939650 was more frequent (3.95 times higher risk of gout) in MG than HC (83.3% vs. 55.9%, OR = 3.95, 95% CI: 1.11–14.0, p = 0.034). Genotype analysis under the codominant model further supported this finding: individuals with TT genotype of rs10939650 had markedly increased gout risk compared to the CC genotype (p = 0.009).
Two additional SLC2A9 variants (rs3733591 and rs10939650) showed nominal associations consistent with these allele-level findings. We suggested that the T allele may have a protective effect against progressing from high uric acid to clinical gout for Miao people. Interestingly, the T allele for rs16890979 and G allele for rs7442295 were completely absent in MG group but were observed in HC group.
Genetic associations with hyperuricemia: MH vs. HC
3.6.2
Hyperuricemia was highly prevalent in the Miao population (>50% among the 114 participants tested, Supplementary Table S2). We therefore compared MH with HC to identify variants associated with elevated uric acid levels (Table 6). Significant differences were found for SLC2A9 rs16890979, rs7442295, rs2280205 and rs10939650 between HC and MH groups, while the remaining SNPs showed no meaningful differences. For rs2280205 (SLC2A9), the A allele was associated with a significantly higher risk (2.48 times higher) of hyperuricemia (OR = 2.48, 95% CI: 1.01–6.12, p = 0.048) The association was strongest for the AA genotype under the Recessive Model (p = 0.009). Similarly, the T allele of rs10939650 (OR = 2.51, 95% CI: 1.13–5.59, p = 0.024) was significantly common in the MH compared with HC (76.1% vs. 55.9%; OR = 2.51, 95% CI: 1.13–5.59, p = 0.024). Dominant model analysis was consistent with these results (93.5% vs. 76.5%, OR = 4.41, 95% CI: 1.01–19.3, p = 0.049), indicating that both TT and CT genotypes elevate hyperuricemia risk in the Longyintan Village.
As in the gout comparison, the T allele of rs16890979 and G allele of rs7442295 were completely absent in MH group. Overall, results indicate that several SLC2A9 variants, particularly rs10939650 and rs2280205, may contribute to susceptibility to hyperuricemia and gout in this genetically isolated Miao population. These associations should be interpreted cautiously interpreted cautiously; due to sample size limitations but highlight potential genetic differences between the Miao villagers and neighboring non-Miao groups. Validation in larger, independent cohorts is needed.
Discussion
4
This cross-sectional study examined lifestyle, biochemical, and genetic factors associated with hyperuricemia and gout prevalence in Longyintan Village, a relatively isolated Miao community in Yunnan Province, China. By comparing individuals with and without hyperuricemia/gout, and further contrasting Miao participants with non-Miao villagers, we sought to clarify both environmental and inherited contributors to disease susceptibility. Eight widely studied SNPs SLC2A9 and SLC22A12, two key urate transport genes, were evaluated for their potential role in this population.
Consistent with previous work, our results showed a marked sex difference. The prevalence of hyperuricemia and gout was substantially higher in men than women (83.67% in males vs. 28.21% in females, p < 0.001). This aligns with earlier observations that men are more prone to hyperuricemia due to lower renal urate clearance and the protective influence of estrogen in women (Eun et al., 2021; Jaiprabhu et al., 2025; Lee et al., 2024; van Veen and Haeri, 2015). With the advancement of social and economic conditions, the number of obese people is increasing rapidly. Many studies found that obesity was an important risk factor for hyperuricemia and gout (Cao et al., 2017; Evans et al., 2018; Zhang et al., 2025). Obesity-related measures, including body weight (59.20 vs. 49.43 kg, p < 0.001), waist circumference (85.81 vs. 74.36 cm, p = 0.03), and BMI (23.89 vs. 21.21 kg/m^2^, p < 0.001) were significantly higher among affected individuals, further supporting evidence that adiposity promotes elevated uric acid levels through insulin resistance and impaired renal urate elimination (Cao et al., 2017; Dong et al., 2020; Evans et al., 2018; Zhang et al., 2025).
In contrast to expectations and previous reports that low-purine diets (fruits, eggs, legumes, dairy products, and whole grains) may reduce serum uric acid levels key factors in gout management (Aihemaitijiang et al., 2020; Zhang et al., 2022b; Chen et al., 2024). Our analysis found no significant dietary differences (e.g., meats and seafood, all p > 0.05) between the hyperuricemia/gout and non-hyperuricemia/non-gout groups of Miao people from the Longyintan Village. Lifestyle behaviors, however, showed clear associations: smoking (59.18% vs. 23.08%, p < 0.001) and frequent alcohol consumption (24.49% vs. 13.16%, p < 0.001) were substantially more common among individuals with hyperuricemia/gout, consistent with the established role of these exposures in increasing urate production and impairing renal excretion (Neogi et al., 2014; Yang et al., 2017).
The biochemical results further emphasized the metabolic burden (association of hyperuricemia and gout to renal impairment) on an affected individual. Elevated serum triglyceride (3.35 ± 2.35 mmol/L vs. 1.80 mmol/L, p < 0.001) and lower HDL-C (1.35 vs. 1.52 mmol/L, p = 0.06) reflect dyslipidemia commonly observed in hyperuricemia, reinforcing the link between urate metabolism and metabolic syndrome and can be a potential marker to predict the gout at an early stage (Lu et al., 2020; Luo et al., 2022; Xian et al., 2025). Hematological differences, including elevated RBC count (5.08 vs. 4.81 ×10^9^/L, p = 0.01) and hemoglobin (162.77 vs. 147.50 g/L, p < 0.001) alongside reduced platelets (161.09 vs. 194.14 ×10^9^/L, p < 0.001), may reflect chronic low-grade inflammation or metabolic alterations associated with hyperuricemia and gout (Yang et al., 2022). Elevated ALT (28.22 vs. 19.15 U/L, p = 0.04) and AST (39.63 vs. 28.42 U/L, p = 0.06) also suggest hepatic stress, in line with prior studies linking urate dysregulation to liver dysfunction (Thottam et al., 2017; Li et al., 2024a). Our observation of elevated liver enzymes is consistent with other studies reporting systemic metabolic involvement in gout and hyperuricemia. Although several biochemical parameters showed statistically significant differences between groups, the magnitude of some effects was modest. Therefore, these findings should be interpreted cautiously, as statistical significance does not always equate to clinical relevance, and validation in larger, multi-center cohorts is warranted.
Genetic analyses highlighted notable patterns in SLC2A9. Strong LD was observed between rs16890979 and rs7442295 (r ^2^ = 1.0) (Figure 2) because of identical minor allele frequencies (MAF = 0.013) and HWE equilibrium (p = 1.00), consistent with previous findings in Chinese and other East Asian populations (Yang et al., 2014; Merriman, 2015; Yang et al., 2018). Although rs3733591 showed only moderate LD, it its T allele demonstrated a protective association against gout in the Miao ethnic group (OR = 0.31, p = 0.035, Table 5). This contrasts with its association with hyperuricemia in Han Chinese (Lin et al., 2024), suggesting ancestry-dependent allele effects, as reported in multiethnic studies (Tu et al., 2010). The complete absence of rs16890979-T and rs7442295-G minor alleles in Miao gout cases (p < 0.001, Table 6), may reflect a protective founder effect or selection pressures unique to this isolated population; these patterns differ substantially from European cohorts, where these variants showed weaker or inconsistent associations (Köttgen et al., 2013). The rs10939650-T allele (SLC2A9) exhibited a strong risk effect for both gout (OR = 3.95, p = 0.034, Table 5), and hyperuricemia (OR = 2.51, p = 0.024). This trend corresponds with prior evidence suggesting reduced GLUT9 transporter activity associated with this allele (Wu et al., 2024). Together, these findings indicate a prominent role for SLC2A9 in urate handling across populations, although the strength and direction of associations may vary by ancestry vary significantly across ancestries (Flynn et al., 2013; Misawa et al., 2020) and it showed the ethnic-specific genetic architecture of SLC2A9 gene.
In contrast, SLC22A12 polymorphisms (e.g., rs10489070, rs475688, and rs7929627) did not show significant associations in this study (p > 0.05, Tables 5 and 6), consistent with some reports in Chinese and multiethnic cohorts (Shima et al., 2006; Matsuo et al., 2016; Sandoval-Plata et al., 2021). Although rs475688 has been associated with gout in Japanese and in European and Japanese studies (Shima et al., 2006; Matsuo et al., 2016; Sandoval-Plata et al., 2021; Toyoda et al., 2021), our results align with evidence that SLC22A12 variants like rs121907892 effects are highly population-specific and may be weaker or absent in certain ethnic groups, including the Miao (Flynn et al., 2013; Misawa et al., 2020; Ruiz et al., 2018). The protective effect of rs3733591-T in the Miao group, together with the increased risk associated with the rs10939650-T alleles, further supports the central involvement of SLC2A9 in urate transport dysregulation (Liu et al., 2022; Wu et al., 2023a; Wu et al., 2024). These variants, combined with lifestyle and metabolic factors, may contribute to the elevated hyperuricemia and gout burden observed in the Longyintan populations, as reflected in the stratified analyses (Table 6). In contrast, the neutrality of SLC22A12 SNPs in our cohort reinforces the gene’s ancestry-dependent penetrance, necessitating caution in trans-ethnic genetic risk modeling (Flynn et al., 2013; Misawa et al., 2020). Although rs10939650 and rs3733591 showed a nominal association (uncorrected p = 0.034 and p = 0.035, respectively), rs10939650 did not reach the Bonferroni-adjusted threshold (p < 0.00625). This indicates that the observed associations should be interpreted as preliminary and require validation in larger cohorts. Besides, our results suggest these alleles may be strongly protective against developing high uric acid levels in this population. The odds ratio (OR) of 0.00 and highly significant p-values (<0.001, 0.003) indicate a perfect or near-perfect negative association. The fact that these alleles are present in controls but absent in cases is a very striking finding. Based on these findings there is a need for replication of larger cohorts.
In this study, small sample sizes, particularly for rare variants such as rs2280205-A, limit the statistical power to detect modest genetic effects and hinder the meaningful functional interpretation of these SNPs. The absence of significance after Bonferroni correction further indicates that these findings should be considered preliminary. Several SLC2A9 variants (rs10939650, rs2280205, and rs3733591) showed suggestive associations with hyperuricemia and gout in the isolated Miao population, whereas SLC22A12 variants showed no significant effects. Larger, well-powered studies are needed to validate these associations and to explore interactions between SLC2A9 variants, dietary factors and comorbidities in the wider Yunnan population. These results emphasize the role of population-specific genetic architecture in urate-related disorders and the need for future studies incorporating larger cohorts and functional analyses to clarify gene–environment interactions involved in urate metabolism.
The reference list from the paper itself. Each links out to its DOI / PubMed record.
- 1Ahn J. K. (2023). Epidemiology and treatment-related concerns of gout and hyperuricemia in Korean. J. Rheumatic Dis. 30 (2), 88–98. 10.4078/jrd.2022.0001 37483480 PMC 10324937 · doi ↗ · pubmed ↗
- 2Aihemaitijiang S. Zhang Y. Zhang L. Yang J. Ye C. Halimulati M. (2020). The association between purine-rich food intake and hyperuricemia: a cross-sectional study in Chinese adult residents. Nutrients 12 (12), 3835. 10.3390/nu 12123835 33334038 PMC 7765492 · doi ↗ · pubmed ↗
- 3Barrett J. C. Fry B. Maller J. Daly M. J. (2005). Haploview: analysis and visualization of LD and haplotype maps. Bioinformatics 21 (2), 263–265. 10.1093/bioinformatics/bth 457 15297300 · doi ↗ · pubmed ↗
- 4Cao J. Wang C. Zhang G. Ji X. Liu Y. Sun X. (2017). Incidence and simple prediction model of hyperuricemia for urban han Chinese adults: a prospective cohort study. Int. J. Environ. Res. Public Health 14 (1). Article 1. 10.3390/ijerph 14010067 28085072 PMC 5295318 · doi ↗ · pubmed ↗
- 5Chang Y. Park J. Song T.-J. (2025). Association between the triglyceride/high-density lipoprotein (TG/HDL) ratio and incidence of gout: a nationwide cohort study. Front. Endocrinol. 15, 1453458. 10.3389/fendo.2024.1453458 39866735 PMC 11757121 · doi ↗ · pubmed ↗
- 6Chen D. Xu H. Sun L. Li Y. Wang T. Li Y. (2022). Assessing causality between osteoarthritis with urate levels and gout: a bidirectional Mendelian randomization study. Osteoarthr. Cartil. 30 (4), 551–558. 10.1016/j.joca.2021.12.001 34896305 · doi ↗ · pubmed ↗
- 7Chen Z. Xue X. Ma L. Zhou S. Li K. Wang C. (2024). Effect of low-purine diet on the serum uric acid of gout patients in different clinical subtypes: a prospective cohort study. Eur. J. Med. Res. 29 (1), 449. 10.1186/s 40001-024-02012-1 39223686 PMC 11370010 · doi ↗ · pubmed ↗
- 8Chen-Xu M. Yokose C. Rai S. K. Pillinger M. H. Choi H. K. (2019). Contemporary prevalence of gout and hyperuricemia in the United States and decadal trends: the national health and nutrition examination survey, 2007–2016. Arthritis & Rheumatology 71 (6), 991–999. 10.1002/art.40807 30618180 PMC 6536335 · doi ↗ · pubmed ↗