Assessment of childhood undernutrition in India using National Family Health Surveys: Severity of anthropometric failure and contributing factors
Ramendra Nath Kundu, Md. Golam Hossain, Susmita Bharati, Ummay Ayesha, Shahara Sultana Shanta, Premananda Bharati

TL;DR
This study examines undernutrition in Indian children under five using health surveys and finds rural areas and certain vulnerable groups are most affected.
Contribution
The study introduces a composite index to assess anthropometric failure severity and identifies key contributing factors in India.
Findings
Undernutrition rates are higher in rural areas compared to urban areas in India.
Low birth weight and poor wealth index are significant contributors to anthropometric failure.
Children from scheduled castes and tribes in rural areas face higher undernutrition risks.
Abstract
Childhood undernutrition has a negative impact on healthy adulthood. Though progress is being made, a considerable number of children are still undernourished in India. The purpose of this study is to evaluate the prevalence of the severity of anthropometric failure (SAF) and its associated factors in India. This study was carried out with a cross-sectional design at the household level. The data we utilized were secondary in nature and collected from all five phases of the National Family Health Surveys from 1992 to 2021. This study comprised 581124 under-five children in India. The severity of anthropometric failure (SAF) was assessed using the composite index of anthropometric failure (CIAF). Children can experience SAF in four ways, categorized as no anthropometric failure (AF), single AF, double AF, or triple AF. Over the past three decades, the prevalence of AF among under-five…
Genes, proteins, chemicals, diseases, species, mutations and cell lines named across the full text — each resolved to its canonical identifier and authoritative record.
Click any figure to enlarge with its caption.
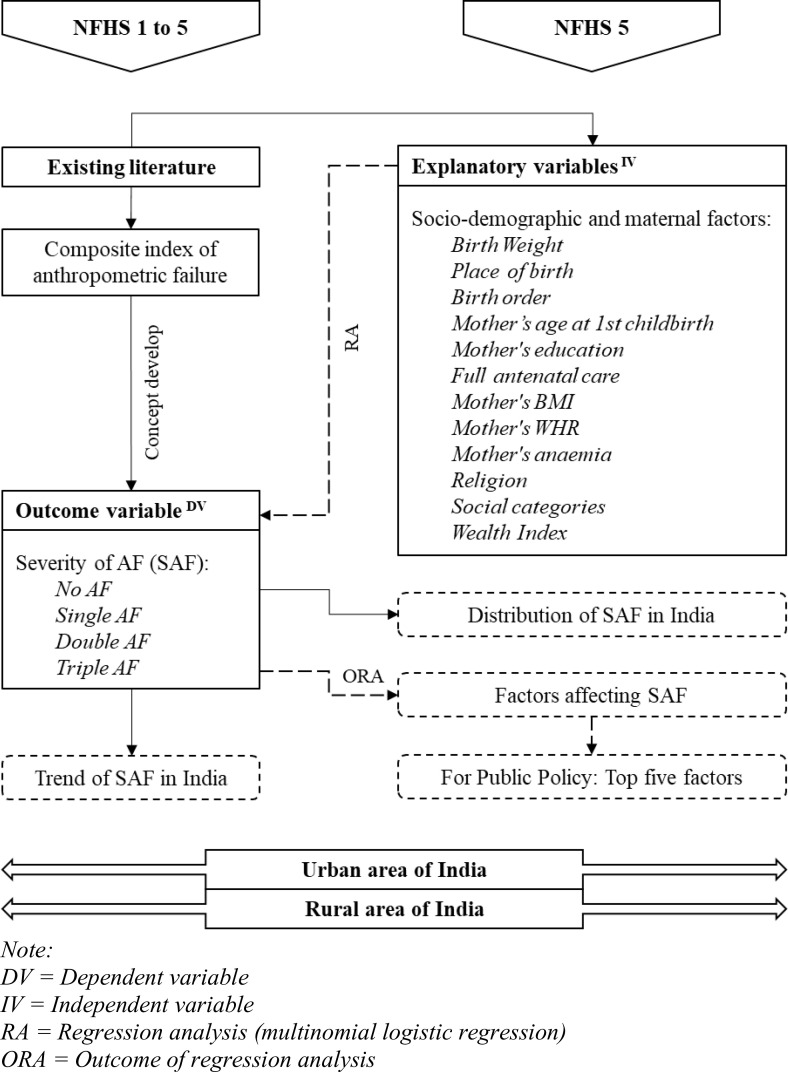 Fig 1
Fig 1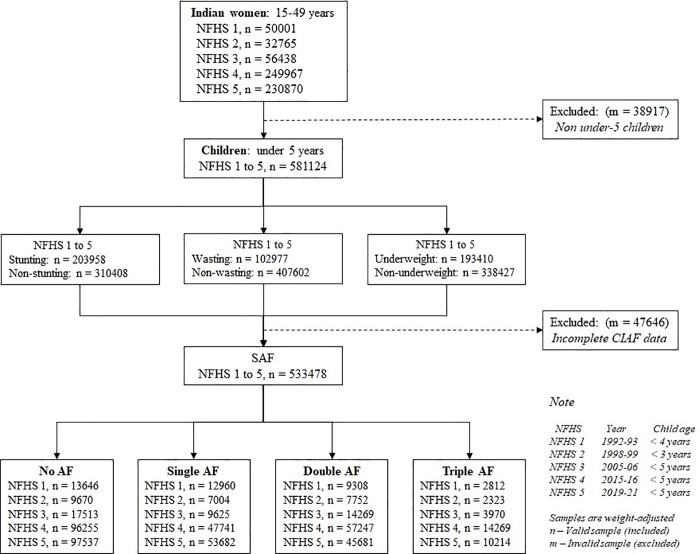 Fig 2
Fig 2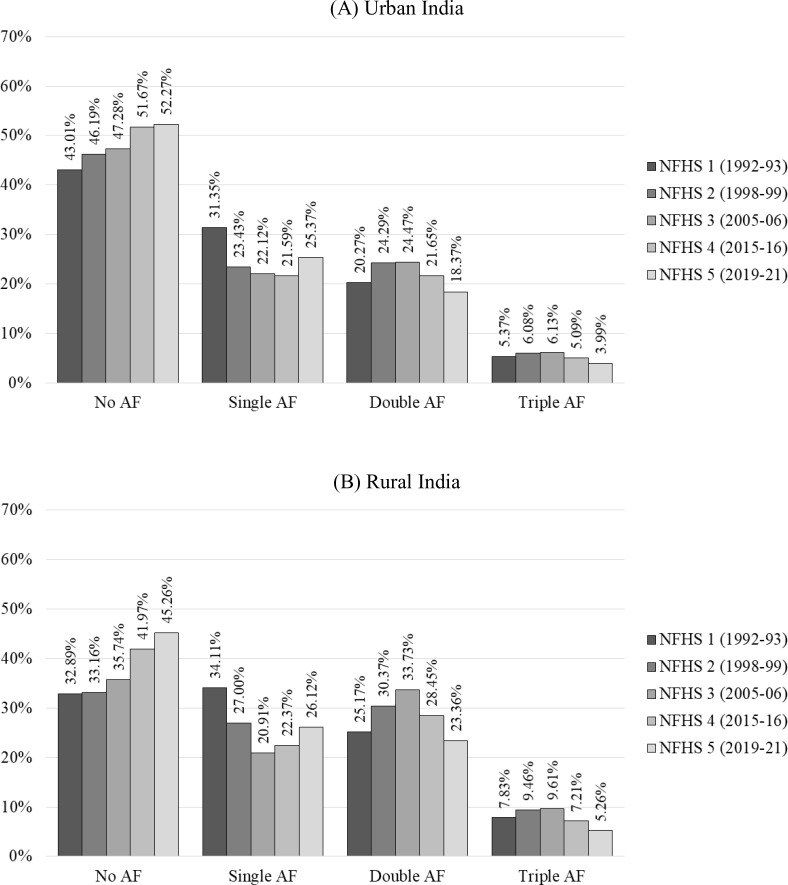 Fig 3
Fig 3Peer Reviews
No public reviews on file for this paper yet. If you reviewed it on a platform where reviews are public (OpenReview, ICLR, NeurIPS, ICML), you can paste yours below so the community can read it here.
Videos
No videos yet. Explain this paper in a talk, walkthrough, or lecture? Add one.
Taxonomy
TopicsChild Nutrition and Water Access · Child Nutrition and Feeding Issues · Nutrition and Health in Aging
Introduction
Deficiencies at an early age are not irreversible, especially in under-five children. Childhood undernutrition is a problem that can lead to various health problems throughout life. Proper nutrition in early childhood is critical for organ development and function, a strong immune system, and neurological and cognitive improvement [1]. UNICEF, WHO, and World Bank Group estimated that in 2022, there were 148.1 million stunted (low height-for-age) and 45 million wasted (low weight-for-height) children worldwide [2]. The WHO reported that stunting had decreased worldwide in 2021, except for Africa. Asia is home to more than three-quarters of children affected by severe wasting and more than half (25 million) of all children who suffer from wasting live in the southern part of Asia [3].
According to the WHO, in 2021, undernutrition is responsible for 45 percent of deaths among under-five children, predominantly in low- and middle-income countries (LMICs) [4]. At the same time, undernutrition is identified by UNICEF (2020) as the prime cause of over half of all fatalities in under-five children [5]. Child undernutrition has numerous underlying causes. Previous studies in several nations have identified multiple factors contributing to undernutrition, including inadequate supplemental nutrition, poor socioeconomic characteristics, poverty, co-morbidities, and food insecurity [6–8]. These factors are linked to the nation’s economic and healthcare systems, which change over time and have an impact on the prevalence of child undernutrition [9–11].
Anthropometry helps to determine childhood undernutrition [12,13]. The three most common anthropometric indicators for undernutrition in children are low height-for-age or stunting, weight-for-height or wasting, and weight-for-age or underweight [14,15]. A child may exhibit various forms of undernutrition at once, such as stunting and underweight or wasting and underweight [16]. All three forms can be observed together in the same child occasionally. The Composite Index of Anthropometric Failure (CIAF) provides a comprehensive framework for understanding childhood undernutrition by integrating all these undernutritional indicators into seven distinct subgroups [6,7]. This concept was initially introduced by Svedberg in 2000, focusing on children who may exhibit signs of stunting, wasting, or underweight—critical indicators of anthropometric failure [6,16]. This initial CIAF model comprised six subgroups, labelled A through F [16]. In 2005, Nandi et al. expanded this model by utilizing data from India [17]. This adaptation included the introduction of an additional subgroup, labelled Y, enabling researchers and policymakers to assess childhood undernutrition more effectively [6–8,17].
Previous research indicates that factors such as limited wealth, lower social status, insufficient maternal education, and maternal undernutrition can contribute to issues like childhood stunting, wasting, and underweight [13,14,18]. In this regard, we can more effectively identify the key determinants by evaluating the overall magnitude of AF, rather than considering the CIAF subgroups separately. This approach will enable LMICs to develop more cost-effective strategies for addressing childhood undernutrition and achieving the Sustainable Development Goals (SDGs). The magnitude and vulnerability of childhood undernutrition are the foundation of the current investigation because of this. The objective of this study is to assess the prevalence and severity of anthropometric failure (SAF), identify socio-demographic and maternal characteristics in both urban and rural settings, and examine its trends over the past three decades.
Methods
Conceptual framework
The study’s purpose is to investigate the severity of anthropogenic failure (SAF) in urban and rural India from both prospective and cross-sectional perspectives (Fig 1). The concept of SAF was developed based on the existing concept of CIAF from the literature. The study analyzes the trends in SAF based on data from the National Family Health Survey (NFHS) spanning between 1992−93 (NFHS 1) and 2019−21 (NFHS 5) to understand the changes in SAF over time. The latest distribution of SAF in India is established based on NFHS 5 data. NFHS-5 fieldwork for India was conducted in two phases— Phase-I from 17 June 2019–30 January 2020 covering 17 states and 5 UTs and Phase-II from 2 January 2020–30 April 2021 covering 11 states and 3 UTs. The study also identifies the socio-demographic and maternal factors influencing SAF based on recent data.
Conceptual framework of the study.
Data source
The unit-level data used in this study were collected from five phases of the NFHS, which include NFHS 1 (1992−93), NFHS 2 (1998−99), NFHS 3 (2005−06), NFHS 4 (2015−16), and NFHS 5 (2019−21). This cross-sectional survey was conducted in households across the country between 1992 and 2021 [19]. A total of 581124 under-five children were selected from 620041 women of reproductive age; out of these selected children, 533478 were selected for statistical analysis of CIAF.
Inclusion and exclusion criteria
The only Indian women included in this study were of reproductive age (15–49 years) and living in India. Children under five years of age were considered among the selected mothers for this study. The sample selection strategy for the study was illustrated in the following flow chart (Fig 2).
Sample selection for SAF of under-five children.
Patient and public involvement
This study solely relies on secondary data derived from the NFHS in India. During data collection, proper consent was obtained from the participants following the guidelines of the Demographic and Health Survey (DHS). This study has properly utilized the patient and public involvement (PPI) to upgrade the research quality. Although the public was indirectly involved in this study, the study’s outcomes may directly benefit the public domain. As the NFHS data adheres to the standard methodology, participant privacy, and human subjects’ protection, policymakers rely on this information to take appropriate steps to enhance the public health policies that ultimately benefit the citizens of the country.
Unit-level study variables
Outcome variables.
The outcome variable for this study was the SAF, which was developed based on the established CIAF classification (S1 Table). The description of SAF is thoroughly mentioned in the Operational Definition and Classifications section. According to the literature, the current CIAF classification consists of seven subgroups [20,21]. The first subgroup (Group A) is designated as No-Anthropometric Failure (N-AF) because it does not include any undernutrition conditions. In contrast, the remaining subgroups (Groups B to Y) encompass various undernutrition conditions, collectively referred to as anthropogenic failures (AF) [20,21]. The AF signifies inadequate or poor nutrition, assessed through nutritional indicators such as wasting, stunting, and underweight [21]. These indicators were determined in accordance with WHO recommendations, which defined a z-score of less than –2.0 SD for weight-for-height as wasting, height-for-age as stunting, and weight-for-age as underweight [22].
Explanatory variables.
Socio-demographic and maternal characteristics were included in the explanatory factors. Explanatory factors were selected and categorized based on previous studies while retaining their meaning and were available in the NFHS-5 dataset. Birth weight (LBW, non-LBW), place of birth (home, institution), birth order (≤2, > 2), mother’s age at 1st childbirth (<18, 18–25, > 25), religion (Hindu, Muslim, Christian, Other), social categories (scheduled tribe, scheduled caste, other backward classes, general), wealth index (poor, middle, rich) have been shown as socio-demographic factors [11,14,23]. Mother’s education (non-education, primary, secondary, higher), full antenatal care (yes, no), mother’s BMI (underweight, normal, overweight/obese), mother’s WHR (RMC, no-RMC), mother’s anaemia (anaemic, non-anaemic) have been shown as maternal factors [11,14,23].
Operational definition and classifications
Severity of anthropometric failure (SAF).
Anthropometric failure (AF) was defined as children with wasting, stunting, and underweight, indicating insufficient height and weight for their age [24]. Children can exhibit these undernutrition symptoms in four different ways: absence of all undernutrition indicators, presence of any one indicator, presence of two indicators, presence of all three malnutrition indicators. Based on this occurrence, CIAF prevalence can be classified into four categories based on severity, namely no AF (N-AF), single AF (S-AF), double AF (D-AF), and triple AF (T-AF), as shown in S1 Table.
Socio-demographic and maternal factors.
Low birth weight (LBW) refers to birth weights <2500 grams, while non-LBW refers to birth weights ≥2500 grams [25]. The religion group “other” comprises Sikh, Buddhist/Neo-Buddhist, Jain, Jewish, Parsi/Zoroastrian, no religion, and other, with a total of less than 5%. The social category was defined by whether the head of the household self-identifies as a scheduled tribe (ST), scheduled caste (SC), other backward classes (OBC) member, the remaining caste/tribe population was determined as ‘general’ category [26]. Scheduled Castes, Scheduled Tribes, and Other Backward Classes are constitutionally recognized and protected communities in India. Scheduled Castes (SC) are those who have historically faced oppression, economic disadvantage, lack of education, political powerlessness, and cultural subordination to the upper caste. They are recognized under Articles 341 and 366 (24) of the Constitution. Scheduled Tribes are those who share a common culture, language, and territory, and who experience economic disadvantage. They are recognized under Articles 342 and 366 (25) of the Constitution. Other Backward Classes are economically disadvantaged and lack access to education, affecting their overall quality of life, including access to food, education, and healthcare. The wealth index measured a household’s wealth based on the quantity and variety of consumer goods it owns, its assets, and housing characteristics, which cumulatively weighted and splatted, with the richest families receiving the highest score and the poorest receiving the lowest [19]. Maternal education solely relates to formal institutional education. Full antenatal care was defined as ensuring four or more antenatal visits, at least one tetanus toxoid (TT) injection, and consumption of iron folic acid (IFA) tablets or syrup for at least 100 days [27]. Body mass index (BMI) was determined by dividing weight in kilograms by height in meters squared (kg/m^2^), and the obtained values were classified as underweight if it was < 18.5; normal was considered to be between ≥18 and <25; and overweight/obese was ≥ 25 based on WHO (2004) classification for adults [28]. According to the WHO, the Waist–Hip Ratio (WHR) for women indicates the risk of Metabolic Complications (RMC) [29]. A WHR value of ≥0.85 cm was classified as RMC, while a WHR value of <0.85 cm indicates no-RMC [29]. A woman was considered anaemic when her haemoglobin level was < 11 level in grams/decilitre (g/dl) [19].
Statistical analysis
Summary of outcome and explanatory variables were defined descriptively between urban and rural India using frequencies and percentages. The Z-proportion test was used to assess the variations in proportional frequency between urban and rural areas. After performing a multicollinearity test, explanatory variables were chosen, with a variance inflation factor (VIF) of less than 5 being taken into consideration. The adjusted relative risk ratio (ARRR) was utilized to determine the combined impact of socio-demographic and maternal characteristics on SAF using multinomial logistic regression (MLR), where N-AF considered as reference in dependent variable in respect of S-AF, D-AF, and T-AF [30]. Statistical significance was considered based on 95% confidence interval (CI), and p ≤ 0.05. Statistical analyses were carried out using MS Excel and STATA.
Ethics approval and consent to participate
The present study relies on nationally representative data from the National Family Health Survey 2019–2021 (NFHS-5) obtained from the Demographic and Health Survey (DHS) and available in the public domain. NFHS-5 obtained written consent from each selected subject. The ICF Institutional Review Board (IRB) examined and approved the study design and participant confidentiality, the NFHS-5 data were already ethically approved; therefore use of these data no longer required any other ethical approval. NFHS-5 discussed about the objectives of the survey to selected participants and obtained their written consent.
Results
The National Family Health Survey (NFHS) data provides a comprehensive view of India’s progress in improving children’s health over the past three decades (Fig 3). The data indicate that the prevalence of N-AF has substantially increased in urban and rural children, and AF has declined.
Decadal trend of SAF in Indian under-five children spanning between 1992 and 2021.(A) Urban India, (B) Rural India.
Single AF (S-AF) is the most common form of anthropometric failure in India, affecting about one in three children according to NFHS 1 data. However, recent data from NFHS 5 shows improvement, with about one in four children affected—25.37% in urban areas and 26.12% in rural areas. Double AF (D-AF) and Triple AF (T-AF) were more common in rural children than urban children. The highest rates of D-AF were recorded in NFHS 3, where about one in four urban and one in three rural children were affected. By NFHS 5, these figures improved to one in five for urban and one in four for rural children. T-AF has also seen a significant drop, especially in recent data. In urban areas, it decreased from 6.13% in NFHS 3 to 3.99% in NFHS 5, while in rural areas, it dropped from 9.61% to 5.26%. Overall, S-AF remains a concern but reflects progress in addressing childhood undernutrition in India (Fig 3).
The latest NFHS 5 data shows that among urban Indian children, the highest prevalence of N-AF was found in Manipur (69.29%), Sikkim and Mizoram (68.75%), Chandigarh (67.72%). whereas in rural areas, Puducherry (67.50%), Punjab (66.24%), Delhi (65.59%) (S1 Fig). The highest prevalence of S-AF was observed in urban Lakshadweep (33.33%), Jammu & Kashmir (32.15%), Tripura (31.54%), whereas in rural Lakshadweep (50.00%), Ladakh (35.00%), Meghalaya (33.52%). The highest prevalence of D-AF was noted in urban Bihar (24.61%), Gujarat (22.38%), Dadra & Nagar Haveli and Daman & Diu (21.95%), whereas in rural Chandigarh (50.00%), Bihar (29.88%), Jharkhand (28.85%). The highest occurrence of T-AF was found in the states of Dadra & Nagar Haveli and Daman & Diu for both urban (7.32%) and rural (9.52%) areas, followed by Maharashtra (5.79%) and Bihar (5.72%) for urban, Gujarat (8.62%) and Maharashtra (7.78%) for rural area (S1 Fig).
Table 1 shows the differences in percentages between urban and rural areas using z-scores. A positive z-score means a higher percentage in urban areas, while a negative z-score means a higher percentage in rural areas. The data reveals that the percentages of N-AF, D-AF, and T-AF were significantly different between the two areas, with z-scores of 19.91 (p < 0.001), −10.59 (p < 0.001), and −2.41 (p < 0.05), respectively.
Table 1: Differences of proportion in variable categories between urban and rural areas based on the latest data (NFHS 5).
A notable difference revealed in certain health and social factors between urban and rural areas. In rural areas, the prevalence of LBW was higher at 18.58% compared to 17.36% in urban areas. Home births were also more common in rural areas (13.11%) than in urban areas (6.01%). Birth order varied significantly, with urban areas seeing 79.27% of families having up to 2 children, while rural areas had a higher percentage (29.64%) of families with more than 2 children. Early childbirth among mothers under 18 was more prevalent in rural areas (12.82%) than in urban areas (8.27%). Additionally, over 70% of first-child births in both regions occurred between the ages of 18 and 25 years. Rural mothers showed higher rates of non-education (24.98%), incomplete antenatal care (51.48%), underweight BMI (21.93%), and anaemia (61.65%). In contrast, urban mothers had higher education levels (28.04%), full ANC (60.92%), overweight/obese BMI (30.21%), and risk of metabolic complications (RMC, 61.41%). Religiously, a majority of Hindu mothers resided in rural areas (81.59%), while Muslim and Christian mothers were more often found in urban regions. Socially, SCs and STs were more prevalent in rural areas (25.75% and 12.78%, respectively). Wealth index showed that rural areas had more poor and middle-class families (58.24% and 20.32%, respectively) compared to urban areas, which had a higher proportion of wealthy families (69.11%) (Table 1).
The data in Table 2 highlights how various socio-demographic and maternal factors influence the occurrence of different types of AF outcomes in urban India. All kinds of AF occur in LBW children, the prevalence of T-AF outcomes was 2.26 times (ARRR 2.26; CI 2.00, 2.56) higher in LBW children compared to non-LBW children. Children born at home have 1.45 times (ARRR 1.45; CI 1.11, 1.89) times higher likelihood of T-AF than those born in institutions. D-AF and T-AF outcomes were more prevalent in third or later births, being 1.38 and 1.19 times (ARRR 1.38, CI 1.28, 1.48; ARRR 1.19, CI 1.03, 1.36) more common, respectively. Pregnancies occurring between the ages of 18 and 25 show 1.22 times (ARRR 1.22; CI 1.04, 1.45) higher risk of T-AF compared to pregnancies over 25. Low maternal education significantly increases the risk of all types of AF, with the risk being highest 2.19 times (ARRR 2.19; CI 1.75, 2.73) for T-AF among mothers with only a primary education. Inadequate antenatal care contributes to 1.18 times (ARRR 1.18; CI 1.06, 1.32) higher risk of T-AF. Maternal underweight was associated with higher prevalence rates of all AF types, particularly T-AF (ARRR 1.61, CI 1.39, 1.87), while overweight/obesity in mothers shows a reduced risk across categories. Maternal anaemia also raises the risk of D-AF by 1.06 times (ARRR 1.06; CI 1.00, 1.13). Muslim children face a 1.29 times higher risk of S-AF and a 1.20 times higher risk of D-AF (ARRR 1.29, CI 1.21, 1.38; ARRR 1.20, CI 1.11, 1.30, respectively). Children from STs have a higher risk of S-AF and D-AF (ARRR 1.31, CI 1.16, 1.49; ARRR 1.20, CI 1.03, 1.38, respectively), whereas children of OBCs show 1.19 times (ARRR 1.19, CI 1.03, 1.36) higher risk for T-AF. Children from families with poor wealth index were more likely to experience all forms of AF, with T-AF prevalence being 1.67 times (ARRR 1.67, CI 1.41, 1.96), higher in poor families compared to rich families (Table 2).
Table 2: Factors affecting SAF in urban areas of India based on the latest data (NFHS 5).
In rural India, similar trends to urban areas were observed regarding the impact of socio-demographic and maternal factors on SAF. LBW children faced a higher risk for all forms of AF, with 2.33 times (ARRR 2.33, CI 2.18, 2.50) higher prevalence in T-AF. Home-born children were also more vulnerable, exhibiting risks 1.16 times for D-AF and 1.38 times for T-AF compared to those born in hospitals (ARRR 1.16, CI 1.08, 1.24; ARRR 1.38, CI 1.24, 1.53, respectively). Higher birth order was a common factor, particularly for D-AF, which had 1.22 times (ARRR 1.22, CI 1.17, 1.27) higher risk in third or later-born children. Early pregnancies (under 18) raised the risk of T-AF by 1.28 times (ARRR 1.28, CI 1.12, 1.46), while pregnancy between 18 and 25 increased the risk of S-AF by 1.07 times (ARRR 1.07, CI 1.01, 1.13) compared to those over 25. Lower maternal education levels were linked to a higher prevalence of all forms of AF, particularly for T-AF, which was 1.91 times (ARRR 1.91, CI 1.67, 2.19) more common among uneducated mothers. Inadequate ANC increased D-AF risk by 1.05 times (ARRR 1.05, CI 1.01, 1.09). Underweight mothers exhibited over twice the odds for T-AF (ARRR 2.01, CI 1.88, 2.15), and children of mothers with RMC had 1.10 times (ARRR 1.10, CI 1.07, 1.14) higher risk of S-AF. Anemic mothers increased the risk of D-AF by 1.08 times (ARRR 1.08, CI 1.05, 1.12). Muslim children were at higher risk of S-AF and D-AF being 1.19 times and 1.17 times (ARRR 1.19, CI 1.12, 1.25; ARRR 1.17, CI 1.10, 1.24, respectively). Socially disadvantaged groups (STs, SCs, and OBCs) showed even greater vulnerability, particularly ST children who had 1.79 times (ARRR 1.79, CI 1.59, 2.02) higher risk of T-AF. Lower wealth index was a common risk factor, children from poorer and middle-wealth index families had elevated risks for T-AF, with prevalence rates 1.82 and 1.31 times higher (ARRR 1.82, CI 1.66, 2.00; ARRR 1.31, CI 1.18, 1.46, respectively) (Table 3).
Table 3: Factors affecting SAF in rural areas of India based on the latest data (NFHS 5).
Discussion
This study provides critical insights into the trends and severity of anthropometric failure (SAF) among under-five children in both urban and rural settings in India. While there has been significant progress in child nutrition over the past three decades, our findings illustrate that rural areas continue to exhibit a higher prevalence of AF, particularly in the forms of D-AF and T-AF. The consistency of S-AF over time indicates that despite improvements, critical challenges remain, necessitating targeted interventions.
An inequality was found not only in child nutrition but also in socioeconomic and social determinants between urban and rural populations. Urban residents typically experience more favourable socioeconomic conditions compared to their rural counterparts. This is evident in a higher percentage of families with a higher wealth index (69.11% of rich wealth index), more babies were born in medical institutions, and smaller family units that often limit themselves to two children. Moreover, mothers in urban settings tend to be older when giving birth, possess higher educational qualifications, and receive full antenatal care. Additionally, these mothers typically display lower incidences of underweight conditions and anaemia.
In contrast, rural areas face significant poverty challenges (58.24% of poor wealth index) that impact their populations disproportionately. These areas often have more people from Scheduled Tribes and Castes, which adds to their social and economic challenges. Maternal health in rural regions is concerning, with higher rates of maternal anaemia and underweight mothers, along with lower education than in urban. Such disparities are not only present in India but also reflect common patterns observed in numerous LMICs, underscoring an urgent need for focused efforts to tackle these inequalities [31–34].
A notable risk factor for AF identified in this study was low birth weight. This connects with similar studies in Ethiopia and Tanzania, where low birth weight was linked to stunting [35,36]. This shows how important it is to focus on maternal health during pregnancy, as low birth weight can lead to stunting. The findings were in line with studies conducted in Tanzania and Myanmar and showed that children born at home have a higher risk of developing AF than children born in institutions [36,37]. This disparity likely arises from the fact that institutional births provide better access to skilled obstetric and medical care, highlighting the imperative for increasing institutional deliveries across rural areas.
The relationship between maternal education and child nutrition cannot be overstated. Lower levels of maternal education were associated with higher rates of AF. This finding resonates with previous studies from various nations, including Bangladesh, Yemen, Tanzania, Nairobi, Burkina Faso, and Malawi, indicating that educated mothers are more likely to access vital health information for their children [6,7,38–41].
Maternal education, particularly the quality of education received, is crucial in promoting both child and maternal health. Research consistently shows that mothers with higher levels of education possess a greater understanding of essential health concepts, which directly influences their ability to provide effective antenatal and postnatal care [42]. These educated mothers are typically more informed about important health practices, such as regular medical check-ups during pregnancy, the need for vaccinations, and the significance of proper nutrition for themselves and their children [42–44]. Thus, educational interventions aimed at women could serve as a powerful tool in combating child undernutrition.
Our findings also underscore the significance of antenatal care; women who did not receive such care were at a heightened risk for having children affected by AF. This is consistent with global studies that have documented similar trends, suggesting that access to prenatal healthcare is crucial for improving maternal and child health outcomes in Bangladesh, Peru, Nepal, Yemen, and Thailand [20,45–48]. Notably, mothers with a normal BMI, indicating nutritional well-being are less likely to be undernourished in their children, which have also been observed in Ethiopia [49]. In this regard, it was pointed out poor maternal nutritional status as a risk factor for infant deficit and fetal growth scaling down, and consequently yields to low birth weight [50].
In urban areas, specific risk factors such as maternal anemia and central obesity, as indicated by higher waist-to-hip ratios, have emerged as notable contributors to AF. According to the WHO, a waist circumference greater than hip circumference increases the risk of metabolic complications, indicating central obesity [29]. Moreover, our study highlights a concern regarding specific communities, particularly religious Muslims, Scheduled Tribes, and Scheduled Castes, who are disproportionately affected by AF. The interplay between wealth index and AF prevalence further complicates the issue; indeed, socioeconomic factors play a significant role in child nutrition. Low-income households are often unable to provide adequate nutrition, resulting in poor child health outcomes.
The findings from this study echo trends observed in other LMICs, where low maternal education and income, along with inadequate prenatal care, maternal undernutrition, small birth size markedly affect child nutrition, such as Tanzania, Ethiopia, Bangladesh, Pakistan and sub-Saharan African countries [7,8,13,14,18,20].
To effectively address child undernutrition, India needs to develop multifaceted policies that encompass both urban and rural perspectives. The criteria outlined in Supplementary Table (S2 Table) should serve as a foundational guide for formulating these policies, as they reflect critical characteristics commonly associated with AF in both settings. It will be crucial to prioritize initiatives targeting low birth weight, maternal undernutrition, wealth index, and children from socially vulnerable communities in order to make progress toward the 2030 Agenda for Sustainable Development goals [51].
Strengths and limitations of the study
The present study examines the nutritional status trends of children from 1992 to 2021 through the analysis of five rounds of NFHS data. The study seeks to address child undernutrition by integrating wasting, stunting and underweight into a common platform with the CIAF concept. The present study also attempted to account for the influence of numerous variables, considering as maternal and socio-demographic characteristics, but they left out certain others associated with genetics, environment, and food. However, additional investigation is required to fully grasp the situation by identifying all potential causes of child malnutrition in India. The data collected through a cross-sectional survey method, however, impedes the establishment of causality in the results. Furthermore, the possibility of social desirability and recall biases among respondents may have influenced the findings, and thus the accuracy of the results.
Conclusion
The nutritional status of Indian under-five children has improved significantly over the past three decades, with a marked decrease in the prevalence of anthropometric failure from 1992 to 2021. However, currently, more than two-fifths of these children are still affected by either S-AF or D-AF, particularly in rural areas, highlighting an urgent need for targeted interventions.
Childhood anthropometric failure is a multi-faceted phenomenon influenced by various factors, including maternal health and socio-demographic characteristics. To effectively address these challenges, a comprehensive approach is essential. This should involve enhancing maternal health, expanding educational opportunities, and implementing community-based nutrition programs, especially for vulnerable groups such as those from Scheduled Castes and Scheduled Tribes. Moreover, targeted strategies must consider the unique needs of both urban and rural populations, with a focus on reducing low birth weight, improving maternal nutrition, and enhancing the economic conditions of families to combat childhood undernutrition effectively.
Supporting information
S1 TableClassification of severity of anthropometric failure (SAF) based on CIAF.(DOCX)
S2 TableTop five factors affecting SAF among under-five children in Urban and rural India.(DOCX)
S1 FigHeatmap showing percentage distribution of SAF across Indian States/Union Territories.(A) Urban area, and (B) Rural area.(DOCX)
S1 FileData.(SAV)
The reference list from the paper itself. Each links out to its DOI / PubMed record.
- 1Dasgupta A, Sahoo S, Taraphadar P, Preeti P, Biswas D, Kumar A, et al. Composite index of anthropometric failure and its important correlates: a study among under-5 children in a slum of Kolkata, West Bengal, India. Int J Med Sci Public Health. 2015;4(3):414. doi: 10.5455/ijmsph.2015.0111201485 · doi ↗
- 2UNICEF/WHO/WBG. Levels and trends in child malnutrition: UNICEF/ WHO/ World Bank Group Joint Child Malnutrition Estimates: Key findings of the 2023 edition. New York: UNICEF and WHO. 2023.
- 3UNICEF/WHO/WBG. Levels and trends in child malnutrition: key findings of the 2021 edition of the joint child malnutrition estimates. Geneva: World Health Organization. 2021.
- 4WHO. Malnutrition. 2021 [cited 2022 20 June]; Available from: https://www.who.int/news-room/fact-sheets/detail/malnutrition
- 5UNICEF/WHO/WBG. Levels and trends in child malnutrition: Key Findings of the 2020 Edition of the Joint Child Malnutrition Estimates. 2020, Geneva: World Health Organization.
- 6Al-Sadeeq AH, Bukair AZ, Al-Saqladi AM. Assessment of undernutrition using Composite Index of Anthropometric Failure among children aged < 5 years in rural Yemen. East Mediterr Health J. 2019;24(12):1119–26.30799551 10.26719/2018.24.12.1119 · doi ↗ · pubmed ↗
- 7Khamis AG, Mwanri AW, Kreppel K, Kwesigabo G. The burden and correlates of childhood undernutrition in Tanzania according to composite index of anthropometric failure. BMC Nutr. 2020;6(1):39. doi: 10.1186/s 40795-020-00366-3 · doi ↗
- 8Fenta HM, Zewotir T, Muluneh EK. Disparities in childhood composite index of anthropometric failure prevalence and determinants across Ethiopian administrative zones. P Lo S One. 2021;16(9):e 0256726. doi: 10.1371/journal.pone.0256726 34555038 PMC 8459952 · doi ↗ · pubmed ↗