CD8+ T cells cross-restricted by HLA-B*57 and HLA-E*01 recognize HIV Gag with different functional profiles
Kevin J. Maroney, Michael A. Rose, Allisa K. Oman, Abha Chopra, Hua-Shiuan Hsieh, Zerufael Derza, Rachel Waterworth, Mark A. Brockman, Spyros A. Kalams, Anju Bansal, Paul A. Goepfert

TL;DR
This study shows that CD8+ T cells in people with HIV can be restricted by two different HLA molecules, leading to distinct immune responses.
Contribution
The study identifies dual HLA restriction of HIV-specific CD8+ T cells and their distinct functional profiles.
Findings
B57-CD8s produce higher cytotoxic cytokines, while E-CD8s produce more chemotactic cytokines.
TCR clonotypes are cross-restricted by HLA-B*57 and HLA-E*01:03.
Dual restriction is observed in people with HIV with lower viral load.
Abstract
Few HIV-specific epitopes restricted by non-classical HLA-E have been described, and even less is known about the functional profile of responding CD8+ T cells (CD8s). This study evaluates the functional characteristics of CD8s targeting the Gag epitope KF11 (KAFSPEVIPMF) restricted by either HLA-E (E-CD8s) or HLA-B57 (B57-CD8s). CD8s from 8 people with HIV (PWH) were cocultured with KF11 peptide presented by cell lines expressing HLA-B*57:01, HLA-E*01:01, or HLA-E*01:03. CD8 responses were analyzed using single-cell RNA and TCR sequencing. Supernatants were also assessed for soluble protein profiling. HLA-I multimers were developed to identify CD8s restricted by HLA-B57 and/or HLA-E ex vivo. B57-CD8s secreted higher levels of cytotoxic cytokines such as IFN-γ, whereas E-CD8s produced more chemotactic cytokines, including RANTES, CXCL10 (IP-10), and IL-27, findings that were…
Genes, proteins, chemicals, diseases, species, mutations and cell lines named across the full text — each resolved to its canonical identifier and authoritative record.
Click any figure to enlarge with its caption.
 Figure 1
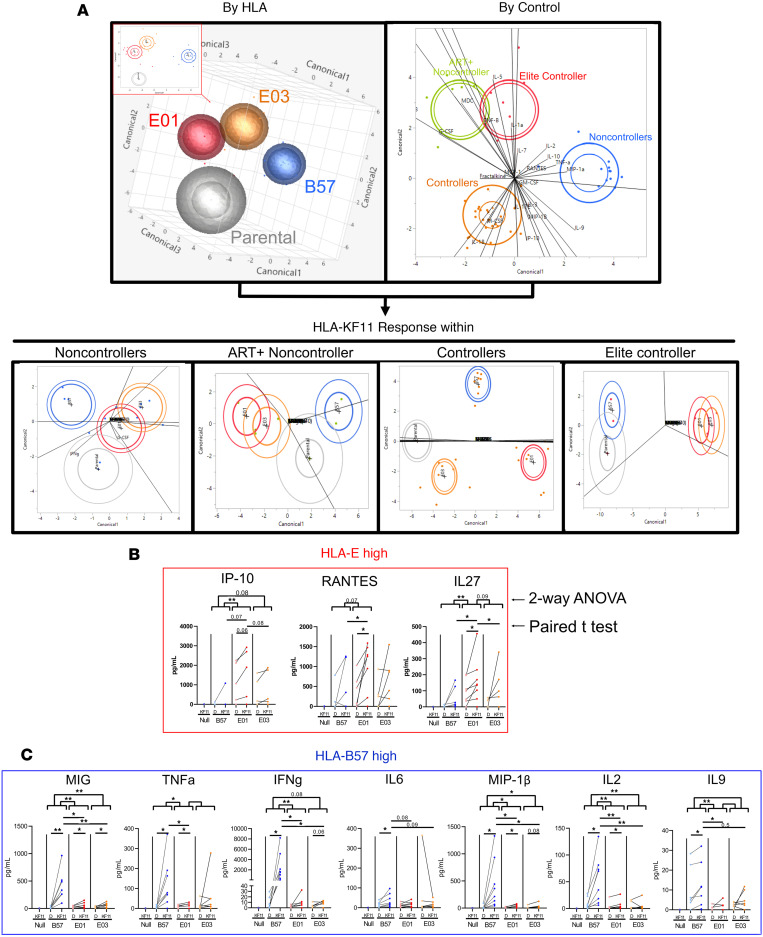 Figure 2
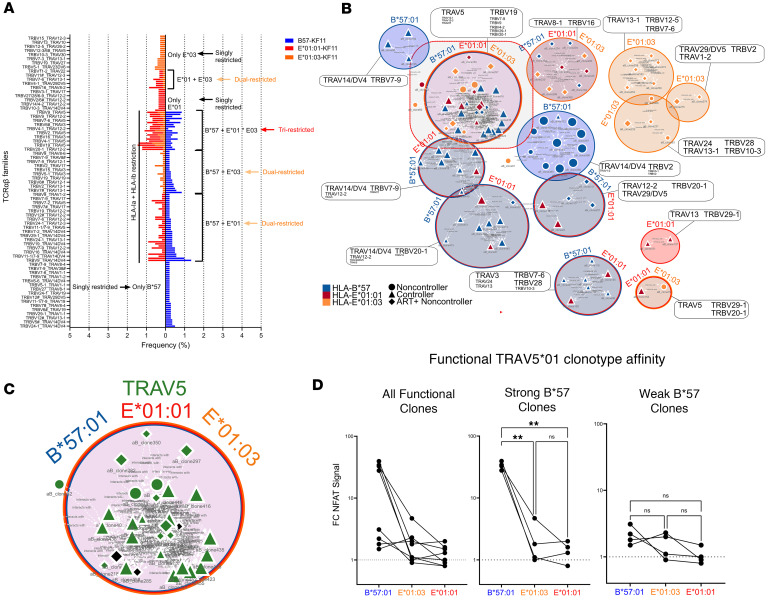 Figure 3
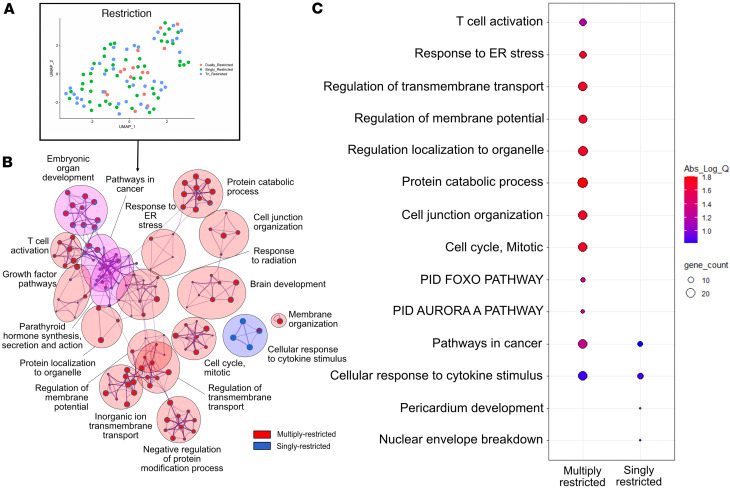 Figure 4
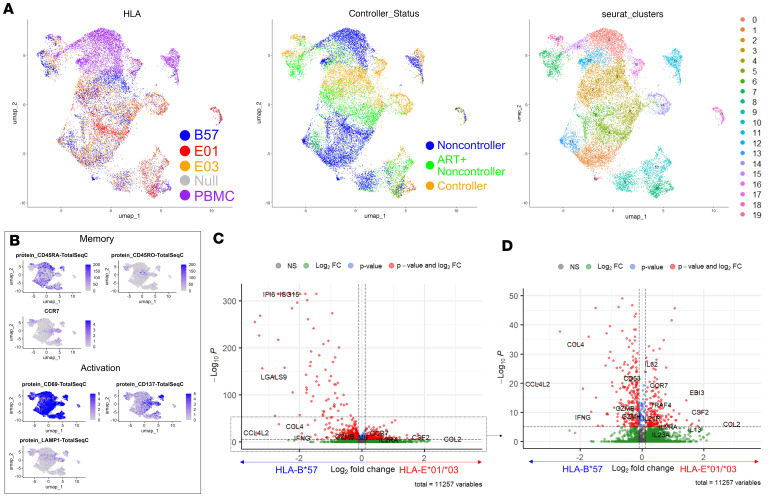 Figure 5
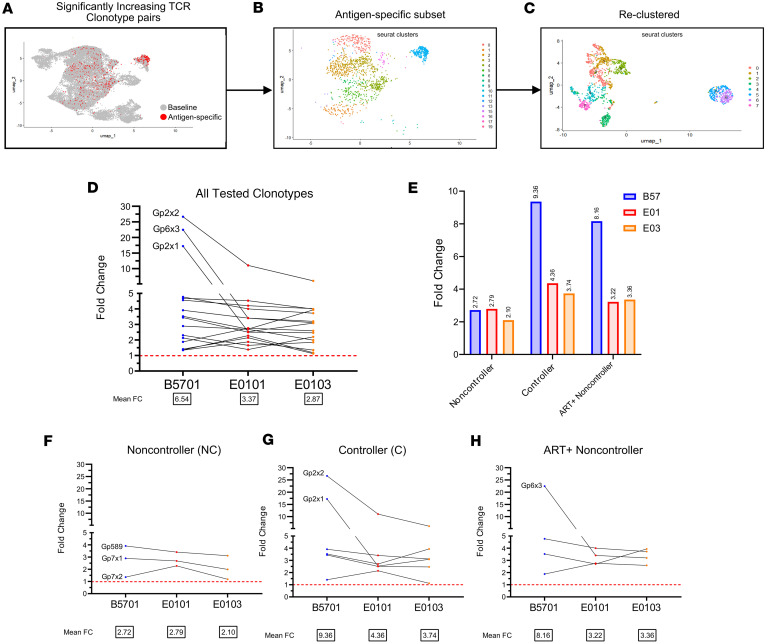 Figure 6
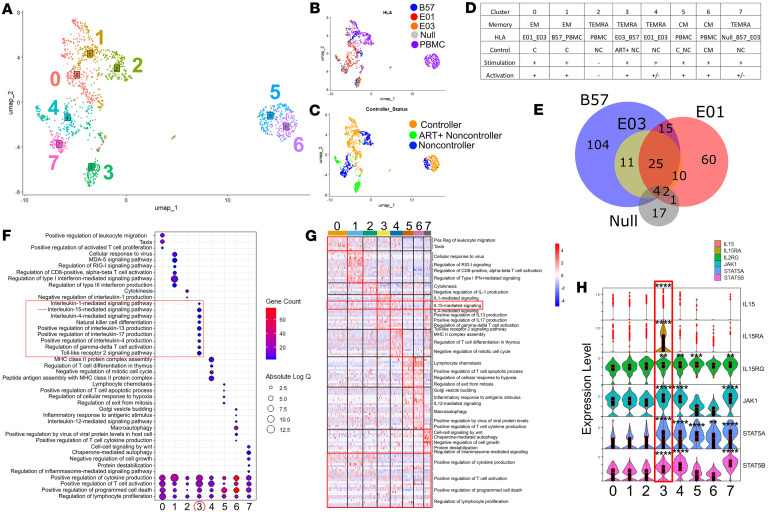 Figure 7
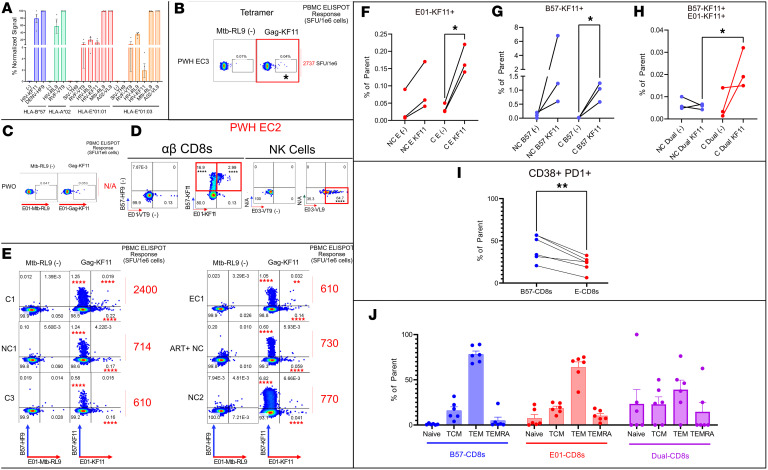 Figure 8
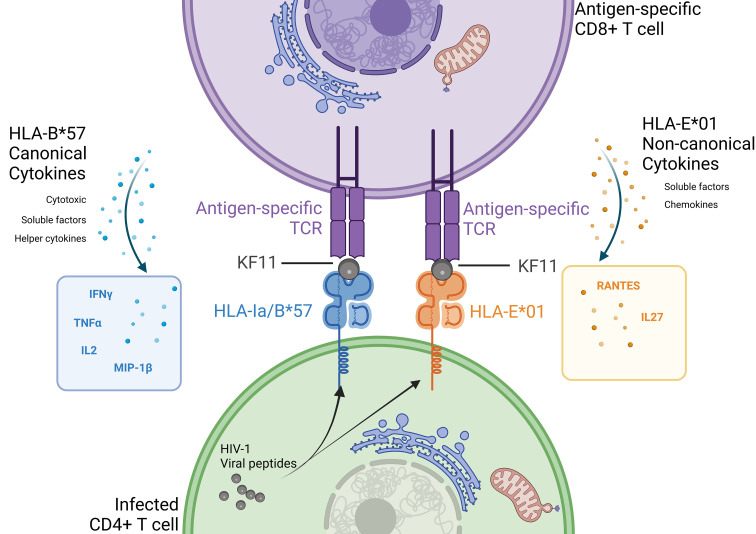 Figure 9
- —NIH
Peer Reviews
No public reviews on file for this paper yet. If you reviewed it on a platform where reviews are public (OpenReview, ICLR, NeurIPS, ICML), you can paste yours below so the community can read it here.
Videos
No videos yet. Explain this paper in a talk, walkthrough, or lecture? Add one.
Taxonomy
TopicsHIV Research and Treatment · T-cell and B-cell Immunology · Immune Cell Function and Interaction
Introduction
Seminal studies demonstrating that vaccine-induced, Mamu-E–restricted CD8^+^ T cells (CD8s) can prevent the establishment of SIV infection have generated interest in the potential of HLA-E–restricted responses in HIV research (1, 2). CD8s restricted by non-classical HLA molecules may be particularly advantageous for vaccine design, as only two HLA-E alleles (E01:01 and E01:03) need to be considered, each occurring at approximately 50% frequency in human populations (1–4).
We previously reported that the immunodominant HIV-1 epitope KF11 (KAFSPEVIPMF, Gag [162–172]), classically presented by the controller-associated, classical HLA-B*57 allele, can also elicit CD8^+^ T cell responses restricted by HLA-E (5). This finding is supported by a separate report of de novo HLA-E–restricted CD8^+^ T cell responses to RL9 (RMYSPTSIL, Gag [275–283]) (6), confirming that HLA-E can present HIV-1–derived epitopes to human CD8s. Nonetheless, HLA-E–restricted CD8^+^ T cell responses remain understudied in the context of HIV infection.
HLA-E–restricted CD8^+^ T cell responses may also contribute to control of HIV infection. However, identifying HIV-derived HLA-E–restricted epitopes has been challenging, largely because of their extremely low affinity for HLA-E (6–8), especially in contrast to immunogenic epitopes derived from Mycobacterium tuberculosis (Mtb) or human cytomegalovirus (HCMV) (9).
To better understand the role that HLA-E– and HLA-B57–restricted CD8s (E-CD8s and B57-CD8s) play in chronic HIV-1 infection, we used targeted single-cell RNA and T cell receptor sequencing (scRNA-seq and scTCR-seq) complemented by a high-parameter Luminex assay. This approach helped identify shared and unique features of KF11-specific CD8s restricted by these alleles. We found that KF11-specific CD8s can be cross-restricted by both HLA-B57 and HLA-E (E01:01 and/or E*01:03). Furthermore, scTCR-seq and in vitro TCR reporter assays (10) indicated that certain TCR clonotypes displayed cross-restriction for KF11 presented by both HLAs. Despite this cross-restriction, we observed functionally distinct secretory protein and RNA expression profiles between CD8s stimulated by KF11 in the context of HLA-B57 or HLA-E. In order to determine whether these phenomena can be observed ex vivo, we also developed HLA-E/B57 multimer technology, and were able to confirm their functional distinction, as well as dual restriction in the controllers.
Results
Study design.
We analyzed CD8^+^ T cell responses of 8 people with HIV (PWH), categorized as follows: one antiretroviral therapy–naive (ART-naive) elite controller (EC), four ART-naive controllers (C), and 2 ART-naive non-controllers (NC), with plasma viral loads <200, <2,000, or >2,000, respectively, as well as one ART-suppressed individual with viral suppression (ART+ NC). All patients expressed HLA-B57 and displayed KF11-specific responses by IFN-γ ELISPOT assay. CD8s from each participant were cocultured with single-HLA-expressing target cells (either HLA-B57, -E01:01, or -E01:03) loaded with KF11 peptide (Supplemental Figure 1; supplemental material available online with this article; https://doi.org/10.1172/jci.insight.189909DS1). Antigen-specific CD8s (identified as dual CD69^+^CD137^+^) were then sorted by flow cytometry and analyzed via SMART-seq2–based scRNA-seq and scTCR-seq. Supernatants were also assessed using a high-parameter Luminex assay. For a subset (one each of C, ART+ NC, and NC), we performed 10x Genomics–based scRNA-seq, TCR-seq, and CITE-seq analysis. We also confirmed HLA-E and/or -B57 restriction for CD8s ex vivo (not in 18-hour in vitro assay) by multimer.
Cytokine profiles of B57- and E01-CD8s are functionally distinct.
Using a 38-plex human cytokine/chemokine panel, we assessed cytokine secretion following KF11 stimulation with HLA-B57 or HLA-E01:01/03 (Supplemental Figure 2). Secreted proteomes formed functionally distinct spatial clusters by HLA on the top 3 component groupings of cytokines (Figure 1A). Additionally, responses also clustered distinctly by HIV control status, with ART+ NC clustering more closely with the EC than other ART-naive NCs (Figure 1A). The greatest HLA-restricted functional distinctions were observed in controllers and the EC, indicating increasing divergence in cytokine profiles with lower viral loads (Figure 1A).
Of the cytokines examined, CXCL10 (IP-10), CCL5 (RANTES), and IL-27 were significantly increased in E-CD8s (Figure 1B), while CXCL9 (MIG), TNF-α, IFN-γ, IL-6, CCL4 (MIP-1β), IL-2, and IL-9 were significantly elevated in B57-CD8s, by 2-way ANOVA (Figure 1C). Antigen specificity was confirmed by paired t test between DMSO and KF11 conditions. Two of these three E-CD8 cytokines and four of seven B57-CD8 cytokines were then confirmed to be transcribed in CD8 subsets upon 10x Genomics–based single-cell assays (Supplemental Figure 3).
TRAV5*01 metaclonotype cluster cross-restricted in controllers and ART+ non-controller.
We sorted KF11-specific CD8s to perform scRNA/TCR-seq (Supplemental Figure 4). Single KF11-specific T cells activated in their HLA-restricted condition over null line coculture were sorted into 96-well plates by FACS and sequenced. Based on paired TCR α/β variable gene sequences, most responses across all samples appeared to be cross-restricted (i.e., the same gene pairs were isolated from cells stimulated by B57 and E) (Figure 2A). This phenomenon was also observed at an individual PWH level (Supplemental Figure 5).
To account for the inherent heterogeneity of TCR variable chain sequences between different individuals (even those specific for the same antigen), we applied a sequence similarity–based approach (implemented in TCRdist3) (11) to cluster highly related clones into metaclonotypes (Figure 2B). We observed clusters of TCRs singly restricted by HLA-E01:01, HLA-E01:03, or HLA-B57:01, dually restricted by HLA-E01:01 and -B57:01, and a large cluster of tri-restricted clonotypes enriched for controller and ART+ NC TCRs. The tri-restricted cluster specifically was enriched for TRAV5 and TRBV19 (Figure 2C). ART-naive NC clones were primarily identified as being mono-B57-restricted (Figure 2B). The cross-restriction of TRAV5-containing clones was confirmed using an in vitro luciferase reporter cell assay, comparing functional avidity to HLA-restricted KF11 over KF11-loaded HLA-A02 negative controls (Figure 2D). TCR signaling intensity was reduced when KF11-pulsed target cells expressed either E01:01 or E01:03, compared with B57, suggesting lower peptide affinity of KF11 for HLA-E as compared with canonical HLA-B57; however, even these responses were significantly elevated over HLA-A02:01 KF11-pulsed controls for the same clones.
Cross-restricted TCR clonotypes express transcriptional signatures consistent with higher metabolic activity.
To determine transcriptional features associated with cross-restriction, we stratified clonotypes according to their presence in tri-restricted, dually restricted, or singly restricted clusters and then performed model-based analysis of single-cell transcriptomics (MAST) (12) on the linked scRNA-seq data for each clonotype’s CD8s (Figure 3). While the transcriptional profiles of T cells in each type of cluster did not cluster separately by the most variable genes (Figure 3A), when compared with singly restricted clones directly, the multiply-restricted clones displayed upregulation of metabolism-associated genes associated with protein catabolic activity, mitosis, and T cell activation pathways (Figure 3B). In fact, most transcriptional signatures were higher in CD8s that were multiply restricted (Figure 3C).
Single-cell transcriptional expression clusters distinctly depending on HLA restriction.
To obtain an in-depth single-cell-level resolution of molecular signatures delineating E-CD8s from B57-CD8s, we subjected 3 PWH (one C, one ART+ NC, and one ART-naive NC; selected based on sample availability) to 10x Genomics single-cell TCR- and CITE-seq. We adopted a broader sorting strategy with multiplexed conditions to assess memory T cell subsets and markers that may differentiate E-restricted from B57-restricted CD8s. In short, we performed 10x scRNA-seq, TCR-seq, and CITE-seq on enriched populations of activated and non-activated CD8s from all conditions (Supplemental Figure 1). Demultiplexing, pre-processing, and quality control of the data were carried out using Seurat as described in Methods (Supplemental Figure 6).
CD8s primarily clustered by HIV controller status and HLA restriction in Seurat uniform manifold approximation and projection (UMAP) representation (Figure 4A). We also observed through CITE-seq that CD45RA and CD45RO, the activation markers CD69, CD137, and LAMP1, and RNA expression of the chemokine CCR7 were present within distinct clusters of cells, especially CD45RA versus CD45RO, validating their fidelity (Figure 4B). The most variably expressed genes were also predominantly immune related (CCL4, XCL1, IL-2, XCL2, IL-13, etc.) and served to differentiate distinct clusters (Supplemental Figure 7, A and B). Pairwise MAST analysis between B57-CD8s and grouped E-CD8s (E01:01/E01:03) confirmed upregulation of previously identified secreted HLA-restricted cytokines, including EBI3 (a subunit of IL-27) as well as CCL4 and IFN-γ, upregulated in E-CD8s or B57-CD8s, respectively (Figure 4, C and D). Two of three E-CD8–associated and over half of B57-CD8–associated cytokines were also upregulated in corresponding CD8 subsets (Supplemental Figure 3).
Antigen-specific TCRs identified through VCR-Seek bioinformatic pipeline are all cross-restricted.
Traditional TCR analysis does not incorporate a significance testing component. We therefore developed a high-throughput and scalable analysis pipeline to identify all TCR α, β, and paired αβ families or clonotypes that were from the antigen-specific subset, identified as significantly increasing in KF11-stimulated as compared with unstimulated conditions in all metadata contexts (Supplemental Figure 8). When assembled into metaclonotype clusters, antigen-specific TCRs were almost entirely cross-restricted (Supplemental Figure 9). Consistent with our previous results, we again identified a cluster (cluster 6) of TRAV5/TRBV19-encoding cells that were associated with the tri-HLA-restricted phenotype and contained clonotypes overlapping with those identified in the SMART-seq tri-restricted cluster; this cluster was also dominated by clones isolated from the controller and ART+ NC as opposed to ART-naive NC. Extending our earlier observations, cluster 6 also includes TCR sequences isolated from KF11-stimulated PBMCs, indicating that this population was not simply an artifact of using in vitro–generated single HLA-expressing cell lines for antigen presentation but that it can also be observed in the context of an ex vivo response. CD8s from the whole dataset were labeled as “antigen-specific,” i.e., those possessing an antigen-specific TCR (Figure 5A); “subset” (Figure 5B); and then “reclustered” (Figure 5C) for downstream analysis.
These TCRs were again tested for HLA restriction through NFAT reporter assays. All TCRs were cross-restricted, more consistently than TCRs identified through the previous method (Figure 5D). Notably, TCRs from the ART-naive NC had lower TCR affinity across all HLAs (Figure 5E). One clonotype in particular, Gp2x2, was found to increase only in the controller and demonstrated extremely high avidity for KF11 across all 3 HLAs (26-, 11-, and 6-fold change across B57, E01:01, and E*01:03, respectively). All other tri-restricted clonotypes demonstrated high but roughly equal avidity across all 3 alleles in comparison with Gp2x2, Gp6x3, and Gp2x1, in contrast to previously isolated TCRs within NC (Figure 5F), C (Figure 5G), and ART+ NC (Figure 5H).
IL-15 vaccine response signature unique to activated cross-restricted B57/E01-restricted T cell cluster.
Prior data from rhesus macaques showed involvement of IL-15 signaling in MHC-E–restricted SIV-protective responses (13). We therefore examined whether similar signatures appeared in human HLA-E–restricted CD8s. Limiting analysis to significantly antigen-induced TCR clonotypes improved clustering resolution (Figure 6A), resulting in identification of 8 distinct cell subsets (labeled as 0 to 7). Cells clustered more distinctly by HLA restriction (Figure 6B) in this analysis than in the complete dataset, though the separation between clusters was still driven mainly by controller status (Figure 6C). Interestingly, upon deeper examination, clonotypes segregated into distinct clusters that displayed distinct transcriptional signatures (Supplemental Figure 10). This suggests that HIV-specific T cells are functionally distinct from one another at the clonotype level.
Using quantile expression of CITE-seq markers, cells were assigned activation and memory states, and clusters inherited the metadata based on number of cells with each metadata type (Figure 6D). Consistent with our previous secretome findings, when directly compared, E01-CD8s were transcriptionally distinct from B57-CD8s, while E03-CD8s were less distinct (Figure 6E).
Gene Ontology analysis of differentially expressed genes within each cluster revealed IL-15 signaling as uniquely enriched in cross-restricted cluster 3 (TEMRA E03_B57 Stimulated Activated), a feature absent in other KF11-specific subsets (Figure 6F), characterized by a set of immune markers (Figure 6G). Notably, all 6 genes mapping to this pathway were significantly upregulated in this cluster (Figure 6H).
Ex vivo detection of functionally distinct HLA-E and dually restricted HLA-B*57 KF11 αβ CD8s.
Previous E-CD8 detection incorporated co-incubations based on CD8/peptide-pulsed antigen-presenting cells and the use of upregulation of activation markers as surrogates of an antigen-specific response as opposed to assessing direct TCR-HLA interaction. To detect E-CD8s ex vivo circulating in PWH PBMCs, we turned to HLA class I multimer technology. We first tested the ability of KF11 to bind its canonical HLA-B57 as well as the proposed HLA-E01:01 and HLA-E01:03 alleles. HIV-KF11 and HIV-RL9 properly loaded canonical HLA-B57 and -A02 monomer (Figure 7A). They both additionally bound HLA-E01:01. However, HIV-KF11 exchanged into HLA-E01:03 at half the rate of -E01:01. Therefore, only HLA-E01:01–exchanged KF11 was tested alongside -B57 KF11 in additional assays.
We initially used Gag-KF11 tetramer–PE to test other PWH with more immunogenic (>1,000 SFU per 1 × 10^6^ cells) KF11 responses for ex vivo E-CD8 KF11 restriction, but were only able to identify a modest E-CD8 KF11 population in EC2, an elite controller with a high-magnitude KF11 response in an IFN-γ ELISPOT assay (2,737 SFU per 1 × 10^6^ cells), at 0.04% E-KF11 over 0.01% irrelevant peptide (Figure 7B). To increase sensitivity, we then constructed HLA-E01:01 and -B57 dextramers (higher valence), which were not recognized in a person without HIV (PWO) (Figure 7C). We identified a much higher B57-CD8 (16.9% of αβ CD94^–^ CD8s) as well as a dually B57/E-CD8 KF11–specific (2.99% of αβ CD94^–^ CD8s) population ex vivo in that same EC2 through dextramer as compared with tetramer (Figure 7D). A majority of NK cells (64.7%) recognized HLA-E01–restricted A02-VL9 over the irrelevant peptide control, validating HLA-E–restricted dextramer specificity (Figure 7D).
Having confirmed dextramer specificity, we then tested the 6 PBMC samples for ex vivo E-CD8, B57-CD8, and dual-CD8 recognition. These were the same PWH samples whose CD8s were sorted via activation-based assays (in vitro) for previous experiments (Figures 1–6). Our dual dextramer staining data demonstrate that all samples showed a detectable E-CD8 response ex vivo at an individual sample level (Fisher’s exact t test) (Figure 7E).
When compared between C and NC, this increase in dually staining dextramers was only significant over controls by paired t test in the controllers (C1, C3, EC1) (Figure 7F). All PWH also had detectable and higher B57-CD8 recognition of KF11 ranging from 0.58% to 6.82% of αβ CD8s, with the highest in a non-controller (NC2). However, owing to high B*57-only expression observed in NC2, this increase over irrelevant peptide was only significant by paired t test in controllers (Figure 7G). The most striking result was that, while weaker than the highly immunodominant response of EC2, significantly positive KF11-specific dually restricted E/B57-CD8 ex vivo detection was only observed in controllers (C1, C3, EC1) and none of the non-controllers (NC1, NC2, ART+ NC), and was significantly higher by magnitude in the controllers (Figure 7H).
To further examine the functional distinction of E- versus B57-CD8s, we examined the exhaustion state of these subsets by dual CD38^+^ and PD-1^+^ staining. Representative gates for CD38^+^PD-1^+^ (Supplemental Figure 11A) or memory subset (Supplemental Figure 11B) staining within E-, B57-, or dual-CD8s within cohort are shown. E-CD8s had lower expression of exhaustion markers compared with B57-CD8s (Figure 7I). Additionally, the same gates for Figure 7D were applied to all the samples shown in Figure 7E, and it was found that across all samples, B57-, E-, and dual-CD8s were enriched for the TEM phenotype, although the latter tended to have less of this phenotype (Figure 7J).
Discussion
These studies demonstrate primarily that HIV-specific (Gag-KF11) αβ CD8s can cross-recognize HIV antigen across HLA-Ia and HLA-E. This was demonstrated using two approaches — in vitro AIM-based sorting and 10x Genomics platform-based transcriptional analysis — which identified TRAV5 TRBV19 family clonotypes overlapping in B57- and E-CD8s, primarily in controllers. The same clonotypes identified here also overlapped with antigen-specific and high-affinity TCRs previously identified in tetramer-based sorting within the same cohort (14, 15). In those studies, the TRAV5 TRBV19 clonotype was observed to be specific for KF11, though only through HLA-B57, further confirming the validity of our assays and sorting methods (16). In our work, we determined that the TCRs identified through these different assays all had the capacity to be cross-restricted by HLA-B57 and HLA-E*01:01 through a Jurkat NFAT-luciferase–based reporter assay, with an enhanced level of cross-restriction observed through the use of our 10x-based VCR-Seek pipeline to identify antigen-specific TCRs. In particular, one clonotype (Gp2x2) was found to have high avidity for KF11 across all 3 HLAs (26-, 11-, and 6-fold change for B57-, E01-, and E03-KF11, respectively). In comparison with controller and ART+ NC clonotypes, the 3 non-controller clonotypes tested demonstrated overall lower avidity for KF11 across all 3 HLA alleles, suggesting lower cross-restriction capacity. However, true dual restriction of the same CD8 requires multimer-based ex vivo detection, which we developed. Upon performing of these assays, this dual restriction was confirmed only in controllers and elite controllers. Counterintuitively, ex vivo dual restriction displayed relatively low frequency only among controllers, despite the high number of in vitro–activated TCRs confirmed to have dual affinity through Jurkat screening. This disconnect may be explained when considering that only a few TCRs displayed extremely high cross-restricted affinity (such as Gp2x2), which may suggest that only the highest-avidity (and most antigen-specific) CD8s are cross-restricted.
Despite the small sample size, our data suggest that in some controllers there is cross-recognition of HIV-1 across HLA-Ia and -E. It is known that HIV-1 downregulates HLA-Ia through mechanisms mediated by Nef and perhaps Vpu (17–19). This process has been well characterized as a way for the virus to escape and evade T cell–mediated immune responses. As the founder virus adapts and downregulates HLA-Ia in an infected individual, HLA-E expression remains unaffected. This may therefore allow HLA-E to present the same epitope to the subset of CD8s that would recognize HLA-Ia–restricted HIV-1 epitopes. Although the primary purpose of continued HLA-E expression on an HIV-infected cell is to evade the innate NK cell clearance (20), it may also contribute to maintaining the adaptive CD8^+^ T cell response.
A combination of low affinity of HLA-E for the peptide and low affinity of the KF11/HLA-E complex for the TCR (21–25) could help explain the functional differences that were observed when HLA-E–restricted and HLA-B57–restricted CD8^+^ T cell responses were compared,\ though some unique cytokines were found to be enriched in E-CD8s (IL-27, RANTES, IP-10). Although HLA-E–restricted CD8^+^ T cell responses were low in frequency, they were consistently detected in all 7 PWH who exhibited positive KF11-specific responses by ELISPOT. Notably, dually restricted responses were observed in 3 of these 7 individuals. Thus, despite the small sample size, our ability to identify such responses ex vivo via dextramer staining represents an important finding in the context of PWH, as most prior HIV-specific HLA-E responses have been studied using CD8s primed from naive donors. Thus, our data provide a foundational framework for future identification of HLA-E–restricted CD8s specific for new epitopes in PWH using assays and reagents recently developed by our group and others (5, 6, 26–28).
A small sample size precludes our ability to correlate targeting of HLA-E–restricted CD8s and viral control, and future studies in larger PWH cohorts are needed to determine the functional significance of HLA-E–restricted low-avidity CD8s. Prior studies have shown that despite low avidity, CD8^+^ T cell responses induced in response to classical HLA-Ia alleles can play an important role. Specifically, such T cell responses, often subdominant, can respond to antigen stimulation, proliferate, support the expansion of higher-affinity CD8s, and recognize a broader range of viral variants, to mitigate viral escape (29–33).
To date, HIV-specific E-CD8s have been described for 4 epitopes (3 in Gag and 1 in Rev) (5, 6, 34), so these responses may appear to be rare in PWH. However, these epitopes were identified based on labor-intensive detection methods such as coculture-based assays and CD8^+^ T cell priming from HIV-naive donors. Large-scale studies to detect E-CD8 responses to these 4 epitopes across a PWH cohort with varying levels of viral control off ART have not been performed to determine their prevalence and biological relevance, as these epitopes generally have much lower affinity for HLA-E than VL9 (9, 21, 22, 24, 28). Use of approaches to enhance peptide/HLA (pHLA) and pHLA/TCR avidity interaction (35–40) will allow more comprehensive studies to be performed on pathogen-specific E-CD8s. Similarly, recent advances in the field (5, 6, 26–28, 41) in the refining of peptide motifs for HLA-E epitopes, HLA-E binding predictions, use of cell-based stabilization assays, and the development of monomer binding–based multimer assays have the potential to improve the identification and characterization of new epitope-specific E-CD8s in the context of HIV infection. Considering the low magnitude of HLA-E responses observed in our data, future studies examining functional aspects of E-CD8 responses may also be greatly improved by the use of single-cell-based cloning of antigen-specific E-CD8s in combination with dextramer staining–based sorting to enrich for high-magnitude responses. Despite our small cohort, the fact that 7 of 7 tested PWH with an immunogenic response to KF11 demonstrated E-CD8 recognition if KF11 ex vivo also suggests that with an assay based on more sensitive dual HLA class I detection, HIV-1-specific E-CD8s may be more common than previously assumed. Our results based on a single epitope examined in a cohort with a small sample size limit the generalizability of our study. Nevertheless, CD8s capable of recognizing the same peptide presented by HLA-B*57 and HLA-E represent a finding with important implications for T cell immunity to a variety of pathogens besides HIV.
We also found that in each HLA-restricted context, E- and B57-CD8s demonstrate distinct functionality at the secretomic (Luminex), transcriptional (scRNA-seq), and cell surface marker (flow cytometry) levels. In our study, RANTES, IP-10, and IL-27 were observed to increase in an HLA-E–restricted and antigen-specific manner, while the more classical CD8 cytokines were observed in the B57-specific response, including IFN-γ, TNF-α, MIG, IL-6, MIP-1β, IL-2, and IL-9. In addition, 2 of 3 E-CD8 and 4 of 7 B57-CD8 cytokines were confirmed to be transcribed by the appropriate HLA-restricted CD8 subsets in coculture assays based on scRNA-seq data. Although previous studies have shown that transcriptomic and proteomic data can often be discordant as a result of differences in assay methodologies and cellular activation states (42–44), many of our proteomic findings (2 of 3 E-CD8 and 4 of 7 B57-CD8 cytokines observed to be secreted) also exhibited elevated expression at the transcriptional level. This demonstrates a notable concordance between data obtained from 2 distinct assays. E-CD8s also demonstrated a lower exhaustion profile than B57-CD8s in the context of KF11-specific responses, consistent with this distinction. Lastly, multiply-restricted activated CD8s identified in in vitro experiments were found to have higher metabolic transcriptional signatures by Gene Ontology analysis, similarly consistent with the finding that they are functionally distinct despite their cross-restriction. However, both E- and B57-CD8s are primarily TEM or TEMRA, consistent with previous studies on the memory state of E-CD8s in CMV and Mtb (45–47) and supporting the finding that E-CD8s and B57-CD8s are an overlapping subset of CD8s specific for the same antigens. Also consistent with previous studies was the secretomic profile of the cytokine classes observed from E-CD8s. While they were mainly observed to secrete IL-27 and RANTES (antiviral chemokines), they secreted various other non-cytotoxic and helper cytokines alongside B57-CD8s, such as IL-2, which has been previously documented for E-CD8s (48, 49).
Study of cross-restricted CD8^+^ T cell priming is crucial in the design of an effective HIV-1 vaccine. A recent study on clonotypes induced by an Ad5 HIV vaccine closely examined the repertoire of 3 B57 elite controllers/long-term non-progressors (EC/LTNPs) and 3 B57 vaccine recipients (50). Three of the four clonotypes obtained from the EC/LTNP group included TRAV5-TRBV6-1 and TRAV5-TRBV7-9, which map to our clusters 5 and 6, the “tri-restricted” clusters identified in controllers and the ART+ NC. However, the dominant clonotype identified in the HIV vaccine recipients was TRBV20-1, which belongs to cluster 1, an ART-naive non-controller cluster in our current study. This suggests a potential reason why prior vaccine trials that induced CD8s failed to impact infection or disease progression, as they appeared to elicit clonotypes associated with ART-naive non-controllers. Furthermore, this study indicated that the vaccine drove insufficient clonal selection, potentially eliciting the “wrong” antigen-specific clonotypes associated with non-controllers, rather than the tri-restricted, efficacious CD8^+^ TCR clonotypes identified here as associated with control. Additionally, the main finding of that study was that the TCRs elicited in vaccinated participants had low affinity. Our current findings support this, suggesting that these low-affinity CD8s are unlikely to cross-recognize epitopes presented by HLA-E, which may have negatively affected vaccine efficacy. Our in vitro assays further confirmed that the TCRs identified from the non-controllers also exhibited similarly low affinity.
Prior work based on bulk RNA sequencing analysis showed that in the context of SIV vaccine–induced MHC-E-CD8s, an IL-15 response uniquely distinguished macaques in which the establishment of infection was prevented (13). Among antigen-specific CD8s specific for KF11, we similarly observed a cluster of activated, antigen-specific dually restricted E03/B57-CD8s demonstrating a similar IL-15 signaling pathway transcriptional signature. In the previous study it was not possible to determine which cell types were responsible for secretion of IL-15. Here, we determined that this transcriptional signature emanated from dually restricted B57- and E-restricted CD8s that were both responding to (IL15RA, various downstream TCR stimulation markers) and producing IL-15.
To the best of our knowledge, our study is the first to identify ex vivo–based E-CD8 responses in PWH by using multimer-based technology as well as to detect dually HLA-B57– and -E–restricted CD8s. However, the question remains of whether observed differences in functionality are due to weaker TCR signaling on E-CD8s in comparison with B57-CD8s. First, while the frequency of E-CD8s observed ex vivo may be relatively low, prior studies have shown that they can secrete a range of cytotoxic and helper cytokines, including IFN-γ, TNF-α, IL-2, IL-4, and IL-13, which can promote proliferation and regulation of B and T cell subsets in a Th2-like capacity (47, 49, 51). Consistent with these reports, we identified IL-27 and RANTES expression in E-CD8s, both of which have demonstrated antiviral properties against HIV-1 through coreceptor blockade or inhibition of virion production and cell-to-cell spread (52, 53). Together, these observations suggest that HLA-E–restricted responses, while not necessarily functioning as primary cytotoxic effectors, may play complementary regulatory and antiviral roles that contribute to the overall immune response to HIV. Future studies aimed at further elucidating the role of HLA-E–restricted CD8s could incorporate approaches such as the generation of CTL clones or the use of dextramer-sorted cells, which would provide cleaner readouts by minimizing potential confounders in functional assays. The application of tagged multimers, including dextramer technology, in combination with single-cell transcriptional and functional analyses will allow a more rigorous assessment of mono- and dual-restricted TCRs in larger cohorts. The analytical pipelines and molecular techniques developed here will therefore enable future studies aimed at determining the prevalence of E-CD8s and dual-CD8s within different states of viral control.
Methods
Further information can be found in Supplemental Methods.
Sex as a biological variable
Sex was not considered as a biological variable in this study owing to limited sample availability.
Study cohort
All participants were recruited at Vanderbilt University, Nashville, Tennessee. PBMCs were collected by leukapheresis from 8 people living with HIV (PWH) who expressed HLA-B*57. HIV clinical status was determined based on plasma viral load at the time of sample acquisition (>2,000 RNA copies/mL for non-controllers [NC], <2,000 copies/mL for controllers [C], and <50 copies/mL for elite controllers [EC], and one ART+ NC). The clinical and HLA genotyping data are shown in Supplemental Table 1.
Cell lines
Parental 721.221 or transduced 721.221 cell lines, a gift from Jun Kan-Mitchell (University of Texas at El Paso, El Paso, Texas, USA), first had HLA-E expression knocked out at a site in the first exon to generate the 41A3 cell line, before transduction of CD4 and either HLA-B57:01, HLA-E01:01, or HLA-E*01:03 to generate the 41A3.CD4.[B57, E01, or E03] cell lines (5). These cell lines were cultured in R-20 (20% FBS in RPMI 1640 supplemented with penicillin/streptomycin, l-glutamine, HEPES, and sodium pyruvate) and assessed for cell surface HLA expression of the various HLA molecules and CD4 via flow cytometry.
Peptide
The KF11 peptide (KAFSPEVIPMF, Gag [162–172]) as well as other control peptides DENV-HF9 (HTWTEQYKF, NS1 [26–34]), RVF-VT9 (VLSEWLPVT, N [121–129]), HIV-RL9 (RMYSPTSIL, Gag [275–283]), Mtb-RL9 (RLPAKAPLL, InhA [53–61]), SIV-TH9 (TVCVIWCIH, Gag [33–41]), and human A02-VL9 (VMAPRTLVL, HLA-A02 leader peptide) were purchased from Genscript, reconstituted in 100% DMSO, and stored at –80°C until use. HIV-1 Gag, Nef, and Pol overlapping peptide pools were obtained from the NIH AIDS Reagent Program (catalog ARP-8117, -12545, and -12438, respectively). Peptide pools were used at 1 μg/mL and single peptide was used at 10 μg/mL, unless otherwise specified. Single peptides used for monomer and multimer assays were used at 100 mg/mL.
IFN-γ ELISPOT
IFN-γ enzyme-linked immunosorbent spot-forming assay (ELISPOT) screening of samples for previously described HLA-B*57–restricted HIV-1 epitopes including KF11 was performed as previously described (5, 54, 55). In brief, cryopreserved samples were thawed in R-10 medium (RPMI 1640 base plus streptavidin/penicillin, l-glutamine, and HEPES), and PBMCs were allowed to rest at 37°C overnight. Nitrocellulose plates (MilliporeSigma) were coated with 10 μg/mL anti–IFN-γ monoclonal antibody overnight at 4°C, and excess uncoated antibody was washed off before wells were blocked with 200 μL R-10 for 2 hours at 37°C. R-10 was discarded, and then PBMCs were plated in duplicate wells at 100,000 cells per well in 100 μL each before antigen was added in 100 μL for a final concentration of 10 μg/mL of single antigen per well. PBMCs incubated with no antigen or phytohemagglutinin were used as negative and positive controls, respectively. After about 18–24 hours, wells were washed and incubated with biotinylated anti–IFN-γ antibody for 2 hours, washed again and incubated with streptavidin–alkaline phosphatase for 1 hour, then developed with NBT/BCIP substrate for 5–10 minutes. The CTL ImmunoSpot analyzer (version 5; CTL) was used to count raw spots per 1 × 10^5^ cells, which was normalized to spots per 1 × 10^6^ cells (SFU per 1 × 10^6^ cells). A positive response was defined as one that was at least 55 SFU per 1 × 10^6^ cells and 4 times background (DMSO).
Coculture assay
The dual CD69/CD137-positive response to HLA-expressing lines pulsed with KF11 was compared with that of the HLA-null parental line (721.221ΔE.E) pulsed with KF11 (Supplemental Figure 3, A and B). The activated population was compared in the CD4/14/16/19/56^–^, CD8^+^ CD3-dim population, as CD8^+^ T cells downregulating CD3 and CD8 coreceptors have been shown to be more antigen specific and higher-avidity (56–60), and thus are a better indicator of an HLA-restricted antigen-specific response in the cell line–dependent co-incubation system where nonspecific activation is commonly observed. Those donors who demonstrated a CD69^+^CD137^+^ response in this subset that was 3 times over the 41A3.CD4 null line response and significant by Fisher’s exact t test (P < 0.0001) were identified as demonstrating a high-avidity HLA-restricted response to KF11.
Ex vivo activation–based single-cell sorting and 96-well plate scRNA/TCR sequencing.
Assays were done as previously described (5) with the following alterations. Initially, the specified cell lines (41A3.CD4, 41A3.CD4.B57, 41A3.CD4.E01, 41A3.CD4.E03) were pulsed with KF11 peptide at 10 μg/mL for 2 hours at 37°C before peptide was washed off with 1× serum-free medium. CD8s were then isolated from PBMCs using the StemCell Easy-Sep CD8 Enrichment kit (catalog NC0050243) and co-incubated with peptide-pulsed cell lines as indicated for 18 hours in the presence of anti-CD28 and anti-CD49d. Cells were then stained with the sorting antibody mix (Supplemental Table 2). Per the gating strategy shown in Supplemental Figure 1A, single-cell lymphocytes were gated on, followed by live cells (aqua^–^), CD4/dump^–/–^, CD8^+^ CD3-dim, and CD69^+^CD137^+^. Cells that fit this gating strategy and met the criteria of having a CD3-dim activated response to the given HLA pulsed with KF11 significantly (and 3 times) higher than that of 41A3.CD4 cells also pulsed with KF11 were then sorted into a 96-well plate containing the lysis buffer previously described using the FACSAria II cell sorter (BD Biosciences). scTCR-seq and scRNA-seq were performed as previously described (5, 55, 61, 62).
10x sample preparation.
CD8s from 3 PWH, one from each control status (n = 1 NC, ART+ NC, and C) of the previous n = 8 cohort, were cocultured with CD8s as described for that set of experiments. These cocultures were performed in wells of a 24-well plate per instructions of the Flow Cytometry and Single Cell Core at the University of Alabama at Birmingham. After 18 hours of co-incubation, cells were washed and first stained with Hashing antibodies 1–10 (C0251–C0260) from BioLegend (catalog number of C0251 is 394661 for reference to set) per manufacturer instructions after initial titration of both hashtagging antibodies (data not shown). After washing off, cells were stained using the same panel as previously outlined in addition to the following CITE-seq antibodies with the exact same staining protocol: TotalSeq-C anti-CD3, -CD4, -CD8, -TCRαβ, -CD56, -CD69, -CD137, -CD107a, -PE, -APC, -FITC, -CD45RA, -CD45RO, and -CCR7. Unactivated (CD69^–^CD137^–^) CD56^–^ CD8^+^ cells from the unstimulated CD8s (no KF11 loading for 41A3 lines or pulse for PBMCs) as well as both unactivated and activated CD8s from stimulated conditions were sorted using the BD Biosciences FACSymphony S6 cell sorter into a single tube, and multiplexed for all 10 samples for 1 of the 3 PWH per day. Libraries from these cells were then generated on that same day for RNA expression (gene expression), TCR, and CITE-seq, and then these separate hashtagged libraries were all sequenced on the Illumina NovaSeq using an S1 flow cell to cover 1.6 billion reads across the estimated 22,172 cells sorted after manual quality control before library generation. Specifically, cell suspension, 10x Genomics barcoded gel beads, and oil were loaded into 10x Genomics Chromium Single Cell Chip K (PN-1000287). Chromium Next GEM Single Cell 5′ v2 Kit (PN-1000263) was used to capture single cells in nanoliter-scale oil droplets by 10x Genomics Chromium Controller and generate Gel Bead-In-Emulsions (GEMs). The 5′-biased gene expression, TCR, and feature barcoding libraries were generated following the manufacturer’s instruction. All libraries were sequenced by an Illumina NovaSeq 6000 machine, targeting 20,000 read pairs per cell for gene expression libraries, 20,000 per cell for TCR libraries, and 5,000 per cell for feature barcoding libraries; the sequencing cycles consisted of 26 bp for read 1, 90 bp for read 2, and 10 bp for i7 and i5.
TCR clustering analysis
Initial clustering analysis was performed as previously described (5), except that the newest release of TCRdist (TCRdist3) was used (https://github.com/kmayerb/tcrdist3) (63). TCRdist performs pairwise assessments of TCR sequences based on their amino acid similarity in complementarity-determining regions (CDRs) 1, 2, and 3. Initial Hamming distances were calculated and distance matrices were generated using the available Python package in R (reticulate package, https://rstudio.github.io/reticulate/). Distance matrices for the complete dataset (with associated metadata) were visualized using Cytoscape (v3.10) (64). Metadata linked with individual TCR clonotypes were used to associate each clonotype (or cluster) with HLA restriction, HIV control status, or stimulation state based on other analyses.
Luminex assay and analysis
The Luminex assay was performed using the MagPix instrument running xPONENT software (Luminex Corp.) in collaboration with Davide Botte of the Lund lab (University of Alabama at Birmingham, Birmingham, Alabama, USA). Readouts were analyzed with EMB Millipore’s Milliplex Analyst Software. A custom 38-plex human cytokine/chemokine panel was used for this assay (catalog HCYTA-60K-PK38) for the following cytokines: EGF, CCL11, G-CSF, GM-CSF, IFN-α2, IFN-γ, IL-1α, IL-1β, IL-1RA, IL-2, IL-3, IL-4, IL-5, IL-6, IL-7, IL-8, IL-10, IL-12 p40, IL-12 p70, IL-13, IL-15, IL-17A, IL-17E, IL-17F, IL-18, IL-22, IP-10, MCP-1, M-CSF, MIG, MIP-1α, MIP-1β, PDGF-AA, PDGF-AB/BB, RANTES, TNF-α, LTA, VEGF-A. The samples assayed were 200 μL supernatants from HLA-null or -overexpressed 41A3.CD4 cell lines loaded with either no peptide or KF11 and cocultured with isolated CD8s from leukapheresis samples of PWH at various control states. The supernatants were initially spun down to exclude cell debris and then stored at –80°C until the time of the assay. Initially, raw data were quality-controlled, and any cytokine with values outside the standard curves obtained per manufacturer recommendation were excluded (only IL-17F, which was below the limit of detection). Raw MFI signal values for each sample for each cytokine were compared with the standard curves to generate pg/mL values through the proprietary analysis software Quantist (Bio-techne; https://www.bio-techne.com/reagents/luminex/luminex-software-quantist). Values for each donor sample were then normalized to the 41A3.CD4-KF11 pulse coculture condition value of that sample as the optimal negative control for a non-HLA-restricted non-allogeneic response. These normalized values were then analyzed initially through GraphPad Prism for direct pairwise comparisons. All response magnitudes were then visualized through JMP (SAS Institute Inc.) alongside statistically significant pairwise ANOVA comparisons. To analyze these data, a 2-way ANOVA was first performed on both the unstimulated and HLA-KF11 response replicates between HLA-B57 and -E01:01 or -E01:03 as normalized to HLA-null line–KF11 background pg/mL. Those cytokines for which HLA restriction as a categorical variable explained a significant (P < 0.05) amount of the quantitative variation in concentration of the listed cytokine (pg/mL) in the 2-way ANOVA or which demonstrated a significant increase in only HLA-B57 or E*01:01/03 conditions were identified. Determinant analysis and canonical clustering were also performed through JMP using available metadata under “Analysis” > “Multivariate methods” > “Discriminant,” with each individual cytokine for all HLA-dependent conditions given as a covariate numerical value and grouped by that condition. Individual cytokines that were shown to demonstrate a significant increase in response between HLA-B57 and either E condition were then represented through Prism.
TCR reporter cell assay
The in vitro function of selected TCR clones was assessed using a luciferase reporter cell assay, as described previously (10). Briefly, TCR α and β sequences obtained from single-cell data were reconstructed as full-length, codon-optimized cDNA products and synthesized as gBlocks gene fragments (Integrated DNA Technologies). TCR genes were cloned into the eukaryotic expression vector, pSELECT-GFPzeo (InVivoGen). Jurkat effector T cells were prepared by cotransfection with plasmids encoding the TCR α/β clone of interest along with a plasmid expressing the CD8α protein (pORF9-hCD8A, InVivoGen) and a reporter plasmid encoding firefly luciferase driven by a minimal nuclear factor of activated T cells–responsive (NFAT-responsive) promoter (pNFAT-luc, Agilent Technologies). Target cells expressing single HLA molecules (41A3.CD4.[B57, E01, or E03], described above) were pulsed with KF11 peptide (10 μM), or left as unpulsed controls, and then cocultured with Jurkat/TCR^+^ effector cells at an effector/target cell ratio of 2:1. After 6–8 hours, the luciferase activity in cocultures was measured using the SteadyGlo reagent (Promega).
Peptide exchange and ELISA
7MT2 UV-labile VL9 “J” VMAPJTLVL peptide–loaded pHLA-E monomer was provided by the NIH Tetramer Core Facility (NIH Contract 75N93020D00005 and RRID:SCR_026557) located at Emory University, Atlanta, Georgia. Peptide exchange was performed in a modified form from what has been previously described (9, 22, 23, 27). Following various optimization experiments, the protocol for this assay was optimized as follows. Initially, ELISA high-binding plates were coated with 10 μg/mL purified anti–HLA-E antibody (3D12, catalog 342602, Biolegend) overnight at 4°C in coating buffer (catalog NC0130210, Biolegend). After initial overnight coating at 4°C, another overnight blocking with 2% IgG BSA (catalog 12-662-550ML, MilliporeSigma) was performed. The following day, peptide exchange was performed in wells of a non-binding V-bottom plate covered with a plate heat shield cover. Each 125 μL reaction contained 121.5 μL of peptide exchange buffer, 1.5 μL stock monomer (3 μg 7MT2, stored at 80°C), and 2 μL query peptide (200 μg). Peptide exchange buffer stock was generated using 1 mL 1 M Tris-HCl (pH 8) (catalog AAJ22638AE, Thermo Scientific), 842.64 mg l-arginine monohydrochloride (11-101-2479, MilliporeSigma), 40 μL 0.5 M EDTA (MT-46034CI, Corning), 15.4 mg reduced glutathione (AC120000050, Thermo Scientific), 3 mg oxidized glutathione (MP021511935, MP Biomedicals), 8.1 mL ddH_2_O, and one peptidase inhibitor cOmplete EDTA-free tablet (11873580001, Sigma Aldrich). Each reaction was gently mixed with a pipette and then UV-irradiated (365 nm) for 3 hours at room temperature. The coated/blocked ELISA plate was then washed as previously described (9) and incubated with 50 μL (1:100) of peptide-exchanged reaction mix for 1 hour. This was carried out at 37°C as previously described to enhance binding and destabilize low-affinity interactions (65). After washing, 50 μL primary antibody (1:500; anti-β2M, catalog R0202-1D, Thermo Scientific) was incubated on the plate for 30 minutes at 4°C, then, after another round of washing, 50 μL secondary antibody (1:500; anti-rabbit–HRP, catalog NB7160, Novus Biologicals) for 15 minutes at room temperature in the dark. Finally, the plate was washed again, and 100 μL TMB substrate (catalog PI37574, Thermo Scientific) was added for 10 minutes (or until sufficient development) before addition of 100 μL ELISA Stop Solution (catalog PIN600, Thermo Scientific). Corrected A450 values (– background A650) were transformed as follows. TMB substrate and Stop Solution was added by row, and so corrected A450 values for each row were normalized separately between 0 [7MT2 (– control) no peptide condition] and 1 [A*02 VL9 (+ control) peptide exchange] with the following calculation:
For HLA-A02 and HLA-B57, DENV-HF9 (Dengue virus HF9) and RVF-VT9 (Rift Valley fever virus VT9) were used as irrelevant (+) control peptides known to bind HLA-B57 and -A02, respectively, and as (–) controls for TCR specificity in a cohort in a region to which Dengue virus and Rift Valley fever are not endemic. We additionally used HLA-A02–derived VL9 peptide as the positive control for HLA-E01:01 or -E*01:03 monomer exchange rate.
Multimer construction
Again, 7MT2 UV-labile VL9 “J” VMAPJTLVL peptide–loaded pHLA-E monomer was provided by the NIH Tetramer Core Facility (NIH Contract 75N93020D00005 and RRID:SCR_026557) located at Emory University. Stable post–peptide exchange pHLA-E monomers were tetramerized per NIH Tetramer Core Facility general guidelines. An unbiased saturation strategy was used. Specifically, immediately after results of ELISA or the following day, 50 μL of reaction mix was transferred to two 1.5 mL microfuge tubes. 2.4 μL or 1.3 μL of 0.2 mg/mL streptavidin-PE or -APC, respectively, was added to either tube and the process repeated 5 times every 10 minutes, to fully saturate any available stable pHLA-E monomer. Alternatively, dextramer was assembled per Immudex dextramer construction guidelines. PE and APC Klickmers used for initial testing and optimization were provided by Immudex ApS. HLA-A02 and HLA-B57 monomers used for initial testing were also provided by ImmunAware ApS.
Multimer staining
Multimer staining (both tetramers and dextramers) was performed as recently described for HLA-E–restricted SARS-CoV-2 (27). In brief, PBMCs were thawed as previously described (5) and incubated with 1 μL per test Fc Block (BD Biosciences) (to prevent FcR-mediated binding) and 1 μL per test dasatinib (to make TCR more bioavailable for recognition) for 5 minutes before washing off. Tetramer or dextramer staining was then performed for 3 hours at room temperature in the dark. For each pool in the case of dual HLA-E01– and HLA-B57–restricted multimer staining, 2 μL of 20 μM d-biotin was also added during pool construction to prevent nonspecific streptavidin binding. After another 3 washes, cells were then stained with the multimer staining mix (Supplemental Table 3).
Tetramer staining.
PE and APC tetramers were generated and used to stain at 1:100 dilution in FACS-Wash (made in-house; PBS: Corning, FBS, GeminiBio) as described above.
Dextramer staining.
PE Klickmers (catalog NC1685800) were generously provided by Immudex ApS for initial optimizations and tests. Before dextramerization, a peptide exchange was performed. The amount of monomer to add was calculated for PE Klickmer based on estimation of 20 acceptor sites filled and micromolarity of pHLA-E-Mtb14 (structure 7P49) (23). One hundred microliters of diluted dextramers was added immediately after dextramerization per Immudex protocol.
Klickmer PE.
Staining of samples was performed as described above.
Statistics
Luminex pairwise 2-way ANOVA and 2-tailed t test significance testing as well as Fisher’s exact tests used for flow cytometry analysis were performed using GraphPad Prism version 8.0 software. Differentially expressed gene significance testing was performed using the MAST test through Seurat as described in the package documentation.
Study approval
This study was approved by the Vanderbilt University Medical Institutional Review Board, and all subjects provided written informed consent (IRB 030005).
Data availability
All transcriptomic and CITE-seq proteomic data were deposited in the NCBI’s Gene Expression Omnibus database (GEO GSE306022 and GSE306023). Specific analysis files and other data are available upon request. All supporting data shown in graphs are available in the Supporting Data Values file.
Author contributions
AB, PAG, and KJM conceptualized and designed the study. KJM, AKO, HSH, ZD, MAR, AC, and RW conducted experiments and/or curated data. KJM conducted formal data analysis and statistics. SAK provided clinical specimens. PAG and AB acquired funding. PAG, AB, and MAB supervised the study. KJM, AB, and PAG wrote the manuscript. All authors reviewed and edited the manuscript.
Funding support
This work is the result of NIH funding, in whole or in part, and is subject to the NIH Public Access Policy. Through acceptance of this federal funding, the NIH has been given a right to make the work publicly available in PubMed Central.
NIH grant R01-AI162168-04 (to AB and PAG).University of Alabama at Birmingham (UAB) Center For AIDS Research, an NIH-funded program (P30-AI027767).Supported by the NIH through the T32 training program (T32-AI7051-47).
Supplementary Material
Supplemental data
Supporting data values
The reference list from the paper itself. Each links out to its DOI / PubMed record.
- 1Hansen SG et al Myeloid cell tropism enables MHC-E-restricted CD 8+ T cell priming and vaccine efficacy by the Rh CMV/SIV vaccine Sci Immunol 2022772 eabn 930110.1126/sciimmunol.abn 930135714200 PMC 9387538 · doi ↗ · pubmed ↗
- 2Hansen SG et al Broadly targeted CD 8+ T cell responses restricted by major histocompatibility complex E Science 2016351627471472010.1126/science.aac 947526797147 PMC 4769032 · doi ↗ · pubmed ↗
- 3Voogd L et al Antigen presentation by MHC-E: a putative target for vaccination?Trends Immunol 202243535536510.1016/j.it.2022.03.00235370095 PMC 9058203 · doi ↗ · pubmed ↗
- 4Sharpe HR et al HLA-E: exploiting pathogen-host interactions for vaccine development Clin Exp Immunol 2019196216717710.1111/cei.1329230968409 PMC 6468186 · doi ↗ · pubmed ↗
- 5Bansal A et al HLA-E-restricted HIV-1-specific CD 8+ T cell responses in natural infection J Clin Invest 20211311614897910.1172/JCI 14897934228645 PMC 8363272 · doi ↗ · pubmed ↗
- 6Yang H et al HLA-E-restricted, Gag-specific CD 8+ T cells can suppress HIV-1 infection, offering vaccine opportunities Sci Immunol 2021657 eabg 170310.1126/sciimmunol.abg 170333766848 PMC 8258078 · doi ↗ · pubmed ↗
- 7Wallace Z et al Instability of the HLA-E peptidome of HIV presents a major barrier to therapeutic targeting Mol Ther 202432367868810.1016/j.ymthe.2024.01.01038219014 PMC 10928138 · doi ↗ · pubmed ↗
- 8He W et al Intracellular trafficking of HLA-E and its regulation J Exp Med 20232208 e 2022194110.1084/jem.2022194137140910 PMC 10165540 · doi ↗ · pubmed ↗