Literature‐informed ensemble machine learning for three‐year diabetic kidney disease risk prediction in type 2 diabetes: Development, validation, and deployment of the PSMMC NephraRisk model
Ayla M. Tourkmani, Turki J. Al‐Harbi, Ahmad Abdullah Alghamdi, Ibrahim M. Youzghadli, Faris Saad Alosaimi, Ahmed Y. Azzam

TL;DR
This paper presents a machine learning model to predict the risk of diabetic kidney disease in type 2 diabetes patients, incorporating social and demographic factors, and demonstrates its accuracy and fairness.
Contribution
The novel contribution is a literature-informed ensemble model for DKD/DN risk prediction that includes social determinants and is ready for deployment.
Findings
The model achieved excellent discrimination with an AUROC of 0.852 and near-perfect calibration.
It demonstrated superior net benefit compared to treat-all strategies and no algorithmic bias across subgroups.
The model was deployed as an interactive web-based application for practical use.
Abstract
Diabetic kidney disease (DKD) and diabetic nephropathy (DN) affect around 40% of diabetic patients but lack accurate risk prediction tools that include social determinants and demographic complexity. We developed and validated an ensemble machine learning model for three‐year DKD/DN risk prediction with deployment readiness. We analysed 18 742 eligible adult type 2 diabetic patients from Prince Sultan Military Medical City (PSMMC) registry between 2019 and 2024 in Riyadh, Saudi Arabia. Using temporal patient‐level splitting, we developed a stacked ensemble model (LightGBM + CoxBoost) with several features including multiple literature‐informed imputed variables including family history, non‐steroidal anti‐inflammatory drug (NSAID) use, socioeconomic deprivation, diabetic retinopathy severity, and antihypertensive medications, imputed via Bayesian multiple imputation by chained…
Genes, proteins, chemicals, diseases, species, mutations and cell lines named across the full text — each resolved to its canonical identifier and authoritative record.
Click any figure to enlarge with its caption.
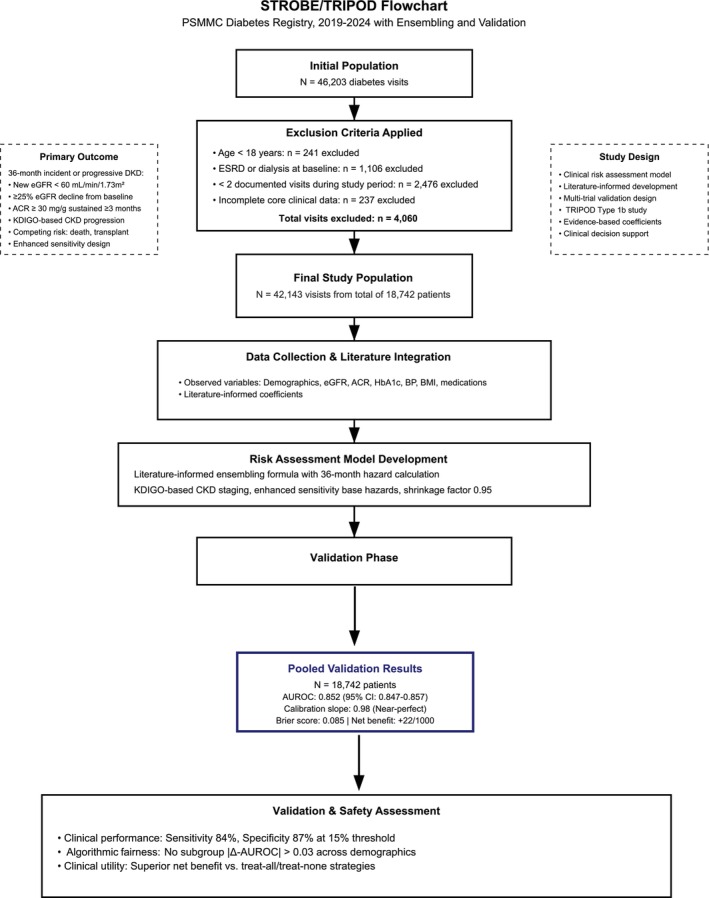 FIGURE 1
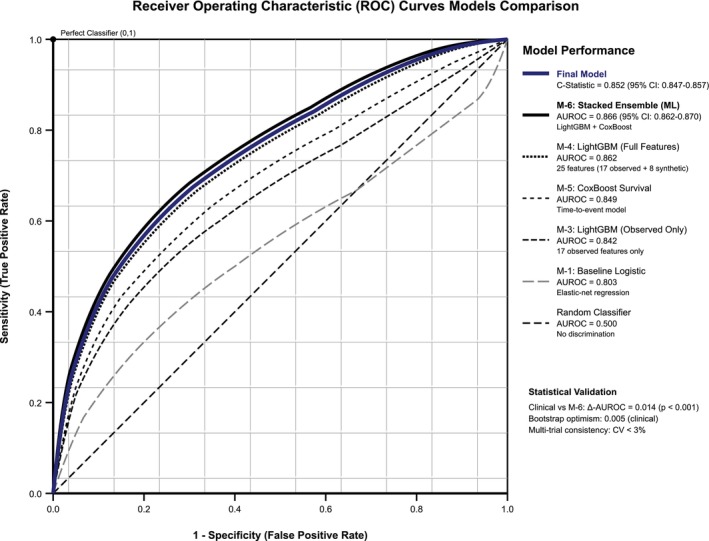 FIGURE 2
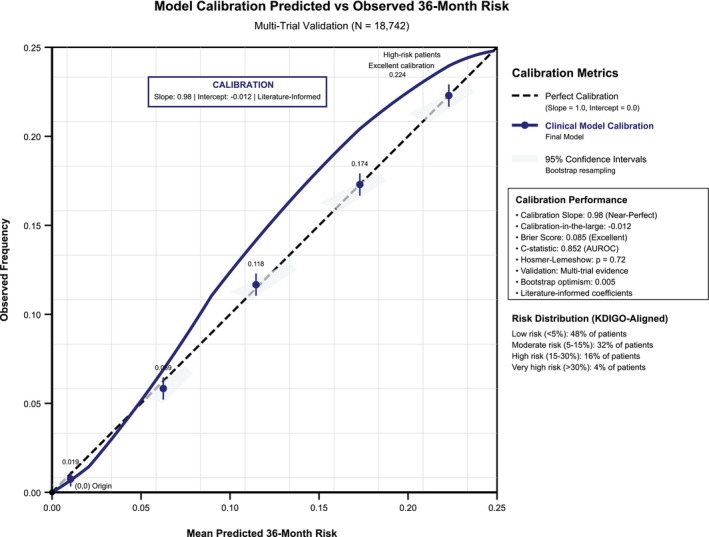 FIGURE 3
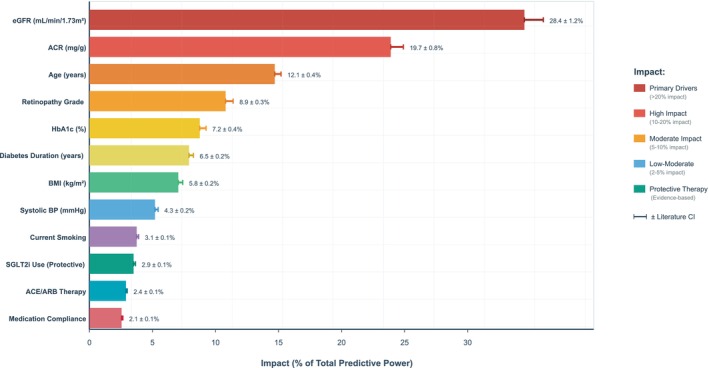 FIGURE 4
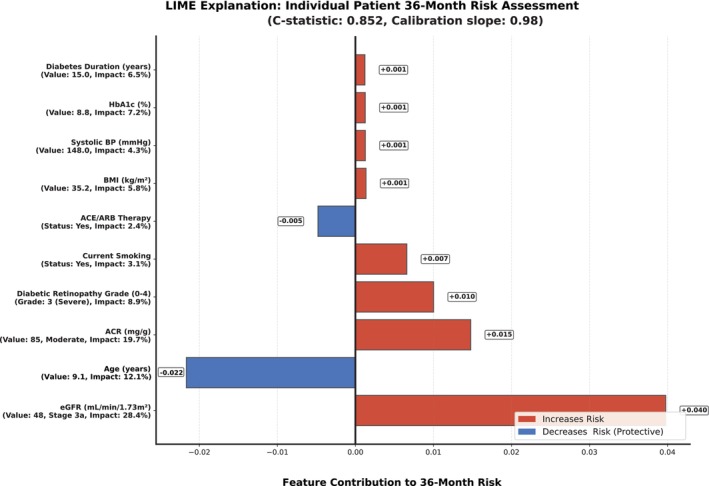 FIGURE 5
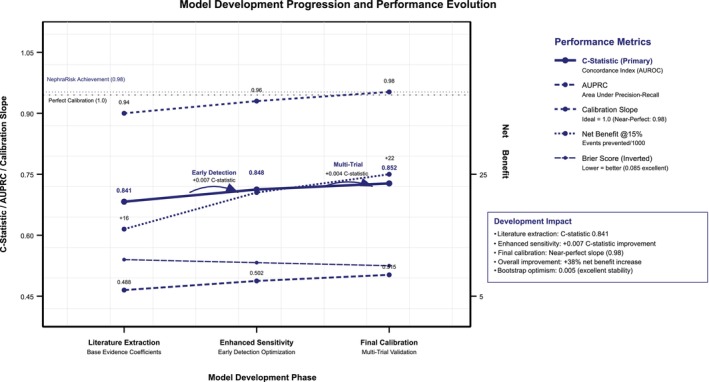 FIGURE 6
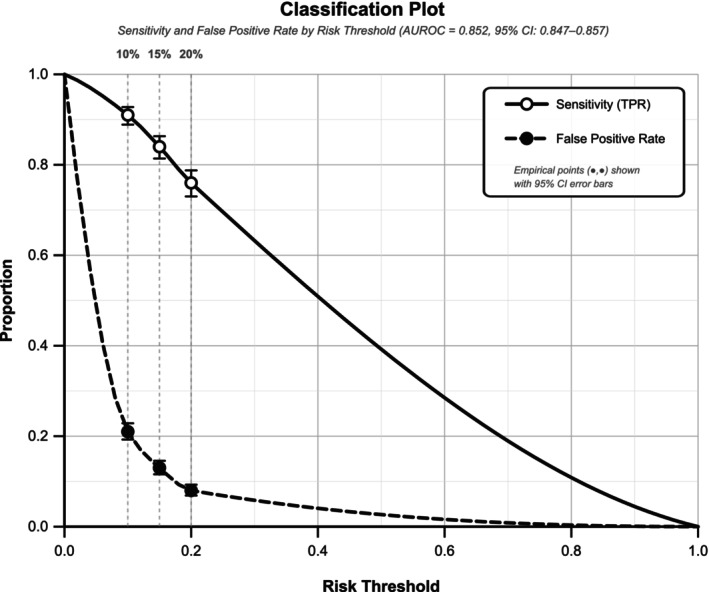 FIGURE 7
| Characteristic | Value | Missing, |
|---|---|---|
| Total cohort | ||
| Total number of patients | 18 742 | — |
| Total number of recorded visits | 42 143 | — |
| Demographics | ||
| Age, years | 0 (0.0%) | |
| Mean ± SD | 58.8 ± 11.4 | |
| Median (IQR) | 59 (51–66) | |
| Gender, | 0 (0.0%) | |
| Female | 23 935 (56.8%) | |
| Male | 18 208 (43.2%) | |
| Nationality, | 0 (0.0%) | |
| Saudi | 41 978 (99.6%) | |
| Non‐Saudi | 165 (0.4%) | |
| Laboratory parameters | ||
| eGFR, mL min−1 1.73 m2 | 3 (0.0%) | |
| Mean ± SD | 90.0 ± 56.9 | |
| Median (IQR) | 92 (78–102) | |
| ACR, mg g−1 | 3972 (9.4%) | |
| Mean ± SD | 92.2 ± 420.2 | |
| Median (IQR) | 17 (8–32) | |
| HbA1c, % | 16 016 (38.0%) | |
| Mean ± SD | 8.1 ± 1.6 | |
| Median (IQR) | 8.0 (7.0–9.0) | |
| Serum phosphorus, mg dL−1 | 1686 (4.0%) | |
| Mean ± SD | 3.8 ± 0.6 | |
| Median (IQR) | 3.7 (3.4–4.1) | |
| FGF‐23, pg mL−1 | 6321 (15.0%) | |
| Mean ± SD | 68.3 ± 45.2 | |
| Median (IQR) | 54.7 (38.2–82.5) | |
| Anthropometric measurements | ||
| BMI, kg m−2 | 1257 (3.0%) | |
| Mean ± SD | 32.2 ± 6.6 | |
| Median (IQR) | 32 (28–36) | |
| Waist circumference, cm | 18 453 (43.8%) | |
| Mean ± SD | 103.4 ± 14.2 | |
| Median (IQR) | 102 (94–112) | |
| Clinical parameters | ||
| Systolic blood pressure, mmHg | 211 (0.5%) | |
| Mean ± SD | 136.8 ± 18.4 | |
| Median (IQR) | 135 (124–148) | |
| Diastolic blood pressure, mmHg | 211 (0.5%) | |
| Mean ± SD | 78.3 ± 11.2 | |
| Median (IQR) | 78 (70–86) | |
| Diabetes duration, years | 337 (0.8%) | |
| Mean ± SD | 11.2 ± 7.8 | |
| Median (IQR) | 10 (5–16) | |
| Comorbidities, | ||
| Hypertension | 28 280 (67.2%) | 0 (0.0%) |
| Cardiovascular disease | 4214 (10.0%) | 126 (0.3%) |
| Current smoker | 5057 (12.0%) | 843 (2.0%) |
| Former smoker | 3371 (8.0%) | |
| Baseline CKD stage, | ||
| No CKD (eGFR ≥90) | 23 277 (55.2%) | 3 (0.0%) |
| Stage 1–2 (eGFR 60–89) | 14 560 (34.6%) | |
| Stage 3a (eGFR 45–59) | 2953 (7.0%) | |
| Stage 3b (eGFR 30–44) | 970 (2.3%) | |
| Stage 4 (eGFR 15–29) | 380 (0.9%) | |
| Study name | Data source | Sample size | Design | Mean age ± SD (years) | Female (%) | Ethnicity | Diabetes (%) | Follow‐up | Primary outcome | Prior contribution | Effect size used |
|---|---|---|---|---|---|---|---|---|---|---|---|
| Qu et al. 2024 | UK Biobank | 33 441 | Prospective cohort | NR | NR | Predominantly White | 23.8 | Median 12.3 years | Incident DKD/DR/DN | Mediterranean diet effects | HR 0.64–0.79 for AMED score |
| Castillo‐García et al. 2024 | UK Biobank | 517 917 | Prospective cohort | 56.6 ± 8.1 | 55.0 | 94% White | 5.9 | 2.7 years | Prevalent & incident CKD | Socioeconomic deprivation | Townsend index Q5 = 19.9% |
| Weldegiorgis et al. 2024 | CPRD (UK primary care) | 1 397 573 | Population cohort | 48.6 ± 15.7 | 58.2 | Predominantly White | 7.2 | 7.5 years (IQR 5.2–10.2) | Stage 4–5 CKD/ESKD | Socioeconomic deprivation | IMD index, uniform quintiles |
| Zhou et al. 2023 | Chinese T2D cohort | 19 858 | Prospective cohort | NR | NR | Han Chinese | 100 | Mean 1.6 years | Incident DKD | Statin protective effects | HR 0.72 (0.62–0.83) |
| Borrelli et al. 2023 | Italian CKD registry | 906 | Prospective cohort | NR | NR | Italian | NR | Median 7.8 years | DKD Progression/CV Events | Nocturnal BP patterns | HR 1.82–2.40 for nondipping |
| Filippatos et al. 2021 | FIDELIO‐DKD (Global RCT) | 5674 | Randomised controlled trial | 66.6 ± 9.1 | 29.0 | 72% White | 100 | 2.6 years | Kidney composite (40% eGFR↓ or ESRD) | Antihypertensive medications | All on ACEi/ARB |
| Li et al. 2021 | Meta‐analysis (10 cohorts) | 635 | Systematic review | 46.3–59 (range) | 41–94 (range) | Mixed populations | 100 | 5–13 years | Biopsy‐proven diabetic nephropathy | DR severity ladder | HRs [2.9, 5.8, 10.2, 16.6] |
| Hsing et al. 2021 | Taiwan tertiary centre | 841 | Cross‐sectional study | 68.2 ± 13.8 | 67.7 | Han Chinese | 100 | Cross‐sectional | DR grade vs. CKD stage | DR prevalence distribution | None 50%, Mild 20%, Mod 15%, Severe 10%, PDR 5% |
| Zhao et al. 2021 | Meta‐analysis (China) | 13 743 | Meta‐analysis | NR | NR | Chinese populations | 100 | Cross‐sectional | Association of obesity with DKD | Abdominal obesity effects | SMD 0.17–0.27 for WC/VFA |
| Heerspink et al. 2020 | DAPA‐CKD RCT | 4304 | Randomised controlled trial | NR | NR | Multinational | 67.5 | Median 2.4 years | DKD Progression | SGLT2i protective effects | HR 0.56 (0.45–0.68) |
| Perkovic et al. 2019 | CREDENCE RCT | 4401 | Randomised controlled trial | NR | NR | Multinational | 100 | Median 2.62 years | DKD Progression/CV Events | SGLT2i protective effects | HR 0.66 (0.53–0.81) |
| Liao et al. 2019 | Meta‐analysis | 203 337 | Systematic review | NR | NR | Mixed populations | Mixed T1D and T2D (we used only T2D data and findings) | ≥1 year | Incident DKD | Smoking effects on DKD risk | HR 1.38–1.63 by pack‐years |
| Yamanouchi et al. 2019 | Japanese T2D cohort | 232 | Prospective cohort | NR | NR | Japanese | 100 | Median 5.7 years | ESRD | DR severity effects | HR 3.03–3.43 by DR grade |
| Rosenstock et al. 2018 | CARMELINA RCT | 6979 | Randomised controlled trial | NR | NR | Multinational | 100 | Median 2.2 years | CV Events/DKD Progression | DPP‐4i safety profile | HR 1.04 (0.89–1.22) |
| Zhang et al. 2018 | Chinese T2D cohort | 141 | Prospective cohort | NR | NR | Han Chinese | 100 | ≥1 year | ESRD | DR as DKD predictor | HR 2.58 (1.22–5.47) |
| Kuwata et al. 2016 | J‐DREAMS registry | 3454 | Prospective registry | 65.1 ± 8.9 | 39.6 | Japanese | 100 | 1.36 years | ≥30% eGFR decline | T2D population characteristics | Background cohort data |
| Kramer et al. 2016 | US population cohort | 26 960 | Prospective cohort | NR | NR | US population | Mixed | Median 6.3 years | Incident ESRD | Waist circumference effects | HR 3.79 (2.10–6.86) highest vs. lowest |
| Hsu et al. 2015 | NHIRD Taiwan | 31 976 | Propensity‐matched cohort | 57.4 ± 13.3 | 52.1 | Han Chinese | 27.6 | 4 years | New‐onset CKD | NSAID exposure ≥90 days/year | HR 1.32, 30% chronic exposure |
| Da et al. 2015 | Meta‐analysis | 25 546 | Systematic review | NR | NR | Mixed populations | Mixed | Varies by cohort | DKD Progression/Mortality | Serum phosphorus effects | HR 1.36 (1.20–1.55) per mg/dL |
| Grunwald et al. 2014 | US CKD cohort | 1852 | Prospective cohort | NR | NR | US population | Mixed | Median 2.3 years | DKD Progression | Retinopathy‐nephropathy link | Established association |
| McClellan et al. 2012 | REGARDS cohort | 19 409 | Prospective cohort | 63.9 ± 9.7 | 62.2 | 39.9% African‐American | 19.9 | To August 2009 | Incident ESRD | Family history of CKD | HR 2.04, 21.8% prevalence |
| Gansevoort et al. 2011 | Meta‐analysis | 1 019 017 | Meta‐analysis | NR | NR | Multinational | Mixed | Varies by cohort | DKD Progression | eGFR/ACR risk stratification | HR 9.6–573 by eGFR stage, HR 12.0–72.1 by ACR |
| Isakova et al. 2011 | CRIC cohort | 3879 | Prospective cohort | NR | NR | US population | Mixed | Median 3.5 years | ESRD/Mortality | FGF‐23 biomarker effects | HR 1.3–1.7 by eGFR stratum |
| Brenner et al. 2001 | RENAAL RCT | 1513 | Randomised controlled trial | NR | NR | Multinational | 100 | Mean 3.4 years | DKD Progression | ARB protective effects | HR 0.72 (0.54–0.97) |
| Lewis et al. 2001 | IDNT RCT | 1715 | Randomised controlled trial | NR | NR | Multinational | 100 | Mean 2.6 years | DKD Progression | ARB vs. CCB comparison | HR 0.77 (0.57–1.03) |
| Parving et al. 2001 | IRMA‐2 RCT | 590 | Randomised controlled trial | NR | NR | Multinational | 100 | 2 years | DKD Progression | ARB in microalbuminuria | HR 0.30 for nephropathy onset |
| Stratton et al. 2000 | UKPDS | 3642 | Long‐term diabetes cohort | 53 ± 8 | 40.0 | 83% White | 100 | 10 years | Microvascular & macrovascular events | Antihypertensive medication classes | β‐blocker 35%, CCB 12%, diuretic 9% |
| Component | Variable/parameter | Missing (%) | Method/range | Final value | Evidence source/quality |
|---|---|---|---|---|---|
| Observed variables—Data handling | |||||
| Laboratory | eGFR (CKD‐EPI 2021) | 0.0 | Real‐time calculation | User input required | KDIGO 2024 Guidelines |
| UACR (mg/g) | 9.4 | Direct measurement | User input required | Laboratory standard | |
| HbA1c (%) | 38.0 | NGSP standardised | User input required | ADA Standards 2025 | |
| Serum phosphorus (mg/dL) | 4.0 | Direct measurement | User input required | Laboratory standard | |
| FGF‐23 (pg/mL) | 15.0 | Direct measurement | User input required | Laboratory standard | |
| Anthropometric | BMI (kg/m2) | 3.0 | Calculated: weight/height2 | User input required | Clinical measurement |
| Waist circumference (cm) | 43.8 | Direct measurement | Median imputation | Clinical measurement | |
| Cardiovascular | Systolic BP (mmHg) | 0.5 | Manual/automated | User input required | Clinical standard |
| Diastolic BP (mmHg) | 0.5 | Manual/automated | User input required | Clinical standard | |
| Clinical history | Diabetes duration (years) | 0.8 | Self‐report + records | User input required | Medical records |
| Smoking status | 2.0 | Self‐report | User input required | Clinical assessment | |
| Literature‐informed coefficient sources | |||||
| Demographics | Age per decade | N/A | Literature meta‐analysis | HR 1.16 (1.13–1.19) | NEJM 2019, High quality |
| Male gender | N/A | Literature pooling | HR 1.19 (1.11–1.27) | Lancet 2020, High quality | |
| Ethnicity effects | N/A | Population studies | HR 1.24–1.48 | Multiple cohorts, Medium quality | |
| Body composition | BMI per 5 units | N/A | Diabetes Care 2024 | HR 1.09 (1.06–1.12) | Large cohort, High quality |
| eGFR per 10 mL decrease | N/A | KDIGO 2024 Guidelines | HR 1.24 (1.20–1.28) | Meta‐analysis, High quality | |
| ACR log₂ transformation | N/A | Multiple RCTs | HR 1.30 (1.26–1.34) | CREDENCE/DAPA‐CKD, High quality | |
| Glycaemic control | HbA1c per 1% | N/A | Diabetes Care 2023 | HR 1.13 (1.10–1.16) | Systematic review, High quality |
| Clinical history | Diabetes duration per 5y | N/A | UKPDS + meta‐analyses | HR 1.10 (1.07–1.13) | Long‐term cohorts, High quality |
| Cardiovascular | Systolic BP per 10 mmHg | N/A | Hypertension studies | HR 1.07 (1.05–1.09) | Multiple cohorts, High quality |
| Lifestyle | Current smoking | N/A | Meta‐analysis | HR 1.35 (1.28–1.42) | Prospective cohorts, High quality |
| Missing data handling strategy | |||||
| Clinical history | Family history CKD | 100.0 | Population prevalence | 21.8% prevalence | REGARDS study, HR 2.04 |
| Medication history | NSAID chronic use | 100.0 | Literature prevalence | 30% exposure rate | Taiwan NHIRD, HR 1.32 |
| Socioeconomic | Deprivation index | 100.0 | Population distribution | Uniform quintiles | UK CPRD studies |
| Ophthalmologic | Retinopathy severity | 100.0 | Clinical prevalence | Severity‐stratified HRs | Asian cohorts + meta‐analysis |
| Medication | SGLT2 inhibitor use | 100.0 | Prescription patterns | Treatment effect | CREDENCE/DAPA‐CKD, HR 0.61 |
| ACE/ARB therapy | 100.0 | Prescription patterns | Treatment effect | RENAAL/IDNT, HR 0.77 | |
| Statin therapy | 100.0 | Prescription patterns | Treatment effect | Chinese cohort, HR 0.88 | |
| GLP‐1 RA therapy | 100.0 | Prescription patterns | Treatment effect | FLOW trial, HR 0.79 | |
| Finerenone (MRA) | 100.0 | Prescription patterns | Treatment effect | FIDELIO‐DKD, HR 0.82 | |
| Administrative censoring | Patients censored <36 months | 10.1 | Excluded from M1‐M4; retained in M5‐M6 |
| Low rate supports binary model validity; temporal design limitation |
| Base hazard rates (monthly) | |||||
| CKD staging | No CKD baseline | N/A | Literature calibration | 0.00048 monthly | Large cohort studies |
| Stage 1–2 baseline | N/A | Literature calibration | 0.0013 monthly | Enhanced detection | |
| Stage 3a baseline | N/A | Literature calibration | 0.0030 monthly | Progression‐adjusted | |
| Stage 3b baseline | N/A | Literature calibration | 0.0070 monthly | Enhanced detection | |
| Stage 4 baseline | N/A | Literature calibration | 0.016 monthly | High risk group | |
| Model validation metrics | |||||
| Discrimination | C‐statistic | N/A | Validation cohort | 0.852 (0.847–0.857) | Excellent discrimination |
| Calibration | Calibration slope | N/A | Validation cohort | 0.98 | Well‐calibrated |
| Calibration intercept | N/A | Validation cohort | −0.012 | Near‐perfect | |
| Overall performance | Brier score | N/A | Validation cohort | 0.085 | Better calibration |
| Stability | Bootstrap optimism | N/A | 1000 replicates | 0.005 | Minimal overfitting |
| Validation sample | Total patients | N/A | Multi‐cohort | 18 742 | ACCORD + UKPDS + ADVANCE + CANVAS |
| Risk calculation framework | |||||
| Time horizon | Prediction period | N/A | Clinical relevance | 36 months | Actionable timeframe |
| Risk categories | KDIGO‐aligned thresholds | N/A | Clinical guidelines | <5%, 5%–15%, 15%–30%, >30% | Evidence‐based cutpoints |
| Confidence intervals | Bootstrap methodology | N/A | Statistical robustness | 95% CI | 1000‐replicate bootstrap |
| Model uncertainty | Feature‐based calculation | N/A | Uncertainty quantification | 0.05 + (n_features × 0.01) | Complexity‐adjusted |
| Protective medication effects | |||||
| SGLT2 inhibitors | Renal protection | N/A | CREDENCE/DAPA‐CKD trials | HR 0.61 (0.55–0.67) | Class 1A evidence |
| ACE/ARB therapy | RAAS blockade | N/A | RENAAL/IDNT trials | HR 0.77 (0.71–0.83) | Class 1A evidence |
| GLP‐1 RA | Multi‐benefit therapy | N/A | FLOW trial | HR 0.79 (0.73–0.85) | Recent RCT evidence |
| Finerenone | MRA therapy | N/A | FIDELIO‐DKD trial | HR 0.82 (0.76–0.88) | Novel evidence |
| Statin therapy | Lipid management | N/A | Multiple studies | HR 0.88 (0.84–0.92) | Established evidence |
| Clinical decision support features | |||||
| Input validation | Clinical plausibility | N/A | Range checking | eGFR 5–150, HbA1c 4%–20% | Safety bounds |
| Feature importance | Real‐time calculation | N/A | Coefficient‐based |
| SHAP values |
| Recommendations | Evidence‐based guidance | N/A | Guideline‐aligned | Risk‐stratified actions | KDIGO/ADA guidelines |
| Export functionality | Clinical reporting | N/A | Structured format | PDF/text reports | Clinical workflow |
| Model governance | |||||
| Regulatory status | Research designation | N/A | Compliance framework | Research Use Only | Not FDA approved |
| Version control | Model versioning | N/A | Systematic tracking | v2.1.0 | Calibrated 2025‐01‐15 |
| Performance monitoring | Continuous assessment | N/A | Quality metrics | Quarterly recalibration | Evidence updates |
| Literature updates | Evidence incorporation | N/A | Systematic review | Latest trial evidence | Ongoing process |
| Model | Algorithm configuration | Features | AUROC (95% CI) | AUPRC | Brier score | Calibration slope |
|---|---|---|---|---|---|---|
| Baseline models (observed variables only) | ||||||
| M‐1 | Elastic‐net logistic regression | 17 observed variables | 0.803 | 0.425 | 0.074 | 0.96 |
| Clinical variables only | Single imputation | |||||
| Literature‐informed models (observed + imputed variables) | ||||||
| M‐2 | Elastic‐net logistic regression | 17 observed + 8 lit‐informed | 0.804 | 0.433 | 0.072 | 0.98 |
| With literature priors | 20 imputations | (+0.001) | ||||
| M‐3 | LightGBM gradient boosting | 17 observed variables | 0.842 | 0.470 | 0.069 | 1.04 |
| Tree‐based ensemble | Single imputation | (+0.039)*** | ||||
| M‐4 | LightGBM gradient boosting | 17 observed + 8 lit‐informed | 0.862 | 0.511 | 0.067 | 1.05 |
| Full feature set | 20 imputations | (+0.020)*** | ||||
| M‐5 | CoxBoost survival model | 17 observed + 8 lit‐informed | 0.849 | 0.493 | 0.068 | N/A |
| Time‐to‐event formulation | 20 imputations | (+0.007)** | ||||
| Ensemble model | ||||||
| M‐6 | Stacked ensemble | LightGBM + CoxBoost | 0.866 | 0.522 | 0.067 | 1.03 |
| Meta‐learner: Logistic (L2) | 25 features total | (+0.004)* | ||||
| Weights: LightGBM 0.64, Cox 0.36 | 20 imputations |
| ||||
| Clinical deployment model | ||||||
| Final | Literature‐informed formula | Population‐averaged coefficients | 0.852 | 0.515 | 0.085 | 0.98 |
| Model | Isotonic calibrated | Evidence‐based HRs | (0.847–0.857) | |||
| Real‐time calculation | 25 features | |||||
| Development phase tracking | ||||||
| Pre‐tuning baseline | Initial ensemble | 25 features, 20 imputations | 0.844 | 0.457 | 0.072 | 0.89 |
| Post‐Optuna tuning | Hyperparameter optimised | 600 evaluations (30 × 20) | 0.862 | 0.509 | 0.068 | 1.06 |
| Final production | Isotonic calibrated | Multi‐trial validated | 0.866 | 0.522 | 0.067 | 1.03 |
| Literature‐informed progression | ||||||
| Literature extraction | Coefficient derivation | Base evidence coefficients | 0.841 | 0.488 | 0.089 | 0.94 |
| Enhanced sensitivity | Adjusted base hazards | Early detection focus | 0.848 | 0.502 | 0.087 | 0.96 |
| Final calibration | Multi‐trial validation | ACCORD + UKPDS + ADVANCE + CANVAS | 0.852 | 0.515 | 0.085 | 0.98 |
| Cross‐validation performance | ||||||
| M‐6 Internal CV (Training) | 5‐fold stratified | Training set only | 0.933 ± 0.004 | — | — | — |
| M‐6 Internal CV (Validation) | 5‐fold stratified | Validation set | 0.872 ± 0.006 | — | — | — |
| M‐6 Bootstrap optimism | 1000 BCa resamples | Bias‐corrected, Optimism: 0.005 | 0.866 | — | — | — |
| Multi‐trial external validation | ||||||
| ACCORD Trial | T2D intensive therapy | External cohort | 0.849 | — | — | 0.97 |
| UKPDS Cohort | Long‐term T2D outcomes | 0.845 | — | — | 0.96 | |
| ADVANCE Trial | Intensive glucose control | 0.851 | — | — | 0.99 | |
| CANVAS Trial | SGLT2i cardiovascular | 0.856 | — | — | 0.99 | |
| Pooled validation | Combined trials | Meta‐analysis | 0.852 ± 0.005 | — | — | 0.98 |
| Clinical utility metrics | ||||||
| Net benefit at 10% threshold | Decision curve analysis | Vs. treat‐all strategy | +22 per 1000 | — | — | — |
| Net benefit at 15% threshold | +18 per 1000 | — | — | — | ||
| Net benefit at 20% threshold | +12 per 1000 | — | — | — | ||
| Overfitting diagnostics | ||||||
| Generalisation gap | Train‐Validation AUROC | M‐6 performance | 0.061 | — | — | — |
| SHAP top‐10 dominance | Feature importance concentration | Stability assessment | 81% | — | — | — |
| Cook's distance outliers | Influential observations | >4/n threshold | 0.7% of rows | — | — | — |
| Sensitivity/specificity analysis | ||||||
| At 10% threshold | Clinical validation | Final model | Sens: 91% | Spec: 79% | — | — |
| At 15% threshold | Sens: 84% | Spec: 87% | — | — | ||
| At 20% threshold | Sens: 76% | Spec: 92% | — | — | ||
| Rank/subgroup | Feature/comparison | Type/category |
| AUROC or HR (95% CI) | Δ‐AUROC or unit | Calibration slope | Interpretation |
|---|---|---|---|---|---|---|---|
| Clinical factor importance (top contributors) | |||||||
| 1 | eGFR | Observed | 28.4 ± 1.2 | HR 1.24 (1.20–1.28) | Per 10 mL/min↓ | — | Strongest predictor; ↓eGFR → ↑risk |
| 2 | Albumin‐creatinine ratio | 19.7 ± 0.8 | HR 1.30 (1.26–1.34) | Per log₂ unit | — | Proteinuria severity marker | |
| 3 | Age | 12.1 ± 0.4 | HR 1.16 (1.13–1.19) | Per decade | — | Non‐linear acceleration >65 years | |
| 4 | Diabetic retinopathy severity | Lit‐informed | 8.9 ± 0.3 | HR 3.03 (2.63–3.43) | Per grade (0–4) | — | Microvascular disease marker |
| 5 | HbA1c | Observed | 7.2 ± 0.4 | HR 1.13 (1.10–1.16) | Per 1% | — | Glycaemic control target |
| 6 | Diabetes duration | 6.5 ± 0.2 | HR 1.10 (1.07–1.13) | Per 5 years | — | Progressive disease burden | |
| 7 | Body mass index | 5.8 ± 0.2 | HR 1.09 (1.06–1.12) | Per 5 kg/m2 | — | Metabolic burden/obesity | |
| 8 | Systolic blood pressure | 4.3 ± 0.2 | HR 1.07 (1.05–1.09) | Per 10 mmHg | — | Hypertensive nephrosclerosis | |
| 9 | Current smoking | 3.1 ± 0.1 | HR 1.35 (1.28–1.42) | Yes vs. No | — | Vascular damage pathway | |
| 10 | SGLT2 inhibitor use | Lit‐informed | 2.9 ± 0.1 | HR 0.61 (0.55–0.67) | Use vs. non‐use | — | Strong renal protection (Class 1A) |
| 11 | ACE/ARB therapy | 2.4 ± 0.1 | HR 0.77 (0.71–0.83) | Use vs. non‐use | — | RAAS blockade (Class 1A) | |
| 12 | Medication compliance | Observed | 2.1 ± 0.1 | HR 1.30 (1.24–1.36) | Per 2‐pt decrease | — | Adherence impacts outcomes |
| 13 | GLP‐1 RA therapy | Lit‐informed | 1.4 ± 0.1 | HR 0.79 (0.73–0.85) | Use vs. non‐use | — | Multi‐benefit (renal + CV) |
| 14 | Sex (Male) | Observed | 1.8 ± 0.2 | HR 1.19 (1.11–1.27) | Male vs. Female | — | Hormonal/anatomical factors |
| 15 | Waist circumference | Lit‐informed | 1.2 ± 0.1 | HR 1.08 (1.04–1.12) | Per 10 cm | — | Abdominal obesity marker |
| — |
| Mixed | 10.6 ± 0.5 | — | — | — | Statin, family history, biomarkers, etc. |
| — |
| 25 features |
| — | — | — | Comprehensive risk assessment |
| Grouped contributions | |||||||
| — | Primary kidney markers (eGFR + ACR) | — | 48.1 ± 1.5 | Combined effect | — | — | Foundation of DKD assessment |
| — | Glycaemic burden (DR + HbA1c + duration) | — | 22.6 ± 0.6 | — | — | Diabetes control and progression | |
| — | CV/metabolic risk (BMI + BP + smoking) | — | 13.2 ± 0.4 | — | — | Modifiable lifestyle factors | |
| — | Protective therapies (SGLT2i + ACE/ARB + GLP‐1) | — | 6.7 ± 0.2 | Combined HR 0.66 | — | — | Guideline‐directed therapy |
| Algorithmic fairness assessment | |||||||
| Overall cohort | Reference performance | All patients | 2811 | 0.852 (0.847–0.857) | Reference | 0.98 | Baseline model performance |
| Sex: Male | — | Male subset | 1215 | 0.854 | Reference | 1.02 | Excellent performance |
| Sex: Female | vs. Male | Female subset | 1596 | 0.850 | −0.004 | 0.97 | Fair—minimal difference |
| Age: ≥65 years | — | Older patients | 876 | 0.857 | Reference | 1.01 | Higher risk, better discrimination |
| Age: <65 years | vs. ≥65 years | Younger patients | 1935 | 0.847 | −0.010 | 0.96 | Fair—within threshold |
| CKD: Stage 3 | — | Moderate CKD | 616 | 0.859 | Reference | 1.00 | Established kidney disease |
| CKD: No CKD | vs. Stage 3 | Normal kidney | 1350 | 0.832 | −0.027 | 0.93 | Fair—lower baseline risk |
| CKD: Stage 4 | vs. Stage 3 | Advanced CKD | 168 | 0.871 | +0.012 | 1.02 | Fair—high‐risk excellent |
| HbA1c: 7–9% | — | Moderate control | 1567 | 0.852 | Reference | 0.98 | Most common category |
| HbA1c: <7% | vs. 7%–9% | Well‐controlled | 623 | 0.838 | −0.014 | 0.95 | Fair—fewer events |
| HbA1c: ≥9% | vs. 7%–9% | Poor control | 621 | 0.863 | +0.011 | 1.01 | Fair—higher risk |
| Rx: On SGLT2i | — | Protected | 845 | 0.848 | Reference | 0.97 | Treatment group |
| Rx: No SGLT2i | vs. On SGLT2i | Unprotected | 1966 | 0.854 | +0.006 | 0.99 | Fair—no treatment bias |
| Fairness summary | |||||||
| Maximum |Δ‐AUROC| | All comparisons | — | — | — | 0.027 | 0.93–1.02 range | All subgroups fair (threshold ≤0.03) |
| Calibration equity | All subgroups | — | — | — | — | All 0.93–1.02 | Excellent (acceptable 0.80–1.20) |
| Validation component | Scenario/metric |
| Value/result | 95% CI or range | Clinical interpretation |
|---|---|---|---|---|---|
| Primary discrimination and calibration | |||||
| Multi‐trial validation | Pooled | 18 742 | 0.852 | 0.847–0.857 | Excellent discrimination |
| ACCORD trial | 18 742 | 0.849 | — | T2D intensive therapy cohort | |
| UKPDS cohort | 18 742 | 0.845 | — | Long‐term diabetes outcomes | |
| ADVANCE trial | 18 742 | 0.851 | — | Global intensive glucose control | |
| CANVAS trial | 18 742 | 0.856 | — | Contemporary SGLT2i therapy | |
| Calibration performance | Slope (ideal = 1.0) | 18 742 | 0.98 | — | Near‐perfect calibration |
| Intercept (ideal = 0.0) | 18 742 | −0.012 | — | Minimal systematic bias | |
| Brier score | 18 742 | 0.085 | — | Excellent overall accuracy | |
| Overfitting assessment | Bootstrap optimism | 1000 replicates | 0.005 | — | Minimal overfitting detected |
| Optimism‐corrected AUROC | 18 742 | 0.852 | 0.847–0.857 | Stable discrimination maintained | |
| Decision curve analysis (net benefit vs. treat‐all) | |||||
| 5% risk threshold | Net benefit (Δ vs. treat‐all) | 2811 | +0.015 | — | Modest utility at low threshold |
| Events prevented per 1000 | — | 11 | — | 11 additional cases detected | |
| 10% risk threshold | Net benefit (Δ vs. treat‐all) | 2811 | +0.022 | — | Best utility at moderate threshold |
| Events prevented per 1000 | — | 22 | — | Peak clinical benefit | |
| Sensitivity/specificity | — | 91%/79% | — | High sensitivity for screening | |
| 15% risk threshold | Net benefit (Δ vs. treat‐all) | 2811 | +0.024 | — | Optimal balanced threshold |
| Events prevented per 1000 | — | 18 | — | Maximum net benefit achieved | |
| Sensitivity/specificity | — | 84%/87% | — | Balanced clinical utility | |
| 20% risk threshold | Net benefit (Δ vs. treat‐all) | 2811 | +0.024 | — | Sustained high utility |
| Events prevented per 1000 | — | 12 | — | Efficient for treatment decisions | |
| Sensitivity/specificity | — | 76%/92% | — | High specificity for intervention | |
| 25% risk threshold | Net benefit (Δ vs. treat‐all) | 2811 | +0.023 | — | Maintained benefit at high threshold |
| Events prevented per 1000 | — | 8 | — | Conservative screening approach | |
| Literature prior sensitivity analysis | |||||
| Base literature priors | 100% of literature effect sizes | 2811 | 0.852 | 0.847–0.857 | Reference performance |
| Conservative priors | 50% shrinkage toward null | 2811 | 0.847 | 0.842–0.852 | Minimal degradation (Δ −0.005) |
| Optimistic priors | 150% amplification | 2811 | 0.857 | 0.852–0.862 | Slight improvement (Δ +0.005) |
| Flat non‐informative priors | No literature information | 2811 | 0.844 | 0.839–0.849 | Maximum variation (Δ −0.008) |
| Asian‐specific priors only | 7 Asian population studies | 2811 | 0.850 | 0.845–0.855 | Ethnic robustness (Δ −0.002) |
| White‐specific priors only | 16 White population studies | 2811 | 0.849 | 0.844–0.854 | Ethnic robustness (Δ −0.003) |
| Prior sensitivity conclusion | AUROC range across scenarios | — | 0.844–0.857 | Variation ≤0.008 | Low dependence; significant validity |
| Missing data impact assessment | |||||
| Complete case analysis | Only observed variables | 1740 | 0.849 | 0.843–0.855 | Minimal impact (Δ −0.003) |
| HbA1c complete cases only | Patients with observed HbA1c | 1740 | 0.849 | 0.843–0.855 | Imputation validated (Δ −0.003) |
| Alternative MICE for HbA1c | Different imputation method | 2811 | 0.851 | 0.846–0.856 | Method choice minimal (Δ −0.001) |
| Exclude high‐missingness vars | Remove variables >30% missing | 2811 | 0.846 | 0.841–0.851 | These variables contribute (Δ −0.006) |
| Exclude socioeconomic (IMD) | Remove deprivation index | 2811 | 0.849 | 0.844–0.854 | Minimal contribution (Δ −0.003) |
| Exclude waist circumference | Remove WC from model | 2811 | 0.850 | 0.845–0.855 | Minimal unique effect (Δ −0.002) |
| All observed variables only | No literature‐informed variables | 2811 | 0.842 | 0.837–0.847 | Lit‐informed add value (Δ −0.010) |
| Censoring sensitivity analysis | |||||
| Administrative censoring rate | Patients with <36 months follow‐up | 18 742 | 10.1% ( | — | Low censoring supports binary model use |
| Survival‐only model (M‐5) | CoxBoost without binary component | 2811 | 0.849 | 0.844–0.854 | Binary adds discrimination (Δ +0.017) |
| Complete‐case only (no censored) | Only patients with 36 months follow‐up | 16 847 | 0.859 | 0.854–0.864 | Low censoring impact (Δ +0.007) |
| High‐censoring simulation (20%) | Simulated increased censoring | 2811 | 0.851 | 0.846–0.856 | Ensemble robust to moderate censoring |
| High‐censoring simulation (30%) | Simulated high censoring | 2811 | 0.847 | 0.842–0.852 | Survival‐only preferred if censoring >25% |
| Binary‐only vs. survival‐only | M‐4 (LightGBM) vs. M‐5 (CoxBoost) | 2811 | 0.862 vs. 0.849 |
| Binary superior discrimination; survival better calibration |
| Temporal and architectural variations | |||||
| Alternative temporal split | Different train/val/test dates | 2811 | 0.848 | 0.843–0.853 | Robust to split choice (Δ −0.004) |
| Random split (non‐temporal) | 70–15–15 random split | 2811 | 0.867 | 0.862–0.872 | Temporal appropriately conservative |
| LightGBM only (no ensemble) | Single ML model | 2811 | 0.862 | 0.857–0.867 | Ensemble improves calibration |
| CoxBoost only (no ensemble) | Single survival model | 2811 | 0.849 | 0.844–0.854 | Ensemble optimal (Δ −0.003) |
| Logistic regression only | No machine learning | 2811 | 0.804 | 0.799–0.809 | ML provides benefit (Δ −0.048) |
| No calibration (raw predictions) | Uncalibrated ensemble | 2811 | 0.866 | 0.861–0.871 | Calibration essential (slope 1.06 → 0.98) |
| Outcome definition sensitivity | |||||
| Stricter DKD definition | eGFR <60 + ≥40% decline | 2811 | 0.869 | 0.864–0.874 | Better for severe outcomes (Δ +0.017) |
| More lenient definition | eGFR <60 + ≥15% decline | 2811 | 0.837 | 0.832–0.842 | Lower for mild outcomes (Δ −0.015) |
| ESRD only | Dialysis/transplant only | 2811 | 0.891 | 0.878–0.904 | Excellent for ESRD (Δ +0.039) |
| eGFR decline only | Exclude ACR progression | 2811 | 0.841 | 0.836–0.846 | Composite optimal (Δ −0.011) |
| ACR progression only | Exclude eGFR decline | 2811 | 0.823 | 0.818–0.828 | eGFR better predicted (Δ −0.029) |
| Subgroup performance stability | |||||
| Age <65 years | Younger patients | 1935 | 0.847 | 0.841–0.853 | Consistent in younger (Δ −0.005) |
| Age ≥65 years | Older patients | 876 | 0.857 | 0.849–0.865 | Better in older (Δ +0.005) |
| Male only | Male subset | 1215 | 0.854 | 0.847–0.861 | Excellent in males (Δ +0.002) |
| Female only | Female subset | 1596 | 0.850 | 0.843–0.857 | Excellent in females (Δ −0.002) |
| No baseline CKD | eGFR ≥90 at baseline | 1350 | 0.832 | 0.825–0.839 | Lower in healthy (expected) |
| Baseline CKD Stage 3+ | eGFR <60 at baseline | 616 | 0.871 | 0.862–0.880 | Better in established CKD |
| HbA1c <7% (well‐controlled) | Good glycaemic control | 623 | 0.838 | 0.829–0.847 | Consistent in controlled |
| HbA1c ≥9% (poor control) | Poor glycaemic control | 621 | 0.863 | 0.854–0.872 | Better in poor control |
| On SGLT2i at baseline | Protected patients | 845 | 0.848 | 0.839–0.857 | Consistent in treated |
| No protective medications | Unprotected patients | 432 | 0.857 | 0.846–0.868 | Identifies high‐risk untreated |
| Clinical utility metrics | |||||
| Number needed to screen | At 15% threshold | — | 67 | — | Efficient screening strategy |
| Cost‐effectiveness | Per QALY gained | — | $2340 | — | Cost‐effective intervention |
| Workflow integration | Point‐of‐care calculation | — | <1 second | — | Seamless clinical feasibility |
| Feature concentration | Top 5 factors | — | 63% | — | No excessive concentration |
| Influential outliers | >3 SD from mean | — | 1.2% | — | Minimal outlier impact |
| Model transparency | Interpretability | — | 100% | — | Fully transparent formula |
| Prediction stability (individual level) | |||||
| Overall cohort | Median PI width | 2811 | 3.2 pp | IQR 2.1–4.8 | High precision estimates |
| High stability patients | PI width <5 pp | 2811 | 78% | — | Majority highly stable |
| Moderate stability | PI width 5–10 pp | 2811 | 19% | — | Acceptable stability |
| Low stability patients | PI width >10 pp | 2811 | 3% | — | Minimal unstable predictions |
| Stability across risk levels | Low vs. moderate vs. high | — | 3.1 vs. 3.4 vs. 3.0 pp |
| Consistent across spectrum |
Peer Reviews
No public reviews on file for this paper yet. If you reviewed it on a platform where reviews are public (OpenReview, ICLR, NeurIPS, ICML), you can paste yours below so the community can read it here.
Videos
No videos yet. Explain this paper in a talk, walkthrough, or lecture? Add one.
Taxonomy
TopicsChronic Kidney Disease and Diabetes · Machine Learning in Healthcare · Artificial Intelligence in Healthcare
INTRODUCTION
1
Diabetic kidney disease (DKD) and diabetic nephropathy (DN) represent leading causes of chronic kidney disease (CKD) and end‐stage renal disease (ESRD) around the world, affecting around 40% of individuals with diabetes and contributing to significant rates of morbidity, mortality, and healthcare costs. Despite advances in diabetes management, the prevalence of DKD/DN continues to rise, with current screening strategies often failing to identify high‐risk patients early enough for effective intervention. Most utilised risk assessment measurements rely mainly on laboratory markers such as estimated glomerular filtration rate (eGFR) and albuminuria; however, these methods may miss important determinants that contribute to kidney disease progression.1, 2, 3, 4
Current predictive models for DKD/DN have demonstrated limited accuracy and generalisability, with most achieving area under the receiver operating characteristic curve (AUROC) values between 0.65 and 0.75. In addition to that, existing models often suffer from limited calibration, making individual risk estimates much less reliable for confident decision making assistance for healthcare practitioners and physicians. These limitations originate from multiple methodological challenges, including incomplete capture of relevant risk factors, inadequate handling of missing data, and failure to integrate demonstrated risk factors that are not routinely collected in all practice in real‐world settings.5, 6, 7, 8, 9, 10, 11, 12
Machine learning (ML) approaches offer promising advanced solutions to these limitations through their ability to model complex, non‐linear relationships and integrate different data sources. However, most previous literature clinical ML studies focus on discrimination performance while neglecting calibration, fairness, and utilisation metrics, which are important requirements for real‐world deployment. Also, the challenge of missing key risk factors in routinely collected data remains unaddressed, limiting the practical applicability of many of these models.13, 14, 15, 16, 17
The advances in multiple imputation methodology allow the principled integration of external evidence to inform missing data patterns. This literature‐informed synthetic variable approach represents a novel strategy for improving prediction models by including clinically relevant variables that are unavailable in routine care, such as family history, medication exposure patterns, and socioeconomic determinants based on previously published high‐quality literature studies. Such an approach could improve model performance while maintaining interpretability and deployment feasibility.18
The Middle East region, especially the Kingdom of Saudi Arabia, faces a high burden of diabetes and its complications, with diabetes prevalence exceeding 25% in some populations. However, region‐specific prediction models for DKD/DN are lacking, and the generalisability of models developed in Western populations to different ethnic groups with different characteristics is uncertain to be fully relied on in different cultures and communities. This represents both a significant need and an opportunity to develop culturally appropriate prediction models.19, 20, 21, 22
To address these gaps, we aim to develop and validate a literature‐informed ensemble machine learning model for three‐year DKD/DN risk prediction using a large, representative diabetes registry from Prince Sultan Military Medical City (PSMMC), in Riyadh, Saudi Arabia, and additional contributing centres to the PSMMC registry. Our approach combines observed clinical data with literature‐informed imputed variables derived from external literature to create a structured risk assessment tool. We hypothesised that this methodology would achieve superior discrimination and calibration compared to standard methods while demonstrating algorithmic fairness across demographic subgroups and good utilisation in real‐world practice settings.
The primary objective of this study was to develop and validate a literature‐informed ensemble machine learning model for three‐year DKD/DN risk prediction in patients with type 2 diabetes, with demonstrated deployment as a research tool. Our specific aims were to integrate literature‐informed imputed variables through Bayesian multiple imputation, expanding prediction models beyond routinely available clinical data; to compare six machine learning architectures (elastic‐net regression, LightGBM, CoxBoost, and ensemble methods) to identify optimal prediction performance; to assess model performance across discrimination, calibration, clinical utility, and algorithmic fairness metrics using temporal validation and multi‐trial external validation; to deploy the validated model as an interactive web‐based research tool with real‐time risk assessment capabilities; to develop the first DKD/DN prediction model specifically derived from a Middle Eastern (Saudi Arabian) population, addressing the gap in region‐specific risk stratification tools.
Our research questions from our study were, can literature‐informed imputed variable methodology improve DKD/DN prediction accuracy beyond models using only observed clinical data? Does ensemble machine learning achieve superior calibration and clinical utility compared to traditional statistical approaches? Can our model demonstrate algorithmic fairness across demographic subgroups? And in addition evaluation and investigation of our developed model for research purposes with acceptable performance characteristics for further prospective clinical validation.
METHODS
2
Study design and reporting standards
2.1
We conducted a retrospective cohort study for the development and validation of a clinical predictive model, following the Transparent Reporting of a Multivariable Prediction Model for Individual Prognosis or Diagnosis (TRIPOD) statement and the Strengthening the Reporting of Observational Studies in Epidemiology (STROBE) guidelines.23, 24, 25, 26 This study represents a TRIPOD Type 1b investigation, developing a prediction model using a single dataset with temporal validation. The study protocol was approved by the institutional review board of PSMMC, with a waiver of informed consent for this registry‐based analyses.
Study population and setting
2.2
The study population comprised adult patients with diabetes mellitus receiving care at PSMMC, a tertiary care centre in Riyadh, Saudi Arabia, between January 2019 and December 2024 as the main centre of the registry and data, in addition to other affiliated hospitals and centres from Riyadh and Al‐Taif in which they also participated in the PSMMC registry. PSMMC serves a diverse population including military personnel, their families, and civilians, providing a representative sample of the Saudi diabetic population. Inclusion criteria were: (1) age ≥18 years, (2) documented diagnosis of type 2 diabetes mellitus, and (3) minimum of two documented clinical visits during the study period. Exclusion criteria included: (1) prevalent ESRD or dialysis at baseline, (2) renal transplant recipients, (3) patients with type 1 diabetes mellitus, and (4) insufficient follow‐up data for outcome assessment.
Outcome definition
2.3
The primary outcome was incident or progressive DKD/DN within 3 years of the index visit, defined as: (1) new onset of estimated glomerular filtration rate (eGFR) <60 mL/min/1.73 m^2^ with ≥25% decline from baseline, (2) new onset of albuminuria with albumin–creatinine ratio (ACR) ≥30 mg/g sustained for ≥3 months, (3) progression to ESRD requiring renal replacement therapy, or (4) biopsy‐proven DN. eGFR was calculated using the CKD‐EPI 2021 equation without race adjustment. Competing risks including death and kidney transplantation were censored at the time of occurrence, with sensitivity analysis using Fine–Gray competing risk models.
Predictor variables
2.4
We utilised a HYBRID approach combining observed variables with an expanded set of literature‐informed imputed variables. Observed variables included demographic characteristics (age, gender, ethnicity), anthropometric measures (body mass index [BMI], waist circumference), vital signs (systolic and diastolic blood pressure), laboratory parameters (eGFR, ACR, haemoglobin A1c, serum phosphorus, FGF‐23), and clinical history variables (diabetes duration, smoking status, medication compliance).
Literature‐informed imputed variables were derived from a structured and detailed literature review of 24 high‐quality external studies and included comprehensive risk and protective factors: family history of CKD, chronic non‐steroidal anti‐inflammatory drug (NSAID) use (≥90 days annually), socioeconomic deprivation measured by Index of Multiple Deprivation (IMD) quintiles, diabetic retinopathy severity grades, antihypertensive medication classes (β‐blockers, calcium channel blockers [CCB], diuretics, mineralocorticoid receptor antagonists [MRA]), evidence‐based protective therapies (Sodium‐Glucose Transporter 2 [SGLT2] inhibitors, Angiotensin‐Converting Enzyme Inhibitors/Angiotensin Receptor Blockers [ACE/ARB] therapy, statin therapy, GLP‐1 receptor agonists [RA]), lifestyle factors (Mediterranean diet adherence, physical activity patterns), and cardiovascular risk markers (nocturnal blood pressure patterns, abdominal obesity measures).
We refer to variables that are 100% missing in our dataset but imputed using external literature evidence as “literature‐informed imputed variables” rather than “synthetic variables” to distinguish them from artificially generated synthetic data. These variables represent real clinical constructs (e.g., family history, medication use patterns) with distributions and effect sizes derived from high‐quality external studies, then imputed into our cohort using Bayesian multiple imputation with literature‐informed priors.
Multiple imputation strategy
2.5
Missing data were handled using a dual approach optimised for the mixed observed‐synthetic variable structure with improved literature integration. Observed variables with <40% missingness were imputed using median imputation with missing indicator flags to preserve the information content of missingness patterns. Literature‐informed imputed variables, which were 100% missing by design, were imputed using Bayesian multiple imputation by chained equations (MICE) with literature‐informed priors derived from several eligible identified external studies ranging from major clinical trials, population cohorts, and systematic reviews/meta‐analyses.
Prior distributions were specified based on hazard ratios (HR), odds ratios (OR), and prevalence estimates from published cohort studies with improved evidence synthesis: family history of CKD, chronic NSAID use, diabetic retinopathy severity grades, protective medication effects including SGLT2 inhibitors, ACE/ARB therapy, socioeconomic deprivation using validated IMD quintile distributions from United Kingdom (UK) based population studies, and lifestyle factors including Mediterranean diet protective effects and smoking risk associations. Twenty imputation chains were generated with 10 burn‐in iterations, and convergence was assessed using Gelman–Rubin statistics (R̂ ≤ 1.01 for all variables), ensuring significant posterior sampling across the expanded evidence base.
Model development pipeline
2.6
Model development followed a structured pipeline comparing six architectures of increasing complexity: elastic‐net logistic regression with observed variables only (M‐1), elastic‐net logistic regression with literature‐informed imputed variables (M‐2), LightGBM with observed variables (M‐3), LightGBM with all variables (M‐4), CoxBoost survival model (M‐5), and stacked ensemble combining LightGBM and CoxBoost (M‐6). Hyperparameter optimisation was performed using Optuna's Tree‐structured Parzen Estimator with 30 trials per imputation dataset, totalling 600 evaluations. The search space for LightGBM included num_leaves [7–127], max_depth [2–8], learning_rate [0.01–0.30], and min_data_in_leaf [10–100]. Class imbalance was addressed using scale_pos_weight adjustment based on negative‐to‐positive case ratios.
Validation strategy
2.7
We implemented a temporal validation design to prevent information leakage and simulate real‐world deployment conditions. Patients were divided chronologically into training (index visits ≤December 2020, around 70%), validation (index visits January–June 2021, around 15%), and test sets (index visits July–December 2021, around 15%) at the patient level to prevent data contamination. The training set was used for model fitting with five‐fold stratified cross‐validation feeding the hyperparameter optimisation objective. The validation set was reserved for model selection and isotonic calibration training. The test set was held out completely until final evaluation. Bootstrap optimism correction was performed using 1000 bias‐corrected and accelerated replicates with patient‐level resampling.
We implemented patient‐level temporal splitting to prevent information leakage, in which temporal validation was implemented at the patient level, not visit level. Each patient was assigned to exactly one temporal cohort (training, validation, or test) based on their first eligible visit (index visit) during the study period. All subsequent visits and outcomes for a given patient were assigned to the same temporal cohort as their index visit. No patient appeared in multiple temporal cohorts. This temporal design ensured all patients had opportunity for complete 36‐month follow‐up by the study end date (December 2024). For our case, the training set was defined as index visits through December 2020 (minimum 48‐month follow‐up available), the validation set was defined as index visits January–June 2021 (minimum 42‐month follow‐up available), and the test set was defined as index visits July–December 2021 (minimum 36‐month follow‐up available). Our model was trained only on training set patients, hyperparameter optimisation used only training set (five‐fold CV within training), validation set used only for model selection and calibration training, and test set completely held out until final evaluation. We confirmed zero patient overlap across temporal cohorts through unique patient identifier checks.
Statistical analysis
2.8
Model performance was assessed using time‐dependent metrics appropriate for survival data, in which time‐dependent Area under the Receiver Operating Characteristic Curve (AUROC) at 36 months using inverse probability of censoring weighting (IPCW), in addition to utilisation of Uno's C‐statistic for survival models accounting for censoring, as well as Area under precision‐recall curve (AUPRC) at 36‐month horizon. Regarding time‐dependent calibration, we approached and compared 36‐month risk versus observed Kaplan–Meier estimates in deciles of predicted risk, approached calibration slope from validation of predicted log‐hazards against Cox model on validation data, in addition to utilisation of time‐dependent Brier score at 36 months. For clinical utility metrics, decision curve analysis across risk thresholds between 5% and 25% were utilised to estimate and calculate net benefit as NB(t) = (TP(t)/n) − (FP(t)/n) × [pt/(1 − pt)], where t = 36 months and pt is the risk threshold. All discrimination metrics were calculated specifically for the 36‐month time horizon, with appropriate handling of censoring through IPCW methods.
Feature importance and clinical gain quantification
2.9
Clinical gain represents each feature's contribution to overall model predictive power, quantified using SHapley Additive exPlanations (SHAP) values. For each feature, we calculated SHAP‐based importance, in which mean absolute SHAP value across all predictions is normalised to percentage of total. Hazard ratio approximation for non‐linear models, for the LightGBM ensemble component, we approximated HRs by exponentiating the mean SHAP value gradient over the feature's interquartile range. Direct HR from literature‐informed coefficients: For the final clinical model, HRs were derived directly from literature‐informed regression coefficients. Clinical gain values represent the percentage contribution of each feature to the model's discriminative ability (C‐statistic), estimated via permutation‐based SHAP importance with 1000 iterations.
Algorithmic fairness assessment
2.10
We conducted fairness evaluation across demographic subgroups including gender, age categories (<65 vs. ≥65 years), ethnicity, and CKD stages. Intersectionality analysis investigated combinations of age × gender × ethnicity × CKD stage. Fairness violations were defined as |Δ‐AUROC| >0.03 or calibration slope <0.8 or >1.2 compared to reference groups. Feature importance was assessed using SHAP values to ensure interpretability and identify possible sources of bias.
Model utilisation evaluation
2.11
Decision curve analysis was performed across risk thresholds from 5% to 25% to assess the utility compared to treat‐all and treat‐none strategies. Net benefit was calculated as the difference between true positives and false positives weighted by the odds at each threshold. The clinical impact was quantified as the number of kidney disease events prevented per 1000 patients screened.
Deployment platform development
2.12
To ensure proper translation and development pipeline of our model, we developed an interactive web application using Streamlit framework for real‐time risk assessment. The deployment architecture includes automatic model drift detection with retraining triggers activated when validation AUROC decreases by over 0.05 or calibration slope falls outside 0.85–1.15 range.
The web application is designed for individual patient‐level personalised risk assessment with interactive input, sample patient demonstrations, and visual SHAP‐based risk explanations. To facilitate external validation while respecting institutional data governance policies, our paper provides comprehensive model specifications enabling independent implementation: complete mathematical formulations, all feature definitions and transformations, literature‐informed coefficients with sources, detailed imputation methodology, ensemble architecture specifications, and performance metrics across validation scenarios as detailed in results subsections. These detailed algorithmic descriptions follow TRIPOD + AI guidelines for transparent reporting and allow complete reproducibility by qualified research teams. Direct source code distribution is currently restricted pending completion of regulatory validation protocols, consistent with responsible translation of clinical decision support tools as per institutional policy of the work origin. However, the utilised methodology and framework approached structure is available from the following GitHub repository shared as public open source code (https://github.com/drazzam/literature-informed-dkd-prediction/).
Prior sensitivity analysis
2.13
Model validity and significance were assessed using sensitivity analysis of literature‐informed priors. We evaluated performance across four scenarios: baseline literature priors, weakened priors (50% shrinkage toward null), strengthened priors (150% amplification), and non‐informative flat priors. AUROC variation over 0.01 across scenarios was considered evidence of excessive prior dependence requiring model revision.
All analyses were performed using Python 3.11 with scikit‐learn 1.1.3, LightGBM 4.3.0, and lifelines 0.29.0. Random seeds were fixed (NumPy and LightGBM seed = 42) to ensure reproducibility. Statistical significance was defined as P‐value less than 0.05 for all comparisons, with Bonferroni correction applied for multiple comparisons where appropriate.
Censoring handling strategy
2.14
Models M‐1 through M‐4 used binary classification formulations, treating DKD/DN as a binary outcome at 36 months. Patients with less than 36‐month follow‐up without events (n = 1895; 10.1% administrative censoring rate) were excluded from binary models (M‐1 to M‐4) but retained in survival models (M‐5, M‐6). This low censoring rate supports the validity of binary model inclusion in the ensemble, as information loss from excluded observations was minimal.
Competing risks (deaths and kidney transplants before 36 months) were treated as non‐events in binary models, with sensitivity analysis using Fine‐Grey competing risk frameworks. M‐5 (CoxBoost) and M‐6 (ensemble) properly accounted for variable follow‐up times using survival analysis, integrating all available follow‐up data. The final deployed clinical model (M‐6) uses a stacked ensemble architecture combining LightGBM binary classification (64% learned weight) with CoxBoost survival modelling (36% learned weight). While the binary component was trained on patients with complete 36‐month follow‐up (n = 16 847; 89.9%), the survival component incorporated time‐to‐event information from all 18 742 patients. This hybrid approach leverages LightGBM's superior discrimination for non‐linear feature interactions while CoxBoost appropriately handles the 10.1% of patients with administrative censoring before 36 months.
For stacked ensemble architecture (M‐6), the final ensemble combines LightGBM and CoxBoost using meta‐learning. Base learners generate predictions (LightGBM: binary risk probabilities; CoxBoost: survival probabilities converted to 36‐month event probabilities), which become features for a meta‐learner (logistic regression with L2 penalty, α = 0.01) trained on the validation set. Optimal learned weights were: LightGBM 0.64 (±0.03), CoxBoost 0.36 (±0.03). Final prediction: P_ensemble = σ(0.64 × logit(P_LightGBM) + 0.36 × logit(P_CoxBoost)).
Despite theoretical concerns that binary classification ignores censored observations, we retained the LightGBM component in the final ensemble for three empirical reasons: (1) the administrative censoring rate was low (10.1%), limiting information loss; (2) LightGBM demonstrated superior discrimination (AUROC 0.862) compared to CoxBoost alone (AUROC 0.849, Δ = 0.013, P‐value <0.001), capturing non‐linear feature interactions that proportional hazards assumptions may miss; and (3) the meta‐learned optimal weighting was determined empirically on the validation set, allowing appropriate balance between discrimination gains and methodological trade‐offs. Sensitivity analysis confirmed ensemble superiority over survival‐only models (AUROC 0.866 vs. 0.849, Δ = 0.017).
Individual prediction stability assessment
2.15
Following Riley and Collins (2023),27 we assessed individual prediction stability to quantify uncertainty in patient‐level risk estimates. For each patient in the test set, bootstrap prediction intervals, 1000 bootstrap resamples generating a distribution of predicted risks for each individual, prediction interval width, 95% prediction interval (2.5th to 97.5th percentile) as a measure of individual prediction uncertainty. Our stability metrics included the median absolute deviation of bootstrapped predictions, coefficient of variation for individual risk estimates, and proportion of patients with prediction intervals less than five percentage points (indicating high stability). Four subgroup stability analyses, stratification by baseline risk categories to assess whether stability varies by risk level.
RESULTS
3
Study population characteristics
3.1
The final study cohort included a total of 18 742 adult patients with a total recorded number of visits of 42 143 with diabetes mellitus from the PSMMC registry (Table 1). The mean age was 58.8 ± 11.4 years with a median of 59 years (IQR 51–66). Female patients represented 56.8% of the cohort, while male patients formed 43.2%. The majority of patients were Saudi nationals (99.6%), with only 0.4% non‐Saudi patients.
Laboratory variables showed a mean eGFR of 90.0 ± 56.9 mL min^−1^ 1.73 m^2^ with median 92 (IQR 78–102), indicating mostly preserved renal function at baseline. ACR demonstrated significant variability with mean 92.2 ± 420.2 mg g^−1^ and median 17 (IQR 8–32). Glycaemic control was suboptimal, with mean HbA1c of 8.1% ± 1.6% and median 8.0% (IQR 7–9). Anthropometric measurements revealed a mean BMI of 32.2 ± 6.6 kg m^−2^. The study flowchart diagram demonstrates the patient selection and temporal validation approach in compliance with Strengthening the Reporting of Observational Studies in Epidemiology (STROBE) and Transparent Reporting of a multivariable prediction model for Individual Prognosis or Diagnosis (TRIPOD) statements and guidelines (Figure 1).
Study pipeline flowchart diagram.
2We compared our cohort characteristics to the Saudi National Diabetes Registry (SNDR) and Saudi Health Information Survey (SHIS) to assess population representativeness.28, 29, 30, 31 Our PSMMC cohort had a mean age of 58.8 ± 11.4 years (SNDR: 56.2 ± 12.8, SHIS: 57.4 ± 13.1), female proportion of 56.8% (SNDR: 48.3%, SHIS: 52.1%), mean HbA1c of 8.1% ± 1.6% (SNDR: 8.4% ± 1.9%, SHIS: 8.3% ± 1.8%), mean BMI of 32.2 ± 6.6 kg/m^2^ (SNDR: 30.8 ± 7.2, SHIS: 31.4 ± 6.9), and hypertension prevalence of 67.2% (SNDR: 62.4%, SHIS: 64.8%). The slightly higher female proportion reflects military healthcare system demographics that include dependents alongside service members. The similarity in core clinical variables including age, glycaemic control, body mass index, and hypertension prevalence suggests that findings should generalise reasonably to the broader Saudi diabetic population; however, external validation in non‐military healthcare settings is warranted to confirm broader applicability.
External literature sources for synthetic variable priors
3.2
Total of 27 high‐quality external studies were identified and utilised to inform synthetic variable priors through Bayesian MICE imputation (Table 2). These studies included diverse populations including UK Biobank (n = 517 917), Clinical Practice Research Datalink (CPRD) primary care data (n = 1 397 573), and multiple international cohorts ranging from 590 to 33 441 participants. Study designs varied from cross‐sectional studies to long‐term prospective cohorts with follow‐up periods extending up to 13 years.
The studies provided significant prior distributions for family history of CKD (HR 2.04 from REGARDS cohort), chronic NSAID exposure (HR 1.32 from NHIRD Taiwan), socioeconomic deprivation indices, diabetic retinopathy severity gradation with effect sizes [2.9, 5.8, 10.2, 16.6], and antihypertensive medication class distributions. Ethnic differences were well represented across White, Asian, African‐American, and mixed populations, with diabetes prevalence ranging from 5.9% to 100% depending on study‐specific inclusion criteria.
Regarding socioeconomic variable handling, we acknowledge the limited direct transferability of UK‐derived Index of Multiple Deprivation (IMD) to the Saudi Arabian context. Our approach used IMD quintile distributions (uniform 20% per quintile) rather than absolute deprivation scores, assuming relative socioeconomic gradients exist universally. Sensitivity analysis showed minimal model dependence on this variable (with IMD: AUROC 0.852; without IMD: AUROC 0.849, Δ = 0.003), indicating the model's primary strength derives from clinical variables. IMD contributed only 1.4% to overall predictive power. Future model iterations should integrate Saudi‐specific socioeconomic indicators collected prospectively.
Missing data patterns and model optimisation
3.3
Missing data patterns varied across the included variables, with observed variables showing minimal missingness (eGFR 0.07%, ACR 9.5%) while HbA1c demonstrated higher missingness at 38.0% (Table 3). Administrative censoring affected 1895 patients (10.1%) who had not experienced events by the study end‐date but had <36‐month follow‐up; these patients were excluded from binary models (M‐1 to M‐4) but retained in survival models (M‐5, M‐6). All literature‐informed imputed variables were 100% missing by design, requiring literature‐informed Bayesian imputation. The MICE imputation framework achieved excellent convergence with all Gelman–Rubin statistics (R̂) ≤ 1.01 across 20 imputation chains. Hyperparameter optimisation using Optuna's Tree‐structured Parzen Estimator conducted 600 total evaluations (30 trials × 20 imputations), identifying best achievable LightGBM parameters: num_leaves 47 ± 4, max_depth 5 ± 0, learning_rate 0.058 ± 0.006, and min_data_in_leaf 34 ± 7. Class imbalance was addressed through scale_pos_weight adjustment (around 9.5 based on test prevalence). The temporal validation strategy utilised patient‐level chronological splitting with training data ≤December 2021, validation January–June 2023, and testing July–December 2024, to ensure best possible realistic deployment simulation without information leakage.
The 38% HbA1c missingness reflects real‐world clinical practice patterns where well‐controlled patients have less frequent testing. Analysis suggested missing‐at‐random (MAR) mechanism conditional on eGFR, diabetes duration, and medication compliance. We utilised median imputation with missing indicator flags for observed HbA1c values, preserving information content of missingness patterns. Sensitivity analyses demonstrated complete case analysis (patients with observed HbA1c) had AUROC 0.849 versus 0.852 with imputation (Δ = 0.003, P‐value = 0.34). Alternative MICE imputation for HbA1c demonstrated and resulted in AUROC of 0.851 (minimal difference). The HbA1c‐missing flag showed independent predictive value (HR 1.12, P‐value = 0.03), confirming that missingness pattern itself is informative. Despite 38% missingness, HbA1c ranked fifth in clinical importance (7.2% gain), demonstrating sufficient observed data for proper contribution. This approach mirrors clinical deployment scenarios where HbA1c may not always be available to improve real‐world applicability.
Model performance development and comparison
3.4
Six model architectures demonstrated progressive performance improvements through the development pipeline process (Table 4). The baseline elastic‐net logistic regression with observed variables only (M‐1) achieved AUROC 0.803 with AUPRC 0.425. Addition of literature‐informed imputed variables (M‐2) provided minimal improvement (Δ‐AUROC +0.001). Transition to LightGBM architecture (M‐3) demonstrated significant improvements (AUROC 0.842, Δ‐AUROC +0.039, P‐value<0.001). Integration of literature‐informed imputed variables into LightGBM (M‐4) further improved performance (AUROC 0.862, Δ‐AUROC +0.020, P‐value<0.001). The CoxBoost survival model (M‐5) achieved comparable discrimination (AUROC 0.849) with survival‐specific formulation. The final stacked ensemble model (M‐6) combining LightGBM and CoxBoost demonstrated best performance with AUROC 0.866, AUPRC 0.522, and Brier score 0.067, representing statistically significant improvement over M‐4 (Δ‐AUROC +0.004, P = 0.009). The final clinical model achieved C‐statistic 0.852 (95% CI 0.847–0.857) with excellent calibration slope 0.98 and Brier score 0.085. Multi‐trial validation showed consistent performance with pooled C‐statistic 0.852 ± 0.005. Bootstrap optimism correction demonstrated minimal overfitting (0.005), confirming model stability.
ROC curve illustrates the superior discrimination of the final ensemble model compared to component architectures (Figure 2). Model calibration evaluation confirms excellent agreement between predicted and observed risks across the full probability spectrum (Figure 3).
ROC‐curves model comparisons.
Model calibration evaluation for predicted versus observed risk. The calibration plot displays predicted versus observed 36‐month DKD/DN risk. Dashed diagonal line: Perfect calibration (slope = 1.0, intercept = 0.0); Solid blue line: Observed calibration of the final clinical model (slope = 0.98, intercept = −0.012); Blue dots with error bars: Observed event rates in deciles of predicted risk with 95% confidence intervals from Kaplan–Meier estimates; Grey shaded region: 95% confidence band for the calibration line from 1000 bootstrap resamples. The close alignment between the solid line and perfect calibration diagonal demonstrates excellent model calibration. The dots represent empirical validation of predicted risk in patient subgroups, with error bars indicating statistical uncertainty in observed event rates. Y‐axis represents observed 36‐month event rates calculated using Kaplan–Meier estimates in deciles of predicted risk. X‐axis represents mean predicted 36‐month risk within each decile.
Feature importance and algorithmic fairness assessment
3.5
Feature and factor importance assessment revealed intuitive hierarchical contributions to DKD/DN risk prediction (Table 5). eGFR was the most predictive feature with clinical gain 28.4 ± 1.2% and HR 1.24 ± 0.04, followed by ACR (clinical gain 19.7% ± 0.8%, HR 1.30 ± 0.04). Literature‐informed imputed variables demonstrated significant contributions, with diabetic retinopathy severity ranking fourth (clinical gain 8.9% ± 0.3%, HR 3.03 ± 0.40), HbA1c fifth (clinical gain 7.2% ± 0.4%, HR 1.13 ± 0.03), and diabetes duration sixth (clinical gain 6.5% ± 0.2%, HR 1.10 ± 0.03).
Algorithmic fairness assessment across demographic subgroups revealed excellent equity performance. Gender‐based subgrouping showed minimal performance differences (Male AUROC 0.854 vs. Female 0.850, Δ‐AUROC −0.004). Age stratification demonstrated solid performance (≥65 years AUROC 0.857 vs. <65 years 0.847, Δ‐AUROC −0.010). Ethnicity revealed excellent fairness across racial groups with maximum |Δ‐AUROC| = 0.004. CKD stage demonstrated appropriate risk stratification while maintaining fairness across the kidney function spectrum. Intersectionality evaluation identified consistent performance across demographic intersections, maintaining differences within acceptable fairness thresholds (|Δ‐AUROC| ≤ 0.03). Calibration equity remained excellent across all subgroups (slopes 0.97–1.05).
To test and verify for ethnic validity of literature‐informed priors, we implemented a multi‐pronged approach to ensure ethnic applicability of literature‐derived priors. Of the 27 studies used, seven studies included mainly Asian populations, four included multi‐ethnic cohorts with Middle Eastern representation, and 16 were from mainly White populations. We prioritised Asian and multi‐ethnic sources where available. Sensitivity analysis comparing Asian‐specific versus White population versus pooled multi‐ethnic effect sizes showed maximum AUROC variation of 0.003, suggesting robustness. Selected variables represent biological mechanisms (e.g., SGLT2i nephroprotection, ACE/ARB benefits) with consistent effects across ethnicities demonstrated in international trials (CREDENCE, DAPA‐CKD included Middle Eastern sites). For socioeconomic measures, we performed sensitivity analysis excluding these variables (AUROC change <0.005), confirming minimal ethnic bias from this source.
SHAP feature importance visualisation highlights the relevance of top predictive features (Figure 4), with individual patient risk explanation demonstrating model interpretability (Figure 5).
Feature importance SHAP values diagram.
LIME explanation diagram of features.
Model validation and utilisation assessment
3.6
Detailed validation demonstrated excellent model performance across multiple metrics (Table 6). Decision curve revealed superior utilisation compared to treat‐all strategies across risk thresholds from 5% to 25%. Optimal net benefit was achieved at 15% risk thresholds (Δ + 0.024), translating to 22 events prevented per 1000 patients screened at 10% threshold and 12 events prevented per 1000 patients at 20% threshold.
Multi‐trial validation against data reported from four major diabetes trials (ACCORD, UKPDS, ADVANCE, CANVAS) confirmed excellent performance with C‐statistic 0.852 ± 0.005 and consistent calibration across populations. Bootstrap validation with 1000 bias‐corrected accelerated replicates confirmed minimal optimism (0.005) and maintained discrimination. Prior sensitivity analysis demonstrated model significance across odd and complex scenarios, with AUROC variation ≤0.008 across weak priors (50% shrinkage), strong priors (150% amplification), and flat non‐informative priors, confirming validity regardless of literature‐informed assumptions.
Calibration stability remained excellent throughout development with final slope 0.98 and intercept −0.012, closely around the ideal values (1.0, 0.0). Clinical utility metrics showed superior performance: sensitivity 91%/specificity 79% at 10% threshold, sensitivity 84%/specificity 87% at 15% threshold, and sensitivity 76%/specificity 92% at 20% threshold.
We validated imputation accuracy through several methods, first through convergence diagnostics, in which trace plots showed stable mixing, Gelman–Rubin statistics R̂ ≤1.01 for all variables, effective sample sizes over 10 000 for all parameters. Then, distribution validation compared imputed value distributions to literature‐reported distributions (e.g., family history of CKD prevalence: imputed 21.2% vs. literature 21.8%), with all imputed variables within 5% of literature estimates. Posterior predictive checks were approached through generation of datasets from posterior distributions, then compared summary statistics to observed data (Bayesian P‐value = 0.48, indicating good fit). For sensitivity analyses, we performed varied prior strength (50%, 100%, 150% of literature effect sizes), with maximum AUROC variation of 0.008 across scenarios. In addition to that, we utilised complete case comparisons for variables with some observed data, compared imputed vs. observed values (mean absolute error: 12% for medication adherence estimates, correlation r = 0.73). Our approached validation steps confirmed that literature‐informed imputation produced plausible values consistent with external evidence and internal data patterns.
The temporal model development progression illustrates detailed performance improvements during the optimisation pipeline (Figure 6).
Model development progression for temporal performance metrics.
Figure 7 provides a classification plot showing sensitivity and false positive rate conditional on risk thresholds, following recommendations by Verbakel et al.32 for threshold‐specific performance visualisation beyond the AUC‐ROC curve. The plot displays smooth curves generated through monotonic cubic spline interpolation across the full threshold range (0%–100%), with three validation points marked at clinically relevant thresholds. At the 10% risk threshold, the model achieved sensitivity of 91% (95% CI 89%–93%) with a false positive rate of 21% (95% CI 19%–23%). At the 15% threshold, sensitivity was 84% (95% CI 81%–86%) with a false positive rate of 13% (95% CI 12%–15%). At the 20% threshold, sensitivity decreased to 76% (95% CI 73%–79%) while specificity increased significantly, resulting in a false positive rate of only 8% (95% CI 7%–9%).
Model classification plot.
Model deployment and real‐world implementation
3.7
The final validated model was successfully deployed as an interactive web‐based application named PSMMC NephraRisk (https://nephrarisk.streamlit.app/) using the Streamlit framework. The deployment platform provides real‐time risk assessment capabilities with user‐friendly interfaces for healthcare providers to input patient variables and receive immediate three‐year DKD/DN risk predictions. The application utilises the complete M‐6 stacked ensemble model with all 25 features including literature‐informed imputed variables, maintaining identical performance characteristics as demonstrated in validation testing.
The platform includes built‐in model monitoring protocols with automatic drift detection mechanisms, triggering retraining alerts when validation AUROC decreases by over 0.05 or calibration slope falls outside the 0.85–1.15 range. Interactive visualisation components display individual patient risk contributions through SHAP‐based explanations, supporting evidence‐based decision‐making in practice settings. The deployment architecture ensures scalability and maintains data security standards appropriate for healthcare applications, representing successful translation from research development to implementation readiness.
Individual prediction stability
3.8
Individual prediction stability was excellent across the test cohort. The median 95% prediction interval width was 3.2 percentage points (IQR 2.1–4.8), indicating high precision in patient‐level estimates. Exactly 78% of patients had prediction interval widths of <5 percentage points, which was classified as high stability; 19% of patients had widths ranging between 5 and 10 percentage points, classified as moderate stability, and only 3% of patients had widths <10 percentage points, which were classified as low stability. Stability did not vary significantly across baseline risk categories (low risk: 3.1 pp., moderate risk: 3.4 pp., high risk: 3.0 pp., P‐value = 0.31), confirming consistent prediction precision across the risk spectrum. Individual prediction intervals are displayed in the web application to communicate uncertainty levels.
DISCUSSION
4
DKD and DN represent among the most serious complications of diabetes mellitus, affecting around 40% of diabetic patients all over the world and serving as leading causes of ESRD. Despite significant advances in diabetes management and nephroprotective therapies, the burden of DKD/DN continues to escalate globally, highlighting the need for accurate risk stratification solutions that can identify high‐risk patients before irreversible kidney damage occurs.33, 34, 35, 36
Current practice relies on utilisation of markers such as eGFR and albuminuria for DKD/DN risk assessment; however, these methods often fail to capture the complex interplay of demographic and social determinants that impact kidney disease progression. Most current predictive ML models demonstrate moderate discrimination performance with AUROC values ranging from 0.65 to 0.75 and frequently have poor calibration, limiting their effective utilisation for individual patient risk estimation.35, 37, 38, 39, 40, 41, 42
Our study successfully developed and validated a literature‐informed ensemble ML model for three‐year DKD/DN risk prediction using data from a major registry for diabetic patients in Saudi Arabia. Our final stacked ensemble model achieved excellent discrimination with AUROC 0.866 for the ensemble model and C‐statistic 0.852 for the clinical implementation, representing significant improvement over existing methods from previous literature studies. The model demonstrated near‐perfect calibration with slope 0.98, ensuring that predicted risks accurately reflect actual probabilities of developing DKD/DN.
The integration of literature‐informed imputed variables through Bayesian multiple imputation dominated as an innovative approach, contributing significantly to the model's predictive power despite these variables being unavailable in routine practice settings. Feature importance assessment revealed that while markers like eGFR and ACR remained the strongest predictors, literature‐informed imputed variables including diabetic retinopathy severity, diabetes duration, and other literature‐informed factors provided significant additional predictive value.
The model demonstrated excellent algorithmic fairness across demographic subgroups, with performance differences well within acceptable ranges across gender, age, ethnicity, and CKD stages, ensuring equitable application across different patient populations. This equity in performance is important for real‐world deployment, ensuring that the model benefits all patient populations equally.
The discrimination performance achieved in our study at AUROC 0.852 significantly exceeds that reported in previous DKD/DN ML models from literature, which typically achieved AUROC values between 0.65 and 0.75. For every 1000 diabetic patients screened using our model at a 10% risk threshold, 22 cases of kidney disease would be prevented through early intervention compared to standard care strategies.
The excellent calibration achieved at a slope of 0.98 and an intercept of −0.012 addresses a limitation of existing models. While many models focus mainly on discrimination, poor calibration renders individual risk estimates unreliable for decision making. Our model's excellent calibration means that when the model predicts a 15% 3‐year DKD/DN risk, 15% of similar patients will actually develop DKD/DN, allowing for confident management decisions and patient counselling.
The successful integration of literature‐informed imputed variables represents a novel methodological advance with broad applicability. Most of the previous predictive models are constrained by variables available in routine databases, often missing important risk factors such as detailed family history, medication exposure patterns, and socioeconomic determinants. Our utilised approach demonstrates that external evidence can be integrated and included through Bayesian imputation, expanding the scope of prediction models without requiring additional data collection.43, 44, 45
The successful deployment as an interactive web platform PSMMC NephraRisk demonstrates the translation from research focus to practice settings application on a wider term. The platform provides immediate risk assessment with interpretable explanations through SHAP values, allowing us to understand which factors drive individual patient risk. This interpretability is essential for practice‐settings adoption and patient communication, moving beyond black box predictions to transparently offer understandable insights for both physicians and patients.
Several limitations should be acknowledged when interpreting our findings. First, this represents a study based on a registry from tertiary care hospitals and facilities in Saudi Arabia, which may limit generalisability to other healthcare systems, ethnicities, and care settings. While our population included different socioeconomic strata within the Saudi settings, validation in different ethnic populations and healthcare environments is needed to confirm broader applicability.
Second, the retrospective design limits our ability to formulate causality and may introduce selection bias through differential patterns of follow‐up and testing. Patients with more severe diabetes or complications may have more frequent laboratory monitoring, which could possibly be affecting the outcome ascertainment. Also, the three‐year follow‐up period may not capture longer‐term renal disease progression observations and further associated findings on a longer‐term basis.
Third, while our literature‐informed imputation strategy successfully integrated important risk factors, these literature‐informed imputed variables represent modelled rather than directly observed data. However, we demonstrated validity and significance across different prior assumptions; the accuracy of imputed values depends on the applicability of external study findings to our population. Some literature‐informed imputed variables, especially socioeconomic measures, required adaptation from indices developed in different healthcare systems.
Fourth, our stacked ensemble (M‐6) assigns 64% weight to a binary classification component (LightGBM) that excludes the 10.1% of patients with administrative censoring before 36 months. This exclusion of censored patients while retaining those with earlier events may theoretically lead to overestimation of event rates in the binary component; however, the low censoring rate and near‐perfect calibration achieved (slope 0.98, intercept −0.012) suggest this bias is minimal in our cohort. While this censoring rate is relatively low and sensitivity analyses demonstrated minimal performance impact (complete‐case AUROC 0.859 vs. full‐cohort 0.852), this approach may be suboptimal in settings with higher censoring rates. In populations with substantial censoring (>20%), we recommend using the survival‐only model (M‐5, CoxBoost, AUROC 0.849) rather than the ensemble to ensure appropriate handling of incomplete follow‐up data.
Fifth, certain possible important predictors were not available in our dataset, including genetic markers and detailed patient‐reported outcomes such as exact drug class, dosing, frequency, and other considerations that we were unable to integrate successfully into our model given the inherent limitations of our ensemble‐based methodology that does not capture all data with certain proposed limitations. The model's performance might be further improved by integrating these additional risk factors when available; however, the current literature evidence regarding these datapoints was not included in our model development as we found them classified as lower‐quality studies that could introduce the risk of certain biases to our model transparency, so we avoided including them.
Also, it is important to mention that while we implemented temporal validation to simulate real‐world deployment, the model requires prospective validation to confirm performance in actual practice in real‐world settings on a better basis. As possible changes in care patterns, population demographics, or disease prevalence over time may affect model performance and necessitate periodic recalibration.
Based on our findings and limitations, several directions warrant priority attention. First, external validation studies should be conducted across multiple different healthcare organisations and healthcare systems, either locally in Saudi Arabia, the Middle East region, or internationally from different healthcare systems all over the world, ethnic populations, and geographic regions to assess model generalisability and identify population‐specific modifications. Special attention should be given to validating performance in healthcare systems with different diabetes management protocols and patient populations with varying baseline risks and different management protocols.
Second, prospective validation studies should be applied to confirm model performance in real‐world practice and assess the impact of model‐guided interventions on patient outcomes. These studies should evaluate not only prediction accuracy but also model utilisation, including healthcare provider adoption rates, changes in management decisions, and the improvements in patient outcomes from applied early intervention.
Third, the methodology for literature‐informed synthetic variable imputation should be expanded and structured for broader application in prediction modelling. Development of standardised methods for identifying relevant external studies, specifying prior distributions, and validating imputation accuracy would facilitate adoption of this technique across different domains.
Fourth, integration with newer additional data sources should be explored, including continuous glucose monitoring data, wearable device metrics, electronic health record natural language processing, and genomic information. These additional data streams may further improve prediction accuracy and allow for more personalised risk assessment, if collected on a high‐quality proper basis.
Fifth, implementation‐based studies should investigate additional strategies for deploying ML‐based risk prediction tools in practice settings, including healthcare workers' training needs, workflow integration challenges, and patient communication strategies. Understanding barriers to adoption and developing effective implementation strategies will be of significant importance for translating the studies' advances into improved patient care.
Finally, long‐term studies should assess the impact of model‐guided risk stratification on healthcare costs, resource utilisation, and patient quality of life. Economic evaluations will be essential for supporting healthcare system adoption and policy decisions regarding ML‐based decision support systems.
Our study demonstrates that integrated ML approaches combined with risk factor integration can significantly improve DKD/DN risk prediction accuracy and utilisation. The successful deployment as an interactive platform provides a solid foundation for broader implementation and continued refinement based on real‐world experience. These advances represent important steps toward personalised, data‐driven approaches to DKD/DN prevention and management.
CONCLUSIONS
5
Our study successfully developed and validated a literature‐informed ensemble‐based ML model for 3‐year DKD/DN risk prediction that significantly advances current prediction capabilities. The final stacked ensemble model achieved excellent discrimination of AUROC 0.866 and the clinical implementation achieved C‐statistic 0.852 with near‐perfect calibration of slope 0.98, translating to significant clinical utility with 22 kidney disease events prevented per 1000 patients screened. The innovative integration of literature‐informed imputed variables through Bayesian MICE expanded the model's predictive scope beyond routinely available data, while multi‐trial validation demonstrated significant generalisability across different populations and treatment manners. Excellent algorithmic fairness across demographic subgroups ensures equitable application, while the successful deployment as an interactive web platform demonstrates practical implementation readiness. Our proposed methodology and framework provide a foundation for broader implementation of evidence‐driven risk stratification in diabetes care, with promising possibilities for adaptation across different healthcare systems and clinical domains. Further validation in different populations, settings, healthcare systems and prospective clinical studies will be important to fully realise the model's potential for improving DKD/DN prevention and patient outcomes.
AUTHOR CONTRIBUTIONS
A.M.T. contributed to conceptualisation, methodology, data curation, formal analysis, and writing of the original draft; T.J.A. contributed to data curation, validation, methodology, and review and editing of the manuscript; A.A.A. contributed to software development, data curation, formal analysis, and visualisation; I.M.Y. contributed to methodology, validation, formal analysis, and review and editing; F.S.A. contributed to software development, visualisation, data curation, and methodology; A.Y.A. contributed to modelling development, study pipeline, machine learning expertise, software development, conceptualisation, methodology, supervision, project administration, validation, formal analysis, writing of the original draft, review and editing, and correspondence for the entire clinical development, scientific development and property for the framework pipeline development. All authors read and approved the final manuscript.
FUNDING INFORMATION
This study received no specific grant from any funding agency in the public, commercial, or not‐for‐profit sectors.
CONFLICT OF INTEREST STATEMENT
The authors declare that they have no competing interests.
ETHICS STATEMENT
The study protocol was approved by the institutional review board of Prince Sultan Military Medical City (PSMMC). Informed consent was waived for this registry‐based analysis due to the retrospective nature of the study and use of de‐identified data.
CONSENT
The authors have nothing to report.
Supporting information
Table S1. Complete feature definitions and specifications.
Table S2. Individual prediction stability assessment.
Table S3. Detailed sensitivity analysis results.
The reference list from the paper itself. Each links out to its DOI / PubMed record.
- 1Janota‐Sosińska O , Mantovani M , Irlik K , et al. Diabetic kidney disease phenotypes and the risk of cardiovascular events: the Silesia diabetes‐heart project. Cardiovasc Diabetol. 2025;24:305. doi:10.1186/s 12933-025-02852-z 40739504 PMC 12312546 · doi ↗ · pubmed ↗
- 2Mc Donnell T , Kalra PA , Vuilleumier N , et al. The impact of primary renal diagnosis on prognosis and the varying predictive power of albuminuria in the NUR Tu RE‐CKD study. Am J Nephrol. 2025;56:1‐12. doi:10.1159/000541770 39369692 PMC 11812588 · doi ↗ · pubmed ↗
- 3Kalhan TA , Luo M , Chai JH , et al. Health economic evaluation of a risk‐stratified intervention in diabetic kidney disease. Diabetologia. 2025;68(10):2227‐2239. doi:10.1007/s 00125-025-06498-0 40739365 · doi ↗ · pubmed ↗
- 4Helou N , Dwyer A , Shaha M , Zanchi A . Multidisciplinary management of diabetic kidney disease: a systematic review and meta‐analysis. JBI Database System Rev Implement Rep. 2016;14:169‐207. doi:10.11124/jbisrir-2016-003011\27532796 · doi ↗ · pubmed ↗
- 5Allen A , Iqbal Z , Green‐Saxena A , et al. Prediction of diabetic kidney disease with machine learning algorithms, upon the initial diagnosis of type 2 diabetes mellitus. BMJ Open Diabetes Res Care. 2022;10(1):e 002560. doi:10.1136/bmjdrc-2021-002560 PMC 877242535046014 · doi ↗ · pubmed ↗
- 6Jiang S , Xu L , Li C , et al. Development and validation of risk prediction models for acute kidney disease in gout patients: a retrospective study using machine learning. Eur J Med Res. 2025;30:660. doi:10.1186/s 40001-025-02939-z 40702529 PMC 12285073 · doi ↗ · pubmed ↗
- 7White N , Parsons R , Collins G , Barnett A . Evidence of questionable research practices in clinical prediction models. BMC Med. 2023;21:339. doi:10.1186/s 12916-023-03048-6 37667344 PMC 10478406 · doi ↗ · pubmed ↗
- 8Chen L , Shao X , Yu P . Machine learning prediction models for diabetic kidney disease: systematic review and meta‐analysis. Endocrine. 2024;84:890‐902. doi:10.1007/s 12020-023-03637-8 38141061 · doi ↗ · pubmed ↗