Performance of a two-item sleep quality measure (PSQI-2): a comprehensive evaluation in a multiethnic cohort (MESA Study)
Luiz Menezes-Júnior

TL;DR
This study evaluates a shortened version of a sleep quality measure and finds it performs well in identifying poor sleep quality across a diverse population.
Contribution
The PSQI-2 is validated as a brief yet effective alternative to the full PSQI for assessing sleep quality in multiethnic populations.
Findings
The PSQI-2 strongly correlates with the full PSQI (r = 0.520) and identifies similar patterns of poor sleep quality.
PSQI-2 shows good discriminant validity with AUC values between 0.748 and 0.785 for different cutpoints.
The PSQI-2 is effective in identifying demographic and clinical risk factors for poor sleep quality.
Abstract
To evaluated the abbreviated two-item Pittsburgh Sleep Quality Index (PSQI-2) against the full PSQI in a multi-ethnic cohort. We analyzed data from 2,237 participants from the MESA Sleep Ancillary Study. The full PSQI was adapted by integrating actigraphy data for sleep duration, latency, and efficiency components, while maintaining the original seven-component structure scored 0–3. The PSQI-2 was derived from two components: sleep duration (questionnaire-based) and subjective sleep quality. Validation analyses included correlation analysis; ROC curves for three PSQI cutpoints (> 5, > 7, >10) with sensitivity/specificity calculations, Bland-Altman analysis for agreement, bootstrap internal validation, and logistic regression for demographic, clinical, and sleep-related covariates. Poor sleep quality was prevalent (65.6% by PSQI > 5; 65.7% by PSQI-2 > 1). The PSQI-2 showed strong…
Genes, proteins, chemicals, diseases, species, mutations and cell lines named across the full text — each resolved to its canonical identifier and authoritative record.
Click any figure to enlarge with its caption.
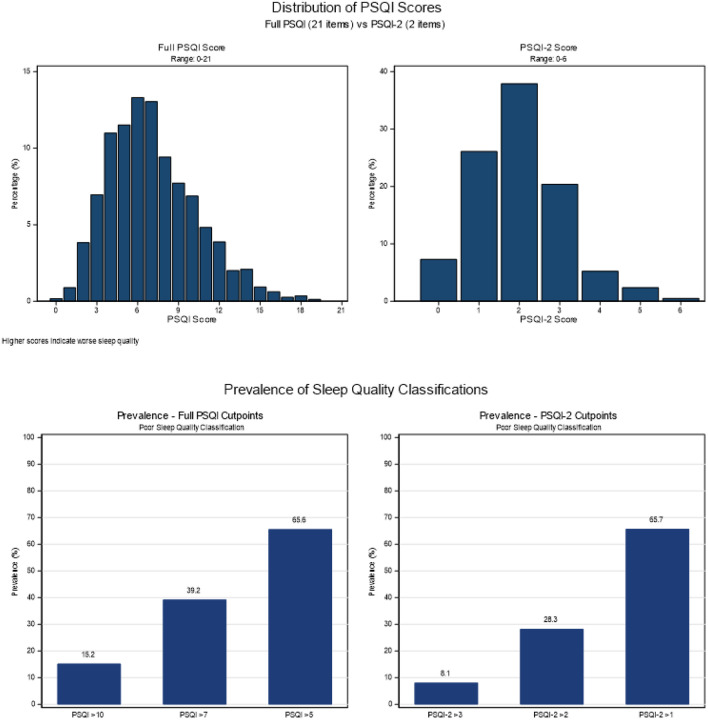 Figure 1
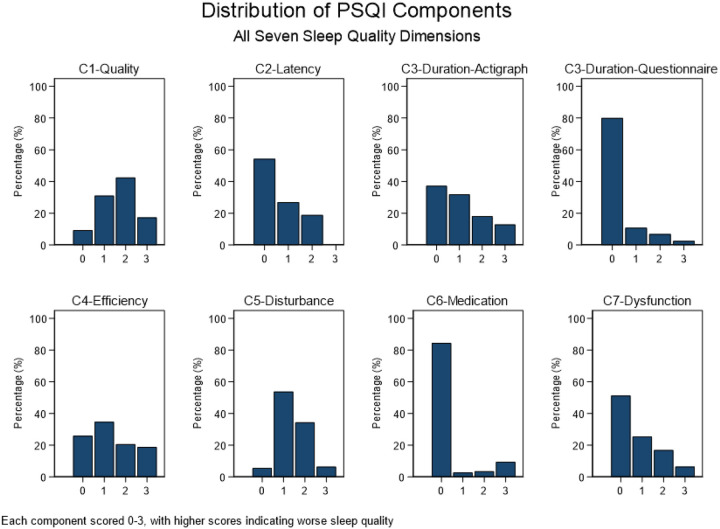 Figure 2
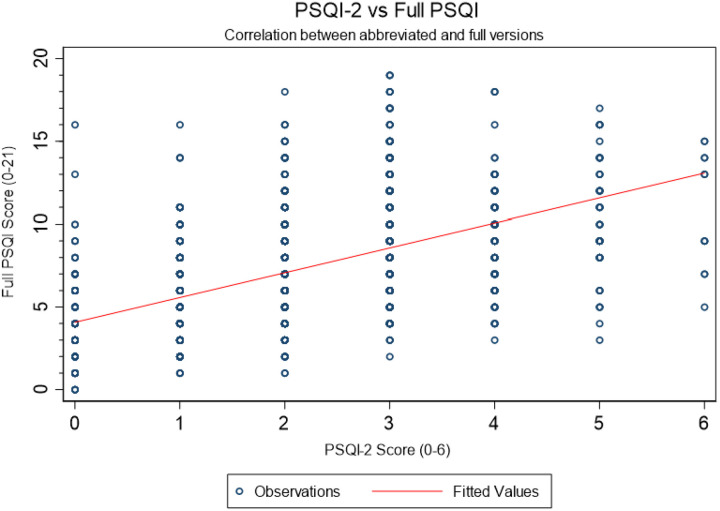 Figure 3
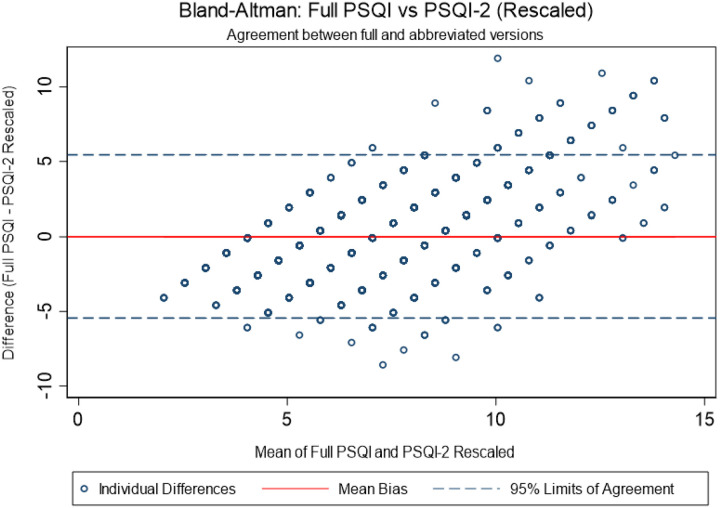 Figure 4
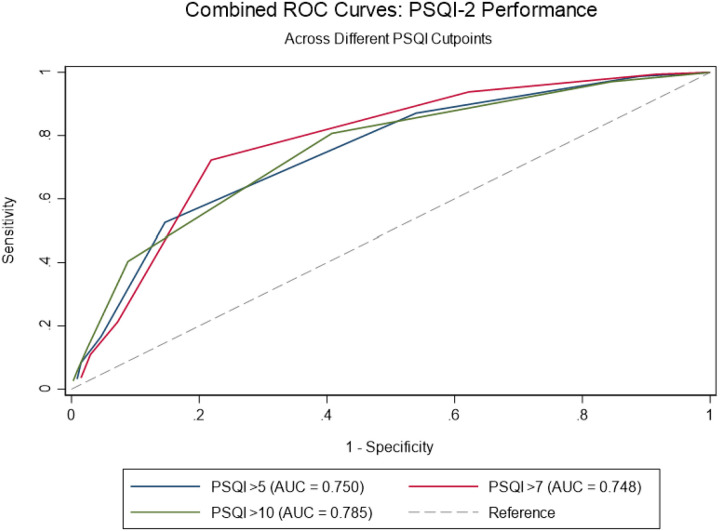 Figure 5
Peer Reviews
No public reviews on file for this paper yet. If you reviewed it on a platform where reviews are public (OpenReview, ICLR, NeurIPS, ICML), you can paste yours below so the community can read it here.
Videos
No videos yet. Explain this paper in a talk, walkthrough, or lecture? Add one.
Taxonomy
TopicsSleep and related disorders · Sleep and Work-Related Fatigue · Obstructive Sleep Apnea Research
Background
Sleep quality is a fundamental pillar of human health, and its impairment is a significant public health concern associated with a wide range of adverse outcomes, including non-communicable chronic diseases, metabolic disorders, and cognitive decline [1, 2]. The Pittsburgh Sleep Quality Index (PSQI), developed by Buysse et al. (1989), has been established as a gold-standard self-report instrument for evaluating sleep quality in both clinical and research settings [3]. Its reliability and validity have been examined in diverse populations [4–6], confirming its utility while also revealing that its psychometric properties can be optimized in specific groups [7].
Despite its widespread use, the comprehensive nature of the 19-item PSQI presents practical limitations. In large-scale epidemiological studies that simultaneously investigate multiple health domains, extensive questionnaires can lead to respondent fatigue, increased missing data, and ultimately, constraints on the breadth of research [8, 9]. This challenge has spurred the development and validation of abbreviated instruments, such as the two-item PSQI (PSQI-2), which focuses on the core dimensions of sleep duration and subjective sleep quality [10, 11]. In a population-based household survey in Brazil, psychometric analyses supported a two-factor structure based on PSQI items, with excellent internal consistency, clear gradients in poor sleep prevalence across score levels, and good concurrent and known-group validity [10]. More recently, validation in the MrOS Sleep Study extended this evidence to a longitudinal context among community-dwelling older men, showing strong agreement with the full PSQI, excellent discriminatory accuracy, moderate test–retest reliability, and good responsiveness to clinically meaningful changes in sleep over time [11]. Together, these findings support the PSQI-2 as a valid, reliable, and pragmatic alternative for sleep quality assessment in large-scale epidemiological and longitudinal studies.
Therefore, the brevity of such tools makes them particularly suitable for large studies where time and questionnaire space are limited. However, the performance of these short forms, especially in diverse, multi-ethnic populations and against objective sleep measures, requires further robust characterization [12]. The Multi-Ethnic Study of Atherosclerosis (MESA) Sleep Ancillary Study provides an ideal platform to address this research gap. MESA itself is a landmark, prospective cohort study initiated by the National Heart, Lung, and Blood Institute (NHLBI) in 1999–2000 to investigate the prevalence, correlates, and progression of subclinical cardiovascular disease in a sex-balanced, multi-ethnic cohort [13]. The MESA Sleep Ancillary Study augmented this rich dataset with a comprehensive sleep assessment protocol, including 7-day actigraphy, in addition to self-report questionnaires [14]. This unique combination of subjective and objective sleep data within a large, community-dwelling, multi-ethnic population offers an unparalleled opportunity to validate an abbreviated sleep instrument against a robust criterion standard.
Therefore, this study aims to validate an adapted version of the PSQI-2 within the MESA Sleep study. We will examine its psychometric properties, diagnostic accuracy against the full PSQI, and its relationship with key demographic, clinical, and objective sleep measures.
Methods
Study population and design
The Multi-Ethnic Study of Atherosclerosis (MESA) is a prospective cohort study sponsored by the National Heart, Lung, and Blood Institute (NHLBI). Its primary goal is to investigate risk factors for the development and progression of subclinical cardiovascular disease in a diverse population [13]. The datasets analyzed for this study were provided by the National Sleep Research Resource (Sleep Data, https://sleepdata.org) [15].
The study began in 1999–2000, enrolling 6,814 participants aged 45–84 years who were free of clinically diagnosed cardiovascular disease at baseline. Participants were recruited from six field centers across the United States: Baltimore, MD; Chicago, IL; Los Angeles, CA; New York, NY; Saint Paul, MN; and Winston-Salem, NC. A key strength of MESA is its deliberate inclusion of a multi-ethnic population, with the cohort comprising White, Black, Hispanic, and Chinese-American individuals. Participants have undergone serial clinical examinations, with the most recent (the seventh exam) being conducted from 2022 to 2024. Between exams, annual follow-up contacts are conducted to assess clinical cardiovascular events and other health outcomes [13].
The MESA Sleep Ancillary Study was conducted to examine the relationships between sleep characteristics and cardiovascular disease risk. Data collection for this ancillary study occurred in close temporal proximity to the MESA Exam 5 (2010–2013) [14]. Out of the 4,077 participants who attended Exam 5, 2,261 individuals were enrolled in the MESA Sleep Ancillary Study and provided objective and subjective sleep data. Our present analysis focuses on the subset of these participants who completed the relevant sleep questionnaires and objective measurements.
A major strength of the MESA Sleep study is its multi-method assessment of sleep, which includes for this study: Actigraphy, with participants wore an Actiwatch Spectrum (Philips Respironics) on the non-dominant wrist for 7 consecutive days to objectively estimate habitual sleep patterns, including sleep duration, sleep efficiency, and night-to-night variability in sleep timing, in their home environment [14]. Furthermore, participants completed self-report questionnaires, including the Women’s Health Initiative Insomnia Rating Scale (WHIIRS), Epworth Sleepiness Scale (ESS), Modified Horne-Ostberg Morningness-Eveningness Questionnaire (MEQ) and other instruments assessing sleep disorder screening, captures self-reported physician diagnoses of specific sleep disorders.
Variables
Sleep quality
Full sleep quality questionnaire
The standard PSQI was not administered in the MESA Sleep Ancillary Study, therefore, an adapted measure of full sleep quality was constructed. This adaptation leveraged core sleep domains assessed by the study’s existing validated questionnaires. Thus, the questionnaire was developed to mirror the structure and scoring of the original instrument while also leveraging the unique strengths of the dataset, which included both self-reported questionnaire data and objective actigraphy measures. The primary goal was to create a composite sleep quality score that integrated subjective perceptions with behavioral sleep patterns.
The full PSQI was constructed to comprise the same seven components as the original PSQI, each scored on a 0–3 scale, where 0 indicates no difficulty and 3 indicates severe difficulty.
Subjective sleep quality was directly derived from the question assessing overall typical night’s sleep (typicalslp5). The original 5-point scale was recoded to the PSQI’s 4-point scale (0–3), consolidating the two poorest categories into a single top score. Sleep latency was calculated by integrating both questionnaire and actigraphy data to capture the multifaceted nature of sleep onset difficulty. Initially, a weighted average of weekly sleep onset latency was calculated from weekday (avgonsetlatencywd5) and weekend (avgonsetlatencywe5) data. This continuous measure (in minutes) was then categorized into PSQI scoring bands. Furthermore, the frequency of self-reported trouble falling asleep (trbleslpng5) was scored on a 0–3 scale. The final sleep latency component score was generated by summing the actigraphy and questionnaire scores and recategorizing the combined value.
For sleep duration, objective actigraphy data was prioritized for this component to reflect actual sleep time rather than time in bed. Therefore, a weighted average of weekly total sleep time was calculated from weekday (avgmainsleepwd5) and weekend (avgmainsleepwe5) data. This value was then scored based on the established PSQI criteria. Sleep efficiency, defined as the ratio of total sleep time to total time in bed multiplied by 100, was directly obtained from the actigraphy-derived variable (slp_eff5). This objective measure was then scored using the standard PSQI thresholds.
Sleep disturbances was constructed from the frequency of six specific sleep problems reported in the questionnaire: trouble falling asleep (trbleslpng5); waking up in the middle of the night (wakeup5); waking up too early (wakeearly5); trouble getting back to sleep after waking up (bcksleep5); snoring (snored5); and stopping breathing during sleep (stpbrthng5).
Each disturbance was scored on a 0–3 scale based on its frequency. The sum of these six scores was calculated, and since the adapted scale had a lower maximum (18) than the original PSQI (27), the scoring thresholds were proportionally adjusted to maintain a 0–3 component score.
Use of sleep medication, was evaluated with the frequency of sleeping pill use (slpngpills5) was directly scored on the 0–3 scale. Finally, the daytime dysfunction and sleepiness, was evaluated by combining daytime sleepiness, with the frequency of feeling overly sleepy during the day (sleepy5); and frequency of sleep difficulties causing irritability (irritable5).
Each was scored on a 0–3 scale. The sum of these two scores was then recategorized to generate the final component score, ensuring it remained on the standard 0–3 scale.
The global full PSQI score was computed as the sum of the seven component scores, with a higher score indicating worse sleep quality. The traditional cut-off of > 5 was used to classify participants as having “poor” sleep quality.
PSQI-2
The PSQI-2 development followed the conceptual framework proposed by Menezes-Júnior et al. (2025). The two-component structure comprised sleep duration (identical to component 1 of the full adapted PSQI) and subjective sleep quality (derived from typicalslp5, identical to component 4 of the full PSQI). This approach aligns with the theoretical foundation that these two domains capture the essential elements of sleep quality assessment. The PSQI-2 score ranged from 0–6, with the established cutoff of ≥ 2 indicating poor sleep quality, consistent with validation studies in other populations [10]
Coviariates
The analysis adjusted for a comprehensive set of covariates known or suspected to be associated with sleep quality and health outcomes. Sociodemographic characteristics included sex (female, male), age group (54–64 years, 65–74 years, 75 + years), and self-reported race/ethnicity (White, Black, Hispanic, Chinese-American). Employment status was detailed by assessing whether participants were currently working and, if so, their predominant work shift (daytime, night/rotating, irregular), with a distinct category for those not in the workforce. Behavioral and health-related factors accounted for were current smoking status (yes, no), categorized further into never, former, or current smoker, and body mass index (BMI) categorized as normal, overweight, or obese. Additional behavioral covariates included the habit of taking regular naps (yes, no) and the use of a CPAP or BiPAP machine for sleep-disordered breathing (yes, no). Furthermore, the model adjusted for several key sleep-related conditions and traits, namely the presence of clinically significant insomnia, restless legs syndrome, a prior diagnosis of sleep apnea, and excessive daytime sleepiness. Finally, to account for individual differences in circadian preference, chronotype was also included as a covariate, classified as morning, intermediate, or evening type.
Statistical analysis
Our validation approach employed comprehensive psychometric analyses following established guidelines for instrument validation. All analyses were conducted using Stata version 17 (StataCorp, College Station, TX).
The analysis proceeded in two sequential phases. The first phase focused on descriptive characterization, data preparation, and internal consistency assessment. We examined distributional properties of both PSQI instruments using histograms and formal normality testing (Shapiro-Wilk tests). Prevalence estimates of poor sleep quality according to various definitions provided context for the clinical relevance of findings. Component-level analyses included examination of the distribution and intercorrelation of PSQI-2 components, assessing the fundamental structure of the abbreviated instrument. Internal consistency reliability was evaluated using Cronbach’s alpha and McDonald’s omega coefficients for the full PSQI, with values ≥ 0.70 considered indicative of acceptable reliability.
The second phase encompassed psychometric validation. Concurrent validity assessment included Pearson correlations between full PSQI and PSQI-2 scores, with supplementary linear regression modeling the functional relationship between instruments. Scatter plots with regression lines provided visual representation of this relationship. Agreement between instruments was quantified using Bland-Altman analysis with regression-based rescaling of the PSQI-2 to the PSQI metric, calculating mean bias, standard deviation of differences, and 95% limits of agreement. This approach acknowledges the different scaling of the two instruments while enabling direct comparison.
Diagnostic performance evaluation employed receiver operating characteristic (ROC) analysis using the full PSQI cutoffs (> 5, > 7, >10) using logistic regression. The area under the receiver operating characteristic curve (AUC) was calculated with cluster bootstrapping to derive confidence intervals. Recognizing the importance of instrument performance across demographic groups, we conducted stratified analyses by gender and age (using median split).
Results
Sample characteristics
3.1
Table 1 presents the prevalence and 95% confidence intervals (CI) for sociodemographic, health, and sleep-related characteristics of the MESA Sleep cohort (n = 2,237), stratified by sleep quality according to the PSQI (> 5) and PSQI-2 (> 1) thresholds. The sample was composed predominantly of women (53.6%), participants aged 54–64 years (36.2%), and racially diverse groups including 37.1% White, 27.5% Black, 23.5% Hispanic, and 11.9% Chinese-American. Obesity affected 35.5% of the sample, and 6.7% were current smokers. Sleep disorders were frequently self-reported: 9.0% had a diagnosis of sleep apnea, 6.6% insomnia, and 4.7% restless legs syndrome. Excessive daytime sleepiness was reported by 13.8%, and 7.4% identified as having an evening chronotype. Approximately 59.9% of participants reported regular napping (Table 1).
Sleep quality
3.2
Distributions of PSQI components and total scores are illustrated in Figs. 1–2. The mean full PSQI score was 7.1 (SD = 3.2, range: 0–19), and the abbreviated PSQI-2 showed a mean score of 2.0 (SD = 1.1, range: 0–6). Overall, 65.6% of participants had poor sleep quality by the PSQI (> 5), while 65.7% met the cutoff for reduced sleep quality by the PSQI-2 (> 1) (Fig. 1). Overall, patterns of association between sociodemographic and health variables were consistent for both PSQI and PSQI-2 classifications (Table 1).
Sleep disturbances were the most prevalent PSQI component (94.5% any impairment, 40.7% moderate-severe), followed by daytime dysfunction (48.7% any, 23.3% moderate-severe) and sleep latency problems (45.8% any, 18.8% moderate-severe). Sleep efficiency impairments affected 39.4% of participants, while 31.0% had problematic sleep duration. Only 23.2% of participants had no impaired components, whereas 21.5% had three or more impaired components. Sleep medication use was least common (15.6% any use, 9.4% regular use) (Fig. 2).
The PSQI-2 showed strong correlation with the full PSQI (r = 0.520, p < 0.001) (Fig. 3), which remained consistent across gender (women: r = 0.523; men: r = 0.516) and age groups (≤ 69 years: r = 0.534; >69 years: r = 0.510). Furthermore, logistic regression analyses revealed similar association patterns across PSQI measures. Significant racial disparities existed, with Black and Hispanic participants showing 40–47% higher odds of poor sleep. Obesity, sleep disorders (insomnia, restless legs, apnea), daytime sleepiness, and evening chronotype consistently increased poor sleep odds, with generally stronger effects for the full PSQI. Only age associations diverged between measures (Table 2).
Reliability statistics
3.3
Continuous performance metrics assessing the predictive correspondence between PSQI-2 and the full PSQI are displayed in Table 3. The PSQI-2 achieved a Brier Score of 0.185 (95% CI: 0.006–0.188), indicating low overall prediction error. The Mean Absolute Error (MAE = 0.371, 95% CI: 0.019–0.377) and Root Mean Square Error (RMSE = 0.430, 95% CI: 0.075–0.434) also reflected good agreement and stability. The Integrated Discrimination Improvement (IDI = 0.187, 95% CI: 0.002–0.332) supported a high degree of discrimination overlap between the PSQI-2 and full PSQI (Table 3).
A Bland–Altman plot (Fig. 4) demonstrated a negligible mean bias (−0.012) and limits of agreement within ± 1.96 SD, indicating no systematic bias and good concordance across the score range. Furthermore, the ROC curve analysis (Fig. 5) demonstrated that the PSQI-2 showed good discriminant validity for identifying poor sleep quality across different cutpoints of the full PSQI. The area under the curve (AUC) was 0.785 for PSQI > 5, 0.748 for PSQI > 7, and 0.750 for PSQI > 10. At the traditional PSQI > 5 cutpoint, the PSQI-2 > 1 showed sensitivity of 80.4% and specificity of 59.3%, correctly classifying 73.0% of cases. For the PSQI > 7 cutpoint, sensitivity increased to 86.8% while specificity decreased to 46.3%, with 62.1% correct classification. For the most stringent PSQI > 10 cutpoint, the optimal PSQI-2 threshold shifted to ≥ 3, achieving balanced performance with 71.8% sensitivity and 79.1% specificity, correctly classifying 78.0% of cases.
Internal validation by bootstrap resampling (n = 1,000) shows that original Youden Index (0.399 for PSQI-2 > 1) was slightly reduced after bias correction (bootstrap = 0.442), yielding a small bias (0.042) and 95% bias-corrected confidence interval (0.341–0.452) (Table 4).
Discussion
The present study demonstrates that the abbreviated two-item Pittsburgh Sleep Quality Index (PSQI-2) shows strong validity and consistent performance with the full questionnaire of sleep quality in a large, multi-ethnic cohort of middle-aged and older adults. Overall, the PSQI-2 effectively captured poor sleep quality and reproduced key association patterns observed with the full instrument, supporting its utility as a parsimonious measure in both research and clinical contexts where time and respondent burden are critical considerations.
The strong conceptual alignment between the PSQI-2 and the full PSQI supports the premise that subjective sleep quality and sleep duration represent core dimensions of the broader sleep quality construct. This overlap is reinforced by the consistency of associations observed across both instruments with major sociodemographic, clinical, and behavioral factors. Both measures identified higher likelihood of poor sleep among Black and Hispanic participants, corroborating prior evidence of racial and ethnic disparities in sleep health reported in MESA and other population-based studies [16]. Similarly, expected associations with obesity, diagnosed sleep disorders, daytime sleepiness, and evening chronotype were consistently observed, with slightly stronger effects for the full PSQI, as anticipated given its broader scope [1, 2]. These findings support the construct validity of the PSQI-2 as a concise yet informative indicator of sleep quality.
Our findings align with a growing body of literature supporting the use of abbreviated sleep measures tailored to specific research and clinical needs. Since its original development by Buysse et al. [3, 17] the PSQI has become one of the most widely used subjective sleep instruments worldwide. However, accumulating evidence suggests that the PSQI global score may not be strictly unidimensional, with several studies proposing two- or three-factor structures across different populations [7, 17–21]. These observations provide a strong theoretical basis for the PSQI-2, as a carefully selected subset of items focusing on sleep quality and duration may adequately capture essential aspects of perceived sleep disturbance.
Furthermore, the validation of the PSQI-2 has important implications for both epidemiological research and clinical practice. In large-scale cohort studies such as MESA, where extensive phenotyping must be balanced against feasibility and participant burden, the PSQI-2 provides a pragmatic solution for incorporating sleep quality assessment without substantially increasing survey length or respondent fatigue. This is particularly relevant given the growing body of evidence linking poor sleep quality and short sleep duration to adverse cardiometabolic, cognitive, and mental health outcomes, including hypertension, diabetes, cardiovascular disease, depression, and cognitive decline [22, 23]. The use of brief, validated instruments has been repeatedly emphasized as a key strategy to improve sleep surveillance in population-based studies and public health monitoring.
In clinical settings, the PSQI-2 may function as an efficient first-line screening tool for poor perceived sleep quality, enabling early identification of individuals who may benefit from further diagnostic evaluation or targeted interventions [24, 25]. Its brevity and ease of administration make it especially suitable for primary care, geriatric assessments, and outpatient clinics, where time constraints often limit the use of longer instruments. Prior studies have shown that brief sleep screeners can meaningfully improve detection of sleep problems in routine care and support clinical decision-making without compromising validity [25]. Thus, the PSQI-2 bridges an important gap between comprehensive sleep assessment and real-world clinical and epidemiological feasibility, facilitating broader integration of sleep health into research and practice.
Several limitations should be acknowledged. First, the study relied on subjective sleep measures, which may not fully align with objective sleep parameters, although subjective perception remains clinically meaningful. The MESA study collected extensive objective sleep data through polysomnography and actigraphy[22, 23] and future research could explore how the PSQI-2 correlates with these objective measures. Second, the cross-sectional nature of our analysis precludes assessment of test-retest reliability, which would strengthen the validation of the PSQI-2. Third, while the PSQI-2 showed good performance in this multi-ethnic cohort, its performance in other populations should be verified, as sleep perceptions and reporting may vary across different cultural and clinical contexts. Furthermore, the PSQI-2 evaluated in this study is an adaptation derived from the full PSQI rather than an independently administered instrument, which may influence item interpretation. Nevertheless, this also represents a strength, as sleep duration and subjective sleep quality are commonly assessed across epidemiological studies, allowing the PSQI-2 framework to be tested and replicated in diverse datasets. This flexibility also opens opportunities for future research to evaluate alternative PSQI-2 adaptations using the same core items across different study designs and populations.
Despite these limitations, this study has notable strengths, including the large, well-characterized multi-ethnic cohort, the comprehensive psychometric evaluation using multiple complementary methods, and the consistency of findings across key demographic subgroups. The integration of actigraphy data for certain components of the full PSQI adaptation also strengthens the original measure’s objectivity against which the PSQI-2 was validated. Collectively, these results support the PSQI-2 as a valid, efficient, and scalable measure of sleep quality, particularly well-suited for epidemiological studies and clinical contexts where the full PSQI may be impractical.
Conclusion
The PSQI-2 demonstrates strong validity as an abbreviated alternative to the full PSQI in a multi-ethnic cohort, effectively identifying poor sleep quality and maintaining consistent associations with key demographic, clinical, and sleep-related factors. Its brevity and favorable psychometric properties make it suitable for large-scale studies and clinical screening where the full PSQI may be impractical. Future research should explore the longitudinal performance of the PSQI-2, its responsiveness to interventions, and its validity in specific clinical populations. Additionally, comparison with objective sleep measures could further illuminate what aspects of sleep quality are captured by this abbreviated instrument. As sleep health continues to be recognized as essential to overall well-being, efficient and valid assessment tools like the PSQI-2 will play an increasingly important role in both research and clinical practice.
The reference list from the paper itself. Each links out to its DOI / PubMed record.
- 1Philippens N, Janssen E, Kremers S, Crutzen R. Determinants of natural adult sleep: An umbrella review. P Lo S ONE. 2022;17:1–30. 10.1371/journal.pone.0277323. · doi ↗
- 2Li J, Cao D, Huang Y, Chen Z, Wang R, Dong Q, Sleep duration and health outcomes: an umbrella review. Sleep Breath. 2022;26:1479–501. 10.1007/s 11325-021-02458-1.34435311 · doi ↗ · pubmed ↗
- 3Buysse DJ, Reynolds CF, Monk TH, Berman SR, Kupfer DJ. The Pittsburgh sleep quality index: A new instrument for psychiatric practice and research. Psychiatry Res. 1989;28:193–213. 10.1016/0165-1781(89)90047-4.2748771 · doi ↗ · pubmed ↗
- 4Carpenter JS, Andrykowski MA. Psychometric evaluation of the Pittsburgh Sleep Quality Index. J Psychosom Res. 1998;45:5–13. 10.1016/S 0022-3999(97)00298-5.9720850 · doi ↗ · pubmed ↗
- 5Beck SL, Schwartz AL, Towsley G, Dudley W, Barsevick A. Psychometric evaluation of the Pittsburgh Sleep Quality Index in cancer patients. J Pain Symptom Manage. 2004;27:140–8. 10.1016/J.JPAINSYMMAN.2003.12.002.15157038 · doi ↗ · pubmed ↗
- 6Liu X. Reliability and validity of the Pittsburgh Sleep Quality Index. Chin J Psychiatry. 1996;29:103.
- 7Wang L, Wu YX, Lin YQ, Wang L, Zeng ZN, Xie XL, Reliability and validity of the Pittsburgh Sleep Quality Index among frontline COVID-19 health care workers using classical test theory and item response theory. J Clin Sleep Med. 2022;18:541–51. 10.5664/JCSM.9658.34534069 PMC 8805004 · doi ↗ · pubmed ↗
- 8Egleston BL, Miller SM, Meropol NJ. The impact of misclassification due to survey response fatigue on estimation and identifiability of treatment effects. Stat Med. 2011;30:3560–72. 10.1002/sim.4377.21953305 PMC 3552436 · doi ↗ · pubmed ↗