Investigating the relationship between the comb jellyfish, Mnemiopsis leidyi, and the abundance of pathogenic Vibrio spp. and harmful algae species in the Maryland Coastal Bays
Detbra Rosales, Steve Doctor, John M. Jacobs, Tahirah Johnson, Jennifer L. Wolny, Salina Parveen

TL;DR
This study explores how comb jellyfish affect harmful bacteria and algae in Maryland's coastal bays, finding temperature and nutrients as key predictors.
Contribution
The study identifies specific environmental and biological predictors for Vibrio spp. and harmful algal blooms linked to Mnemiopsis leidyi.
Findings
Temperature best predicts total V. vulnificus in M. leidyi tissues.
Total dissolved nitrogen best predicts total V. parahaemolyticus in water.
M. leidyi abundance shows weak positive associations with dinoflagellate and picocyanobacteria biomass.
Abstract
Ctenophores (Mnemiopsis leidyi) release large amounts of nutrients and organic matter that stimulate microbial growth and alter planktonic community composition. We investigated the distribution and abundance of M. leidyi and its association with pathogenic Vibrio and harmful algal bloom (HAB) species at seven sites in the Maryland Coastal Bays (MCBs) between April 2021 and June 2022. Water and M. leidyi samples were collected concurrently with temperature, salinity, dissolved oxygen, nutrient, and turbidity data. M. leidyi was present in both years at all sites but was most abundant in areas with high turbidity (Isle of Wight and Newport Bays). Both V. parahaemolyticus and V. vulnificus were present in M. leidyi tissue and water samples and had a moderate positive association with turbidity. HAB species composition varied significantly between sites, with distinct populations of the…
Genes, proteins, chemicals, diseases, species, mutations and cell lines named across the full text — each resolved to its canonical identifier and authoritative record.
Click any figure to enlarge with its caption.
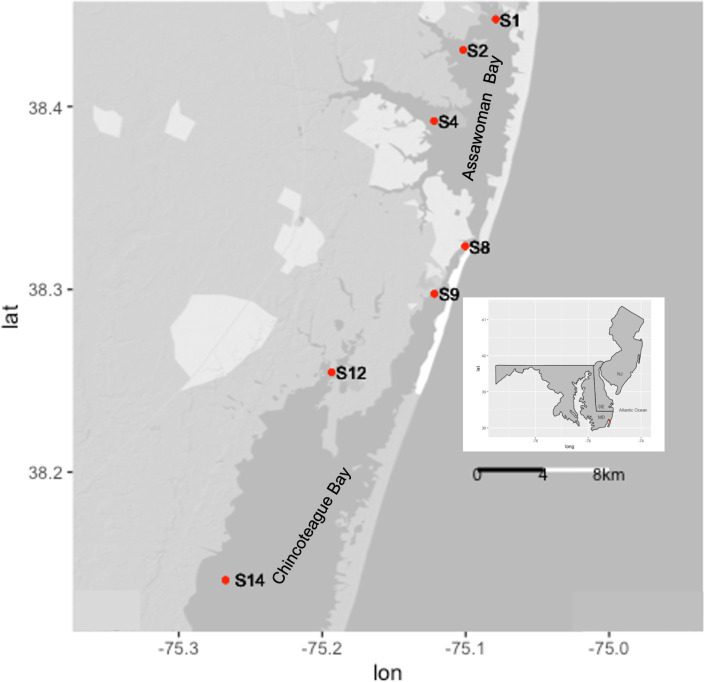 Fig 1
Fig 1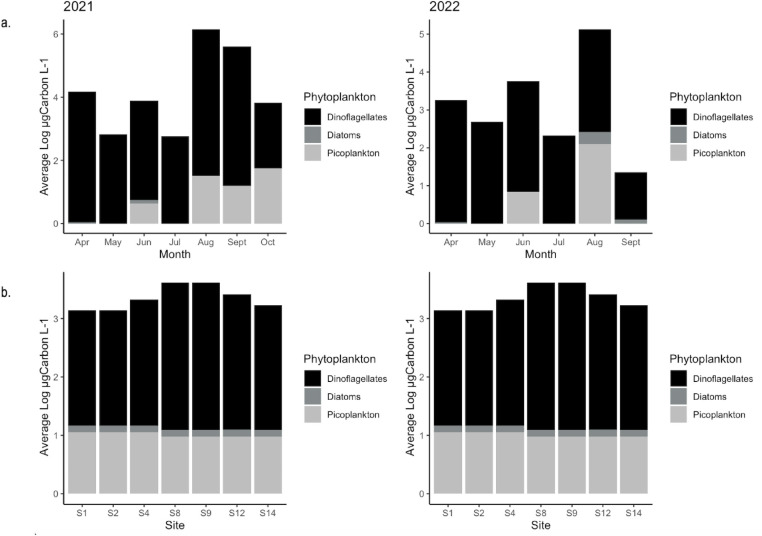 Fig 2
Fig 2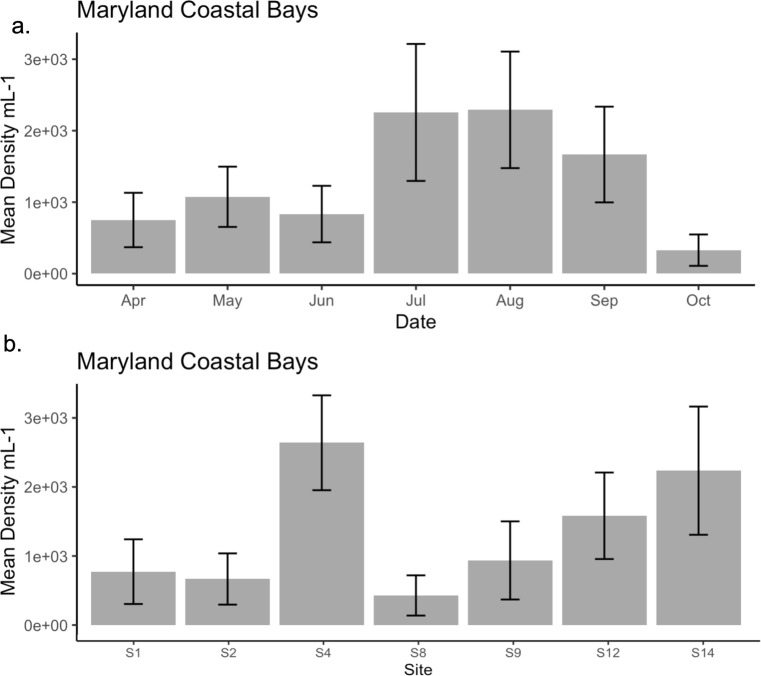 Fig 3
Fig 3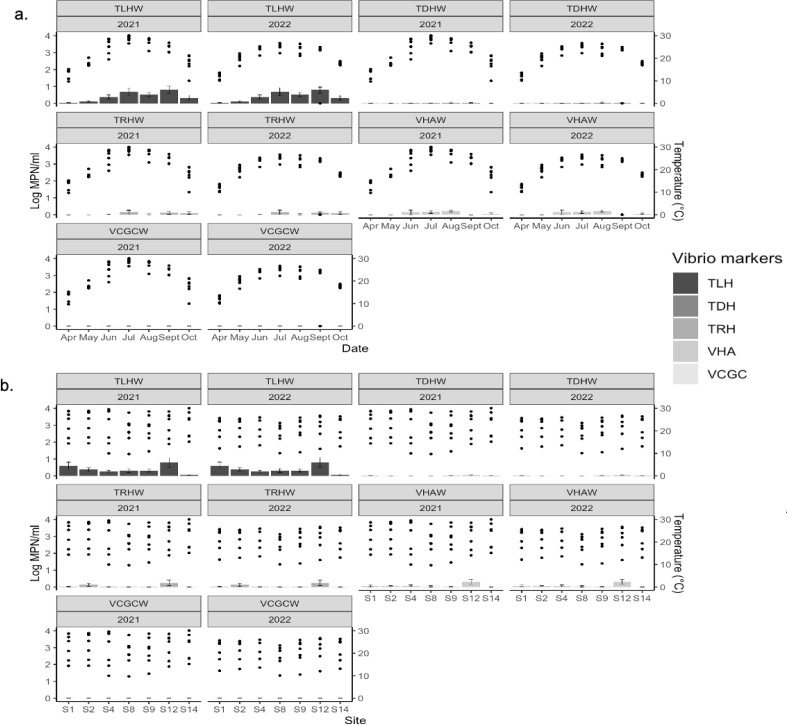 Fig 4
Fig 4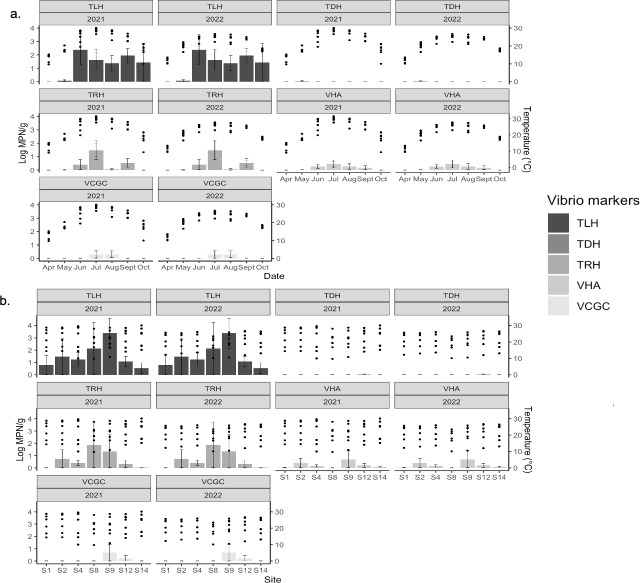 Fig 5
Fig 5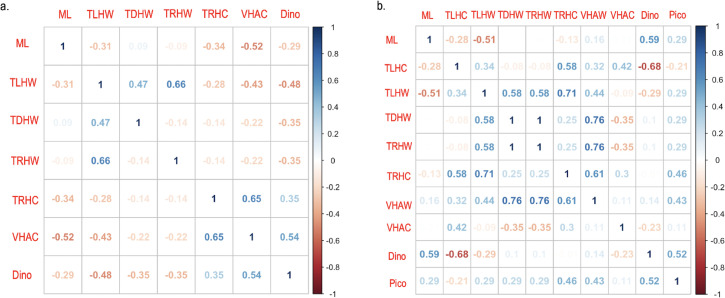 Fig 6
Fig 6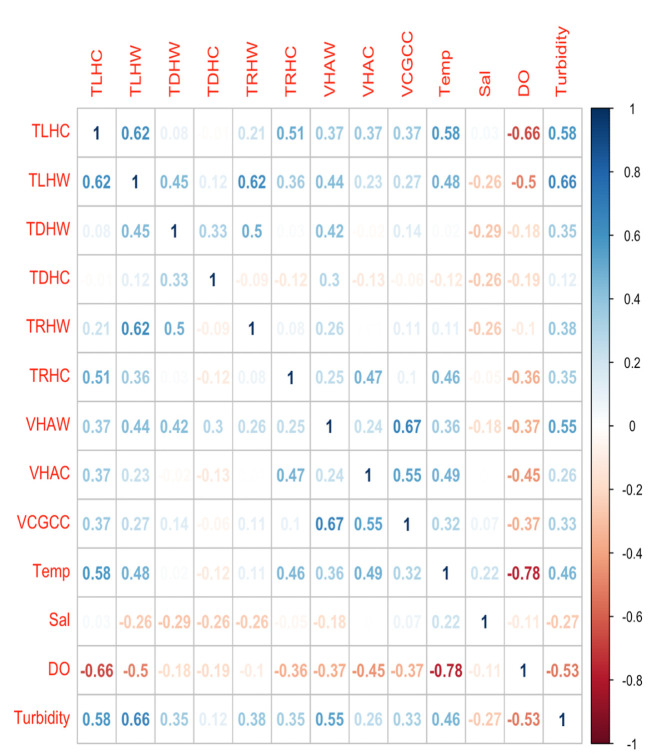 Fig 7
Fig 7| Model no | Explanatory variables | AICc | Delta | Weight | RMSE |
|---|---|---|---|---|---|
| M7 | 31.6 | 0.00 | 0.679 | 0.402 | |
| M10 | 34.5 | 2.86 | 0.163 | 0.402 | |
| Null model | 35.4 | 3.75 | 0.104 | 0.455 | |
| M9 | 37.4 | 5.84 | 0.037 | 0.399 | |
| M8 | 38.9 | 7.30 | 0.018 | 0.382 | |
| Model no | Explanatory variables | AICc | Delta | Weight | RMSE |
| M6 | 98.2 | 0.00 | 0.384 | 1.51 | |
| M7 | 99.6 | 1.47 | 0.184 | 1.66 | |
| Null |
| 99.7 | 1.50 | 0.182 | 1.75 |
| M3 | 101.1 | 2.96 | 0.088 | 1.40 | |
| M5 | 101.2 | 3.07 | 0.083 | 1.61 | |
| M4 | 101.3 | 3.14 | 0.080 | 1.51 | |
| Model no | Explanatory variables | AICc | Delta | Weight | RMSE |
| M6 | 80.6 | 0.00 | 0.357 | 1.05 | |
| Null |
| 80.8 | 0.22 | 0.320 | 1.18 |
| M7 | 82.3 | 1.73 | 0.150 | 1.16 | |
| M4 | 83.4 | 2.84 | 0.086 | 1.04 | |
| M3 | 84.6 | 3.99 | 0.049 | 1.00 | |
| M5 | 85.0 | 4.47 | 0.038 | 1.15 |
| Model no | Explanatory variables | AICc | Delta | Weight | RMSE |
|---|---|---|---|---|---|
| M7 | 0.1 | 0.00 | 0.633 | 0.208 | |
| M5 | 2.6 | 2.75 | 0.160 | 0.207 | |
| M6 | 2.7 | 2.86 | 0.152 | 0.207 | |
| M4 | 5.8 | 5.97 | 0.032 | 0.207 | |
| Null | 7.1 | 7.23 | 0.017 | 0.255 | |
| M3 | 9.3 | 9.46 | 0.006 | 0.207 | |
| Model no | Explanatory variables | AICc | Delta | Weight | RMSE |
| M7 | 53.6 | 0.00 | 0.516 | 0.636 | |
| M5 | 55.6 | 2.01 | 0.189 | 0.624 | |
| M6 | 55.8 | 2.24 | 0.168 | 0.627 | |
| M4 | 56.8 | 3.19 | 0.105 | 0.598 | |
| M3 | 60.4 | 6.80 | 0.017 | 0.598 | |
| Null | 62.8 | 9.20 | 0.005 | 0.814 | |
| Model no | Explanatory variables | AICc | Delta | Weight | RMSE |
| M7 | 19.3 | 0.00 | 0.472 | 0.311 | |
| M5 | 20.0 | 0.76 | 0.322 | 0.297 | |
| M6 | 22.1 | 2.86 | 0.113 | 0.311 | |
| M4 | 23.0 | 3.74 | 0.073 | 0.296 | |
| M3 | 26.2 | 6.94 | 0.015 | 0.293 | |
| Null | 28.0 | 8.77 | 0.006 | 0.394 | |
| Model no | Explanatory variables | AICc | Delta | Weight | RMSE |
| M7 | 70.6 | 0.00 | 0.516 | 0.048 | |
| M5 | 69.7 | 0.90 | 0.189 | 0.046 | |
| M6 | 67.8 | 2.84 | 0.168 | 0.048 | |
| M4 | 67.6 | 3.06 | 0.105 | 0.045 | |
| M3 | 64.1 | 6.55 | 0.017 | 0.045 | |
| Null | 62.6 | 8.03 | 0.005 | 0.060 |
| Maryland Coastal Bays | ||
|---|---|---|
| 2021–2022 | Average 2021 | Average 2022 |
| Dinoflagellate | 1.24 × 10 | 5.80 × 10 |
| Picocyanobacteria | 0 | 0.16 × 10 |
| Diatoms | 5.40 × 10 | 2.90 × 10 |
| | 9.47 | 7.15 |
| Temperature | 22.10 | 20.70 |
| Salinity | 27.00 | 29.30 |
| Dissolved oxygen | 6.55 | 6.50 |
| Turbidity | 10.50 | 8.10 |
| 2021–2022 | Average 2021 | Average 2022 |
| NH4+ | 0.028 | 0.036 |
| NO3-:NO2- | 0.018 | 0.021 |
| TDN | 0.401 | 0.399 |
| PO43- | 0.008 | 0.081 |
| TDP | 0.022 | 0.092 |
| Maryland coastal bays | ||||||||
|---|---|---|---|---|---|---|---|---|
| Values by location | ||||||||
| Sites | S1 | S2 | S4 | S8 | S9 | S12 | S14 | |
|
| 6.23 | 4.54 | 13.10 | 4.79 | 8.36 | 12.10 | 9.29 |
|
| Temperature | 22.10 | 22.30 | 21.30 | 19.4 | 20.80 | 22.20 | 22.20 | 8.1 × 10⁻¹ |
| Salinity | 26.80 | 27.10 | 27.60 | 30.5 | 30.40 | 24.40 | 29.40 |
|
| DO | 6.12 | 6.26 | 6.82 | 6.94 | 6.81 | 6.16 | 6.47 | 5.6 × 10⁻¹ |
| Turbidity | 7.6 | 11.2 | 11.8 | 6.5 | 6.3 | 16.6 | 6.3 |
|
| NH4+ | 0.08 | 0.06 | 0.02 | 0.01 | 0.02 | 0.02 | 0.01 |
|
| NO3-:NO2- | 0.03 | 0.03 | 0.01 | 0.02 | 0.05 | 0.01 | 0.01 |
|
| TDN | 0.58 | 0.58 | 0.04 | 0.21 | 0.25 | 0.54 | 0.31 |
|
| PO43- | 0.04 | 0.03 | 0.01 | 0.04 | 0.05 | 0.06 | 0.07 | 9.1 × 10⁻¹ |
| TDP | 0.06 | 0.06 | 0.04 | 0.50 | 0.03 | 0.04 | 0.11 | 7.6 × 10⁻¹ |
| Water and | ||||||
|---|---|---|---|---|---|---|
| 2021–2022 | ||||||
| Variable | Number positive/total | Percent positive | Min | Max | Average | |
| 64/92 | 70% | 0.01 | 3.72 | 0.40 | ||
| 22/39 | 56% | 0.44 | 4.90 | 1.19 | ||
| 14/92 | 15% | 0.01 | 0.28 | 0.01 | ||
| 2/39 | 0.05% | 0.28 | 1.85 | 0.04 | ||
| 15/92 | 16% | 0.01 | 1.87 | 0.06 | ||
| 11/39 | 28% | 0.49 | 4.06 | 0.36 | ||
| 18/92 | 20% | 0.02 | 1.40 | 0.08 | ||
| 13/39 | 33% | 0.05 | 2.11 | 0.16 | ||
| 1/92 | 1% | 0.00 | 0.03 | 3.26 × 10⁻⁴ | ||
| 3/39 | 8% | 0.30 | 2.04 | 0.010 | ||
| Variable | Avg by year | ||
|---|---|---|---|
| 2021 | 2022 | ||
| 1.50 | 0.50 |
| |
| 0.40 | 0.39 | 4.9 × 10⁻¹ | |
| 0.01 | 0.02 | 3.1 × 10⁻¹ | |
| 0.01 | 0.13 | 6.3 × 10⁻¹ | |
| 0.07 | 0.05 | 7.2 × 10⁻¹ | |
| 0.46 | 0.11 | 5.7 × 10⁻¹ | |
| 0.12 | 0.02 |
| |
| 0.18 | 0.08 | 3.1 × 10⁻¹ | |
| 6.00 | 0.00 | 9.2 × 10⁻¹ | |
| 0.12 | 0.03 | 4.4 × 10⁻¹ | |
| Model no | Explanatory variables | AICc | Delta | Weight | RMSE |
|---|---|---|---|---|---|
| M4 | 24.0 | 0.00 | 0.605 | 0.323 | |
| M2 | 26.9 | 2.90 | 0.142 | 0.394 | |
| M3 | 27.8 | 3.84 | 0.089 | 0.321 | |
| M1 | 27.9 | 3.95 | 0.084 | 0.350 | |
| Null | 28.0 | 4.04 | 0.080 | 0.373 |
- —USDA Evans Allen
- —CREST NSF Post doc fellowship
Peer Reviews
No public reviews on file for this paper yet. If you reviewed it on a platform where reviews are public (OpenReview, ICLR, NeurIPS, ICML), you can paste yours below so the community can read it here.
Videos
No videos yet. Explain this paper in a talk, walkthrough, or lecture? Add one.
Taxonomy
TopicsMarine Invertebrate Physiology and Ecology · Marine Toxins and Detection Methods · Aquatic Ecosystems and Phytoplankton Dynamics
INTRODUCTION
Harmful algal bloom (HAB) and Vibrio spp. outbreak frequency and organism abundances are increasing in the United States (1–3). A similar pattern has been observed over the past decade in the mid-Atlantic region, particularly within the Chesapeake Bay and the Maryland Coastal Bays (MCBs) (4–6 ). This has led to concerns regarding potential human exposure to pathogenic Vibrio spp. that cause gastroenteritis and blood infections and toxin-producing HABs and an increased need for rigorous environmental monitoring and the creation or refinement of organism-specific prediction models (7–9).
The MCBs are composed of numerous shallow, coastal, eutrophic lagoons with restricted water exchange (10, 11). The MCB watershed consists of ~453 km^2^ of mostly agricultural land draining into ~363 km^2^ of bays and tributaries (10, 12). Since the late 1990s, elevated nutrient concentrations have led to recurring HABs, loss of submerged aquatic vegetation, reduced dissolved oxygen concentrations, and overall poorer water quality (6, 13–15). Simultaneously, regional waters have been warming, and blooms of the comb jellyfish, Mnemiopsis leidyi, along with outbreaks of pathogenic Vibrio species, including V. parahaemolyticus and V. vulnificus, and the resulting cases of vibriosis, have been on the rise (16–19). However, studies examining the biological interactions of these three groups and corresponding water quality constituents have been limited.
Vibrio are naturally occurring Gram-negative marine bacteria that are found in diverse habitats ranging from coastal to open waters (20). They can survive as free-living organisms or attached to organic particles and biofilms (8, 21). Vibrio spp. are common components of the MCBs microbial community, with their abundance peaking in the summer (5, 22). Numerous HAB species and M. leidyi populations are present year-round in the MCB, and recent studies indicate that their populations are increasing in this region, with peak abundance occurring in late spring to early summer (6, 14, 23, 24). Of particular concern is a regional increase since 2012 of an exceptionally virulent strain of V. parahaemolyticus (O3:K6) in Maryland waters, along with a high mortality rate (35%) associated with V. vulnificus infections (4).
Temperature and salinity are important drivers for both jellyfish and Vibrio populations. As such, these parameters have been used to create an operational forecasting model for blooms of V. vulnificus and the Atlantic sea nettle, Chrysaora quinquecirrha, in Chesapeake Bay (8, 25, 26). In the MCBs, temperature and salinity also constrain the populations of M. leidyi and Vibrio spp., but other factors can stimulate their abundance, such as nutrient concentrations (2, 27, 28). Because Vibrio spp. can colonize and degrade particulate matter, they play an important role in chemical transformations, including carbon and nutrient cycling (29). Studies (30, 31) suggested that the nutrients that stimulate HABs may also be key to the association between Vibrio spp. and phytoplankton. Similarly, M. leidyi can also impact nutrient and carbon concentrations by grazing on the various microbes that use and recycle these compounds. Due to their affinity for polysaccharides, Vibrio spp. may attach directly to M. leidyi and/or attach to the zooplankton consumed by M. leidyi (8, 32, 33). Thus, the presence of comb jellyfish may be a driver of Vibrio abundance.
While the relationships between Vibrio and HAB species (28, 34, 35) and Vibrio and jellyfish species (32, 36) have been investigated, the synergy between the three groups has not. Therefore, the objective of this study was to identify the distribution and abundance of these three organismal groups in the MCBs. To do this, M. leidyi and HAB species were identified by their morphological characteristics, while V. parahaemolyticus and V. vulnificus were identified using molecular detection of species-specific and pathogenic genes. Additionally, we examined the presence of Vibrio spp. in water and in M. leidyi tissues to determine if a relationship between Vibrio spp., HABs, and M. leidyi existed. Finally, to help refine models used to predict or provide early warnings for the presence of Vibrio spp., we examined whether the presence of M. leidyi or HABs could be used to predict the presence of Vibrio spp. in the MCBs.
MATERIALS AND METHODS
Sample collection and phytoplankton enumeration
A total of 95 water samples, 72 phytoplankton samples, and 43 M. leidyi samples were collected monthly from seven sites in the MCBs (Fig. 1) from April to October in 2021 and 2022 to examine for Vibrio and HAB identification and enumeration. This time period covers spring to autumn and was chosen to capture the variation in M. leidyi and Vibrio abundance, which often increases in the warmer summer months. The study sites, representing the urbanized northern section of the MCBs (sites: S1 and S2 [Assawoman Bay] and S4 [Isle of Wight Bay]) and the rural southern section of the MCBs (sites: S9 [Sinepuxent Bay], S12 [Newport Bay], and S14 [Chincoteague Bay]) separated by Ocean City Inlet (site S8) were chosen based on differences in water quality and relative abundance of M. leidyi and HAB species (10, 14, 37). Temperature, salinity, and dissolved oxygen measurements were collected using a Pro2030 YSI sonde (Yellow Spring Instrument Co., Yellow Springs, OH, USA), and Secchi depths were recorded during each sampling event. Secchi depths were converted to turbidity values (NTU) following Rasmussen et al. (38) with the equation:
Location of sampling sites in the Maryland Coastal Bays: northern bays (Assawoman [sites S1 and S2] and Isle of Wight [site S4]) and southern bays (Sinepuxent [site S9], Newport [site S12], and Chincoteague [site S14]), divided by Ocean City Inlet (site S8).
Surface water grab samples for Vibrio analysis and water chemistry were collected in 1 L Nalgene wide-mouth bottles from depths of less than 1 m. Phytoplankton samples (150 mL) were collected at 0.5 m depth and preserved immediately with 5% Lugol’s iodine solution (#LC156752, LabChem, Zelienople, PA, USA). M. leidyi samples were collected using a semi-balloon trawl net as part of the Maryland Department of Natural Resources trawl survey. Following the methods of Doctor et al. (10), 16 ft semi-balloon otter trawl nets were deployed on the bottom at depths >1.1 m and set for 6 min. After each trawl, 500 mL samples of M. leidyi were collected in 1 L zipper plastic bags, stored in a cooler with ice, and processed within 6 h of collection.
Phytoplankton samples, with a focus on HAB species identification and enumeration, were examined using an Olympus CKX41 inverted microscope (Olympus America, Center Valley, PA, USA), following the modified Utermöhl method described by Marshall and Alden (39). The HAB species identified in this study correspond to those reported in Glibert et al. (13), Tango et al. (40), and Wolny et al. (14). All HAB species were identified to the lowest taxon possible using the above-mentioned references in addition to Tomas (41), Steidinger et al. (42), Phlips et al. (43), and Tillmann et al. (44). Cell concentrations were recorded as cells per liter and converted to biomass using the formulae in Hillebrand et al. (45) or Olenina et al. (46). For the purpose of this study, we identified bloom concentrations consistent with regional thresholds proposed by Marshall et al. (47) and Marshall and Egerton (48): dinoflagellate blooms at 10^5^ cells L^−1^, diatom blooms at 10^5^ cells L^−1^, and picoplankton at 10^7^ cells L^−1^, with some species-specific exceptions.
Quantification of Vibrio parahaemolyticus and V. vulnificus
Both water and M. leidyi samples were processed for most probable number (MPN) analysis in triplicate following the three-tube method of Esteves et al. (49) and Blodgett (50). MPN based on the US Food and Drug Administration’s Bacteriological Analytical Manual (BAM) was used to calculate the abundance of V. parahaemolyticus and V. vulnificus Blodgett (50). M. leidyi samples were poured into a sterile strainer, and the organisms were rinsed with potable tap water. Using sterile forceps, individual M. leidyi were picked and added to a sterile blender jar until a total weight of 25 g was reached. An equal amount of phosphate-buffered saline (PBS) was added to the blender jar before blending on high for 90 s. After blending, 1 mL of M. leidyi homogenate was inoculated in triplicate into 9 mL of alkaline peptone water (APW) broth and incubated overnight at 35°C. Serial volumes (100 mL, 10 mL, 1 mL, 100 µL, 10 µL, and 1 µL) of undiluted water samples were inoculated in triplicate into 10 mL of APW broth and incubated overnight at static temperature of 35°C. Following incubation, 1 mL of all samples was transferred to microcentrifuge tubes and boiled in a dry bath at 100°C for 10 min and stored at −80°C until real-time PCR analyses were conducted.
Vibrio spp. analysis using real-time PCR methods targeted the species-specific gene tlh (thermolabile hemolysin) to estimate the abundance of total V. parahaemolyticus and the species-specific gene vvhA (Vibrio vulnificus hemolysin A) to confirm the abundance of total V. vulnificus in water. The tdh^+^ (thermostable direct hemolysin) and trh^+^ (thermostable related hemolysin) were targeted to determine the presence of virulence genes in V. parahaemolyticus. The vcgC^+^ (virulence correlated gene) was targeted to determine the presence of the virulence gene in V. vulnificus. The primers, probes, and internal controls used for these reactions were as described by Panicker and Bej (51), Nordstrom et al. (52), and Baker-Austin et al. (53).
Testing for tlh, tdh^+^, trh^+^, and vvhA genes occurred using the National Shellfish Sanitation Program (54) guidelines and an Applied Biosystem 7500 FAST Real-Time PCR system (Thermo Fisher Scientific, Waltham, MA, USA). Reaction concentrations and conditions were as follows: 0.5–0.75 µL of each primer, 0.188–0.5 µL of each probe, 2.5 µL of buffer (Invitrogen, Carlsbad, CA, USA), 2.5 µL MgCl_2_ (Invitrogen, Carlsbad, CA, USA), 0.75 µL dNTP solution (Sigma Aldrich, St. Louis, MO, USA), 11.8 µL of nuclease-free PCR grade water, 0.45 µL platinum Taq polymerase (Invitrogen, Carlsbad, CA, USA), 0.06 µL ROX (Thermo Fisher, Waltham, MA, USA), 2.0 µL of internal amplification control (BioGX, Birmingham, AL, USA), and 2.0 µL of DNA template (boiled MPN culture) for a 25 µL reaction volume with initial denaturation/polymerase activation of 95°C for 60 s, followed by 45 cycles of 95°C for 5 s and an annealing temperature of (57°C for vvhA, 59°C for tlh, tdh^+^, and trh^+^) for 45 s (54) .
Testing for the vcgC^+^ was carried out using an iTaq Universal Supermix (Bio-Rad Laboratories, Hercules, CA, USA), as described by Panicker et al. (55) and Lane et al. (56), using a Bio-Rad CFX96 RT PCR system with an initial denaturation/polymerase activation of 95°C for 180 s, followed by 45 cycles of 95°C for 5 s and an annealing temperature of 60°C for 45 s.
Nutrient analysis
For nutrient analyses, 120 mL water samples were filtered through a Sterivex cartridge (0.22 µm, Millipore, Merck, Burlington, MA, USA) using a 50 mL Luer-Lock syringe (BD Medical, Franklin Lakes, NJ, USA). Filtrates were stored at −80°C until analysis. Concentrations of total dissolved nitrogen (TDN), total dissolved phosphorus (TDP), (nitrate/nitrite, (NO_3_:NO_2_), nitrite (NO_2_^-^), ammonium (NH_4_^+^), and ortho-phosphate (PO_4_^3-^) were analyzed by the Chesapeake Biological Laboratory (Solomons, MD, USA) using a Technicon Auto Analyzer II (SEAL Analytical Inc., Mequon, WI, USA) and NAP software following the methods of the US Environmental Protection Agency, as modified by the Chesapeake Bay Program (57, 58).
Statistical analysis
All statistical analyses were conducted using RStudio version 3.3.0 (RStudio, 2015). Vibrio spp. and HAB species enumeration data were log-transformed to normalize the data distribution. Site maps were created with Ggmaps, integrating base maps from Google Maps using RStudio (V 3.3.0) (59). The relationships between M. leidyi, HABs, Vibrio spp., nutrients, biomass, and environmental parameters were evaluated using a one-way ANOVA in RStudio. The ggplot2 package in RStudio was used to generate a visual representation of the distribution of M. leidyi, HABs, Vibrio spp., and environmental parameters (V3.3.0) (60). A Spearman correlation test and a Benjamini and Hochberg P value adjustment were used to assess the association between M. leidyi, Vibrio spp., nutrients, HABs, and environmental parameters. Seasons in this study are defined as spring (April–June) and summer (July–October) based on regional climate/weather patterns and phytoplankton and fish populations (14, 61, 62). Raphidophyte data were removed from seasonal correlation analysis because they were not frequently present in the study area. Initially, all picoplankton-sized taxa (those >3 µm) were categorized together. However, due to different environmental preferences and ecosystem disruptive modes (43, 63, 64), picoplankton-sized taxa were analyzed separately as Aureococcus anophagefferens, Pedinophyceae, and picocyanobacteria. Correlograms (package Corrgram in RStudio) were used to produce a visual representation of the relationship between environmental factors and to help identify what variables to use when modeling.
Generalized linear models (GLMs) were used to describe the relatedness between Vibrio spp. and environmental variables. Vibrio spp. markers in environmental samples were used as the response variables, and environmental parameters were the explanatory variables used in each model. Combinations of each model are found in [Tables 1 and 2](#T1 T2). The MuMIn package in RStudio was used to calculate AICc criteria to rank the models (65). AICc is a statistical method used for model selection, helping to identify the model that best fits the data (66). The response variable was vvhA^+^ V. vulnificus and trh V. parahaemolyticus in M. leidyi, and the fixed variables were environmental parameters, including nutrients. The models included both abiotic and biotic variables. Additionally, the fitness of the model was assessed in R studio using base R and the sensitivity package to assess the reliability of the models and the extent to which model predictions are influenced by changes in input variables (67). Specifically, we calculated the estimated coefficients and the percent change in model predictions resulting from a 10% increase in each predictor variable.
RESULTS
Comparison of environmental parameters
Abiotic parameters were measured at all seven sites in MCBs (Fig. 1) to establish the relative water quality between sites. The averages and ranges of water temperature, salinities, dissolved oxygen, turbidity, and nutrient concentrations are shown in Tables 3 and 4. A one-way ANOVA showed no significant difference in temperature between sites (Table S1). Salinities ranged from 19 to 36 PSU, with higher salinity values recorded near sites S14, S8, and S4 due to the influence of Ocean City Inlet and the lowest values recorded at S12. Overall, the salinities were greater in 2022 than in 2021. There was a significant difference in salinity between sites and years with a P < 0.05 ([Table 3 and 4](#T3 T4); Table S1).
Dissolved oxygen levels were similar between sites, averaging between 6.2 and 6.8 mg mL^−1^. Turbidity ranged from 0.001 to 34.10 NTU. The average turbidity was highest at sites S12 (16.6 NTU) and S4 (11.8 NTU). A one-way ANOVA showed no significant difference between dissolved oxygen levels, but there was a difference in turbidity values between sites with a P < 0.05 (Tables 3 and 4; Table S1).
Nutrient concentrations are given in Tables 3 and 4. One-way ANOVA showed that there were no significant differences in TDN (0.11–1.10 µM), NO_3_^-^:NO_2_ (0.01–0.48 µM), and NH_4_^+^ (0.01–0.29 µM) concentrations between years. However, there were significant differences in TDN, NO_3_^-^:NO_2_, and NH_4_^+^ concentrations between sites with a P < 0.05. The average TDN concentrations were highest at sites S1 and S2 (both 0.58 µM) and at site S12 (0.54 µM). The average NO_3_^-^:NO_2_ concentrations were highest at sites S1 and S2 (both 0.03 µM) and at site S9 (0.05 µM). The average NH_4_^+^ concentrations were highest at sites S1 (0.08 µM) and S2 (0.06 µM). There were also significant differences in PO_4-_ (0–0.62 µM) and TDP (0.01–0.83 µM) concentrations between years with a P < 0.05. The average PO_4-_ and TDP concentrations were higher in 2022 compared to 2021, and there were no significant differences in PO_4-_ and TDP concentrations between sites ([Tables 3 and 4](#T3 T4); Table S1).
HAB species distribution in the MCBs
Site distribution of the HAB species identified in the MCBs is shown in Fig. S1a. A HAB species list, with known harmful effects, is provided in Table S2. Northern MCB sites (S1, S2, and S4) had consistent populations of the bloom-forming dinoflagellates Levanderina fissa, Akashiwo sanguinea, and Gymnodinium aureolum. The potentially toxic or harmful diatoms, Pseudo-nitzschia spp. and Proboscia alata, were most abundant at sites near Ocean City Inlet (S8 and S9). The phytoplankton community at the Newport Bay site (S12) had a higher percentage of picoplankton-sized cells (2–3 µm), including picocyanobacteria, an unidentified Pedinophyceae species, and the brown tide organism Aureococcus anophagefferens, compared to other HAB species and compared to other study sites (Fig. S1). The ichthyotoxic dinoflagellate, Karlodinium veneficum, was the most abundant HAB species found in Chincoteague Bay (S14). The bloom-forming dinoflagellate Prorocentrum minimum and the ciliate Mesodinium rubrum, which plays a vital role in the life cycle of dinoflagellates in the genus Dinophysis and can serve as a predictive indicator for Dinophysis blooms (68), were found throughout the MCBs during this study.
One-way ANOVA suggested that there was no significant difference in HAB concentrations between sites. However, there was a significant difference in picoplankton, diatom, and dinoflagellate biomass between years and months with a P value < 0.05 (Fig. 2 and Table S1). Total picocyanobacteria biomass was 0.73 × 10^1^ μgC L^−1^ (maximum observed in September 2022), 0.18 × 10^1^ μgC L^−1^ for diatoms (maximum observed in September 2022), and 7.2 × 10^3^ μgC L^−1^ for dinoflagellates (maximum observed in September 2021).
Average biomass of major phytoplankton groups observed in the Maryland Coastal Bays in 2021–2022. (a) Average biomass by month. (b) Average biomass by site.
Mnemiopsis leidyi distribution in MCBs
Seasonal and temporal variations in M. leidyi abundances are shown in Fig. 3. M. leidyi was most abundant from June to August, and the concentrations were highest at sites S4 and S14. A one-way ANOVA revealed a significant difference in abundance between sites with a P < 0.05 (Table 4). However, there was no significant difference in M. leidyi abundance between years (Table S1).
Distribution of Mnemiopsis leidyi in the Maryland Coastal Bays from 2021 to 2022. (a) Mean density by month, n = 43. (b) Mean density by site, n = 43. The bar plots summarize mean per mL concentrations of M. leidyi with standard errors.
Vibrio parahaemolyticus prevalence in water and Mnemiopsis leidyi tissues
The concentrations and detection percentage of V. parahaemolyticus in water samples and M. leidyi tissues using the species-specific and pathogenic genes are listed in Table 5. The thermolabile hemolysin (tlh) V. parahaemolyticus gene was detected in 70% of water samples, and the concentrations ranged from 0.01 to 3.72 log MPN mL^−1^. In homogenized tissue samples of M. leidyi, the tlh V. parahaemolyticus gene was detected in 56% samples, and the concentrations ranged from 0.44 to 4.90 log MPN g^−1^. The pathogenic thermostable direct hemolysin positive (tdh^+^) V. parahaemolyticus gene was detected in 15% of water samples and 5% of homogenized M. leidyi tissue samples. Concentrations of the tdh^+^ V. parahaemolyticus gene in water ranged from 0.01 to 0.28 log MPN mL^−1^ and from 0.28 to 1.85 log MPN g^−1^ in homogenized M. leidyi tissue. The pathogenic thermostable related hemolysin positive (trh^+^) V. parahaemolyticus gene was detected in 16% of water samples and 28% of homogenized M. leidyi tissue samples. Concentrations of the trh^+^ V. parahaemolyticus gene in water ranged from 0.01 to 1.87 log MPN mL^−1^ and from 0.49 to 4.06 log MPN g^−1^ in homogenized M. leidyi tissues (Table 5). There was a significant difference in total tlh^+^ V. parahaemolyticus gene found in water samples between years, with more V. parahaemolyticus detected in 2021 than 2022 (P < 0.05; Table 6).
The tlh V. parahaemolyticus gene was detected in water samples monthly, but the highest concentrations were observed from July to September (Fig. 4a). The tlh V. parahaemolyticus gene was detected at all seven sites, but the highest concentrations in water samples were detected at sites S1 and S12 (Fig. 4b). The tdh^+^ V. parahaemolyticus gene was detected at low concentrations from June to September (tdh^+^) at sites S1, S9, and S12, and the trh^+^ V. parahaemolyticus gene was detected at low concentrations from June to October at sites S1, S2, S4, and S12 (Fig. 4).
Temperature distribution overlaid with Vibrio parahaemolyticus (tlh), V. vulnificus (vvhA), pathogenic V. parahaemolyticus (tdh+ and trh+), and pathogenic V. vulnificus (vcgC+) occurrence data in the Maryland Coastal Bays for 2021–2022. (a) Means and standard errors for Vibrio genes within months, n = 95. (b) Means and standard errors for Vibrio genes within sites, n = 95.
The tlh^+^ V. parahaemolyticus gene was detected in homogenized M. leidyi tissues from May to October, with the highest concentrations detected in June (Fig. 5a) and at all sites, with the highest concentrations occurring at site S9 (Fig. 5b). The tdh^+^ V. parahaemolyticus gene was not detected in any months or sites, but the trh^+^ gene was detected from June to September at sites S2, S4, S8, S9, and S12 with the highest concentrations occurring in June and site S8 (Fig. 5).
Temperature distribution overlaid with Vibrio spp. occurrence in Mnemiopsis leidyi tissues collected from the Maryland Coastal Bays in 2021–2022. Vibrio are represented as V. parahaemolyticus (tlh), V. vulnificus (vvhA), pathogenic V. parahaemolyticus (tdh+ and trh+), and pathogenic V. vulnificus (vcgC+). (a) Means and standard errors for Vibrio genes within months, n = 43. (b) Means and standard errors for Vibrio genes within sites, n = 43.
Vibrio vulnificus prevalence in water and Mnemiopsis leidyi tissues
The concentrations and detection percentage of V. vulnificus in water samples and M. leidyi tissues using the species-specific and pathogenic gene targets are listed in Table 5. The V. vulnificus hemolysin A gene (vvhA) was detected in 20% of water samples and ranged in concentrations from 0.02 to 1.40 log MPN mL^−1^. The vvhA marker was found in 33% of homogenized M. leidyi tissue samples with concentrations ranging from 0.05 to 2.11 log MPN g^−1^. Using the Vibrio virulence correlated clinical gene (vcgC^+^), V. vulnificus was detected in 1% of water samples with a concentration ranging from 0.00 to 0.03 log MPN mL^−1^. The vcgC^+^ gene was detected in 8% of M. leidyi tissue samples with a concentration ranging from 0.30 to 2.04 log MPN g^−1^. There was a significant difference in total (vvhA) V. vulnificus found between years with higher concentrations occurring in 2021 (P < 0.05; Table 6).
The vvhA V. vulnificus gene was detected in water samples collected in June, July, August, and October, with the highest concentrations occurring in August (Fig. 4a). The vvhA V. vulnificus gene was detected in water samples from all sites, except S14. The highest vvhA V. vulnificus gene concentrations were detected at site S12 (Fig. 4b). The vcgC^+^ V. vulnificus gene was not detected in water samples collected in any month or site (Fig. 4).
The vvhA V. vulnificus gene was detected in homogenized M. leidyi tissues from June to September, with the highest concentrations detected in July (Fig. 5a). The vvhA V. vulnificus marker was detected in M. leidyi tissues from all sites, except S8, with the highest concentrations occurring at S9 (Fig. 5b). The vcgC^+^ V. vulnificus gene was detected in M. leidyi tissues in July and August, and only at sites S9 and S12 (Fig. 5).
Correlation analysis of Mnemiopsis leidyi, Vibrio, harmful algae biomass, and abiotic parameter by season
Using the data collected in the spring, a correlation analysis of M. leidyi concentrations, Vibrio spp. concentrations, and harmful algae biomass revealed a positive association between the V. vulnificus gene marker vvhA in M. leidyi (VHAC) and total dinoflagellate biomass (Dino) (VHAC vs Dino) with a coefficient value >0.5 and P value of < 0.05. There was a negative association between vvhA in M. leidyi and M. leidyi concentrations (ML) (VHAC vs ML) (Fig. 6). Using data collected in the summer, a correlation analysis revealed a positive association among total dinoflagellate biomass, M. leidyi concentrations, and picoplankton biomass, (Dino vs ML) and (Dino vs Pico) with a coefficient value >0.5 and P value of < 0.05. There were no strong associations between harmful diatom biomass and any variable (Fig. S2).
Seasonal correlation analysis between Mnemiopsis leidyi, V. parahaemolyticus, V. vulnificus, and Vibrio pathogenic markers, and dinoflagellate and picoplankton biomass collected from the Maryland Coastal Bays in 2021–2022. (a) Spring months from April to May. (b) Summer months from June to August. The blue-shaded scale indicates a positive relationship, and the red-shaded scale indicates a negative relationship. Abbreviation definitions: ML = M. leidyi, W = environmental sample, C = M. leidyi sample, Dino = dinoflagellate biomass, Pico = picoplankton biomass, and TLH, TDH, TRH, and VHA = Vibriogenetic markers.
For V. parahaemolyticus markers, tlh V. parahaemolyticus in water (TLHW) had a moderate positive correlation with tlh V. parahaemolyticus in M. leidyi (TLHC), trh^+^ V. parahaemolyticus in water (TRHW), and turbidity (TLHW vs TLHC), (TLHW vs TRHW), and (TLHW vs turbidity) (Fig. 7). Total tlh V. parahaemolyticus in M. leidyi had a positive correlation with trh^+^ V. parahaemolyticus in M. leidyi (TRHC), temperature (Temp), and turbidity (TLHC vs TRHC), (TLHC vs Temp), and (TLHC vs turbidity). However, there was a negative association between total tlh V. parahaemolyticus in M. leidyi, tlh V. parahaemolyticus in water, and dissolved oxygen levels (DO), (TLHC vs TLHW), and (TLHC vs DO). There was a moderate positive correlation with total tdh^+^ and trh^+^ V. parahaemolyticus in water (TDHW vs TRHW). For V. vulnificus markers, vvhA V. vulnificus in water had a positive association with vcgC^+^ V. vulnificus in M. leidyi (VCGCC) and turbidity (VHAW vs VCGCC) and (VHAW vs turbidity). The vvhA V. vulnificus marker in M. leidyi had a positive association with vcgC^+^ V. vulnificus in M. leidyi (VHAC vs VCGCC) (Fig. 7). All associations had a coefficient value >0.5 and P value of < 0.05.
Correlation analysis between variables collected from the Maryland Coastal Bays in 2021–2022, including V. parahaemolyticus, V. vulnificus, and pathogenic Vibrio markers and environmental parameters. The blue-shaded scale indicates a positive relationship, and the red-shaded scale indicates a negative relationship. Abbreviation definitions: W = environmental sample, C = Mnemiopsis leidyi sample, Temp = temperature, Sal = salinity, DO = dissolved oxygen, and TLH, TDH, TRH, VHA, and VCG = Vibriogenetic markers.
Modeling the relationship between M. leidyi, Vibrio spp., HABs, and environmental parameters
A GLM was used to determine which explanatory variables best described the detection of Vibrio spp. in M. leidyi and water samples. Temperature was the strongest determinant of total (vvhA) V. vulnificus in homogenized M. leidyi tissues (Table 1; Table S1), whereas turbidity exerted the most influence of total (vvhA) V. vulnificus in water (Table 2; Table S3). When temperature was combined with salinity and dissolved oxygen, model performance did not improve for (vvhA) V. vulnificus. Turbidity and temperature contributed the most in detecting total (tlh) and (trh^+^) V. parahaemolyticus in homogenized M. leidyi tissues (Table 1; Table S4). Turbidity also contributed the most in detecting total (tlh) and potentially pathogenic (trh^+^) and (tdh^+^) V. parahaemolyticus in water (Table 2; Table S3). For nutrients, TDN combined with NH_4_^+^ contributed the most in detecting (trh^+^) V. parahaemolyticus in water (Table 7; Table S5). The same GLM was used on tdh^+^ and vcgC^+^ in M. leidyi tissues, but the null model was the best fit in all scenarios. Inclusion of HAB data did not improve model explanatory powers.
A sensitivity analysis was performed in R Studio using base R and the sensitivity package to assess the reliability of the models and to help identify which model predictions were influenced by 10% changes in input variables, following Saltelli et al. (69). This analysis provided additional insight into the robustness of the model and highlights, through positive percent change values, that turbidity and temperature changes have the greatest impact on predicting the presence of V. parahaemolyticus and V. vulnificus in water and M. leidyi tissue samples across the spring and summer seasons (Table S3 through S5).
DISCUSSION
Environmental parameters and biota distribution
The MCBs can be partitioned into the northern (Assawoman [sites S1 and S2] and Isle of Wight [site S4]) and southern (Sinepuxent [site S9], Newport [site S12], and Chincoteague [site S14] Bays) regions, divided by Ocean City Inlet (site S8). Most of the inflow in the northern bays is freshwater discharge from the St. Martin River, while the southern bays receive most of their inflow via Ocean City Inlet (11). Elevated nutrients and a long residence time influence the water quality throughout the MCBs (11, 61). Nutrient concentrations measured between 2021 and 2022 were within the range of previously reported observations (61, 70, 14). Of note, high mean concentrations of PO_4-_ and TDP were observed in May 2022, which was likely due to an extensive rain event that occurred two or three days prior to sampling (https://waterdata.usgs.gov/md/nwis/rt). Seasonal mean nitrogen concentrations were consistent throughout both years. Nutrient concentrations varied little within sites, but consistently higher concentrations of NH_4_^+^, NO_3_:NO_2_^-^, and TDN were found in Assawoman and Isle of Wight Bays compared to other locations, likely due to the influence of urban runoff and treated effluents from the Ocean Pines wastewater treatment plant (70, 71).
There was no significant difference in HAB concentrations between sites, which means that, when present, the same HAB species occurring at multiple sites had similar cell concentrations. However, HAB species composition varied spatially and temporally. The dinoflagellate K. veneficum was the most abundant HAB species in Chincoteague Bay, consistent with observations made by Oseji et al. (37). The HAB community in the northern MCBs was dominated by the dinoflagellate P. minimum, particularly in spring and early summer, consistent with earlier regional studies (13, 14). Recent studies by Kim et al. (34) and Martinez-Mercado et al. (72), have shown an association between bacteria, including Vibrio spp., and Prorocentrum spp. during blooms and speculate that this is due to bacteria-mediated mineralization of phosphorus or some other metabolic function. Nitrogen constituents are a major driver of HABs in lagoonal systems (27, 73, 74), but because concentrations were relatively consistent during this study, we did not observe a distinct relationship between nitrogen and HABs.
M. leidyi was present in both years and at all sites, but there was a significant difference in its abundance between sites. M. leidyi was most abundant in Isle of Wight Bay and Newport Bay, northern and southern sites that are heavily influenced by freshwater inputs from the St. Martin River and a series of creeks, respectively (11, 75). These sites had average turbidity levels >11.5 PSU, water temperatures >21°C, and salinities <30, all median values compared to other sites in this study. The TDP concentrations (0.04 µM) were low compared to values ranging from 0.06 µM to 0.50 µM at other sites. TDN was the most abundant class of nitrogen measured at these sites, albeit nitrogen concentrations were lower here than other sites in the study. It is well known that M. leidyi population growth and reproduction are constrained by temperature and salinity (76, 77), but the semi-enclosed construct of Newport and Isle of Wight Bays may provide the habitat necessary to allow M. leidyi to grow (average concentration of 947 organisms per m^3^), as has been documented in other locations where this species has invaded coastal systems with concentrations ranging from 500 to 940 organisms per m^3^ (78, 79).
Using genetic markers, it was determined that both V. parahaemolyticus and V. vulnificus were present at all sites in 2021 and 2022. Vibrio concentrations detected in water samples and in M. leidyi tissues varied throughout the study, but there was no significant difference among sites. These findings coincide with previous reports on Vibrio spp. and M. leidyi distribution in the MCBs (5, 80, 81). There was a significant difference in the concentration of total tlh^+^ V. parahaemolyticus in water samples between years and months, with greatest concentrations occurring from July to September 2021. We also observed a significant difference in vvhA V. vulnificus in water between years, with more V. vulnificus being detected in 2021 than 2022. These findings could be due to differences in salinity, which was significantly lower in 2021 compared to 2022. The average salinity was 27 ppt in 2021 (range from 20 to 32 ppt) and 29 in 2022 (range 19–36 ppt). The salinity range in 2021 fell within that reported by Smalls et al. (81) for optimal for V. vulnificus growth in the MCB, but the 2022 salinity range exceeded this optimum. However, a relationship between V. parahaemolyticus and salinity is less straightforward (82, 83), and Davis et al. (84) have indicated that salinities between 10 and 23 ppt are more favorable for this species in the mid-Atlantic region. Warmer water temperatures can also influence the abundance of V. parahaemolyticus and V. vulnificus (85–87). The average sea water temperatures in the MCBs were higher in 2021 compared to 2022. The highest temperatures were recorded from July to September 2021, ranging from 21.1°C to 30.0°C, making conditions suitable for V. parahaemolyticus and V. vulnificus to thrive.
Correlation analyses
A correlation analysis of data collected in the spring revealed a positive association between the V. vulnificus marker vvhA in M. leidyi and total dinoflagellate biomass. Previous studies have shown that organic carbon, nitrogen, and phytoplankton blooms have been found to influence V. vulnificus abundance in water and in filter feeders (88, 89). Vibrio spp. have been found on a broad spectrum of planktonic hosts >20 µm, including copepods, ciliates, cnidarians, tunicates, diatoms, and dinoflagellates (88). Therefore, it is not surprising to find an association among dinoflagellates, Vibrio, and M. leidyi. However, we found a negative association between vvhA in M. leidyi tissues and M. leidyi concentrations, likely because M. leidyi abundance is influenced by temperature and prey concentrations (76, 90, 91), both of which are reduced in the cooler waters of spring. In this study, M. leidyi abundance was higher in summer in comparison to spring. Picoplankton was not observed in abundant concentrations in the spring and therefore was not added in the spring correlation analysis.
A correlation analysis of summer data revealed a positive association between dinoflagellate biomass and M. leidyi concentrations, as well as between dinoflagellates and picoplankton biomass. This observation has been found in other estuaries, and it is likely due to M. leidyi exerting predation pressure on mesoplankton, which subsequently influences dinoflagellate and picoplankton abundance (92, 93). In this study, the picoplankton category was composed of phototrophic cells between 2 and 3 µm in size. Within this category, we identified both picocyanobacteria and the brown tide organism A. anophagefferens. Co-occurrence of cyanobacteria and dinoflagellate blooms is often due to nutrients made available by the cyanobacterial fraction of the phytoplankton population (94, 95). McNamara et al. (93) demonstrated that A. anophagefferens enhances the feeding of larval M. leidyi. We did not observe a strong correlation between M. leidyi and picoplankton, likely due to the monthly sampling scheme that failed to capture the full dynamics of picoplankton blooms (noted as changing daily to weekly in shallow, lagoonal systems by (73) in the MCBs and/or our focus on examining adult M. leidyi. We also observed a negative association between tlh V. parahaemolyticus in M. leidyi tissues and dinoflagellate biomass during the summer months. This may be due to reduced V. parahaemolyticus populations during dinoflagellate blooms (10^7^–10^10^ dinoflagellate cells L^−1^) (14, 96) or the feeding preferences of M. leidyi, which is known to be size-specific and influenced by its own biovolume and water temperature (97, 98). We found no associations between diatom biomass and any variable. This may be due to our limited focus on harmful diatom taxa and not the entire diatom community. Including a broader assessment of the phytoplankton community may provide more insights into the dynamics between HABs, M. leidyi, and Vibrio spp. and should be considered in future studies.
Temperature and turbidity were two environmental factors that had a positive association with total tlh V. parahaemolyticus found in M. leidyi tissues. This is not surprising as high densities of V. parahaemolyticus in oysters have been positively correlated with seawater temperatures (19, 87). In the Chesapeake Bay, a positive association has been found between turbidity, oysters, and V. parahaemolyticus (84, 99). Higher nutrient levels are often associated with higher turbidity, fecal matter, and phytoplankton matter and may stimulate V. parahaemolyticus growth while also providing substrates for Vibrio that are a size more easily taken up by filter feeders (21, 83, 99). Dissolved oxygen is also another variable that has been widely studied in relation to V. parahaemolyticus. Davis et al. (84) and Hartwick et al. (100) found a negative association between dissolved oxygen and total (tlh) V. parahaemolyticus. This coincides with our findings wherein total (tlh) V. parahaemolyticus in M. leidyi had a negative association with dissolved oxygen, likely due to the inverse relationship between dissolved oxygen and water temperature (101).
There is a lack of studies describing the interaction between Vibrio spp. and M. leidyi. Concentrations of Vibrio spp. in M. leidyi were found to be comparable to concentrations found in oysters (18, 102, 103). A previous study in the MCBs observed concentrations of Vibrio spp. in oysters ranging from 0 to 3.5 log MPN g^−1^ (18), and we found similar concentrations in M. leidyi. This is likely due to the similar feeding strategies of jellyfish and oysters, which prefer larger detrital particles and zooplankton (88, 104, 105). Since Vibrio spp. are known to attach to zooplankton, this association makes them more susceptible to ingestion by filter feeders (106).
Ecological modeling
A GLM, with follow-up sensitivity analysis, showed that turbidity contributed the most in detecting total tlh, trh^+^, tdh ^+^, and vvhA in the environment. This is consistent with recent studies in the Chesapeake Bay (84, 86). Turbidity is the resuspension of particles and sediments into the water column. These particles provide not only a substrate for Vibrio spp. to attach to, but also a way to reintroduce Vibrio spp. back into the water column as part of the microbial loop (107). In M. leidyi tissue samples, temperature contributed the most in detecting total vvhA V. vulnificus. Studies done in the Chesapeake Bay and the Gulf of Mexico found a similar trend between warmer temperatures and higher concentrations of V. vulnificus in oysters (108–110).
A combination of temperature and turbidity was determined as the best predictor for detecting total tlh and trh^+^ V. parahaemolyticus in homogenized M. leidyi tissues, similar to findings on V. parahaemolyticus abundance in oysters (19, 87). Turbidity and temperature together were found to be predictors for the presence of V. parahaemolyticus in water and oysters (83, 99, 111), similar to our findings within M. leidyi tissues and water.
Nutrients can also play a role in Vibrio abundance, and recent studies have found an association between nutrients and Vibrio concentrations in marine environments (27, 28, 112). In our study, the correlation analysis revealed a positive association between TDN and trh^+^ V. parahaemolyticus in water (Table 7). Bacteria are known to rapidly assimilate low-molecular-weight compounds, such as amino acids and urea (113), and Vibrio spp. can readily use different types of nitrogenous constituents (114). This highlights the importance of nutrient reduction plans that aim to improve water quality and safety of the MCBs and warrants investigation of field-deployable TDN sensors (described in [115]) that could provide near-real-time TDN data.
Even though V. parahaemolyticus and V. vulnificus were detected in M. leidyi tissues and water samples, there was no strong relationship between their abundances. The lack of association between M. leidyi and Vibrio abundances could be due to the relatively small sample size of this study or to other environmental factors that were not considered, such as the competing microbiome and the total phytoplankton community. These groups, plus M. leidyi and Vibrio populations, have been found to coincide with zooplankton assemblages (104, 106, 116), which in the MCB are tied to seasonal shifts in temperature and salinity (23). We chose to investigate the potential interaction between jellyfish, harmful algae, Vibrio, and discrete water quality parameters, as several water quality constituents and phytoplankton populations are increasingly being monitored for in this region using temporally and spatially rigorous remote sensing technologies (26, 117, 118). If it was possible to leverage data from these remote sensing technologies and augment existing Vibrio models (8, 26), resource managers would have more data available to them, besides in situ sample data only, to detect and track Vibrio populations. While this assessment showed some correlations between Vibrio spp. and parameters that could be remotely sensed, such as water temperature, salinity, and phytoplankton concentrations, future studies should consider a whole community approach and specifically phyto- and zooplankton interactions with Vibrio spp. and M. leidyi for better predictive and modeling powers.
Even though there was not a significant association between M. leidyi abundance and Vibrio, we did find a significant association between M. leidyi abundance and dinoflagellate biomass during the summer. Seasonal dynamics and HAB community composition can play a role in M. leidyi abundance and should be studied further. Our study provided new knowledge on the ecology of Vibrio spp., HABs, and M. leidyi. Temperature and turbidity were major factors influencing M. leidyi abundance in the MCBs. Sea surface temperatures and turbidity are increasing in the Chesapeake Bay region (61, 119), which may lead to an increase in M. leidyi abundance in local estuaries and an alteration in microbial and food web dynamics. This study provides novel information on the interactions of M. leidyi, Vibrio spp., and HABs in the MCBs. Moreover, data from this study can be used for future ecological models on HAB and Vibrio dynamics in estuarine systems.
The reference list from the paper itself. Each links out to its DOI / PubMed record.
- 1Anderson DM, Fensin E, Gobler CJ, Hoeglund AE, Hubbard KA, Kulis DM, Landsberg JH, Lefebvre KA, Provoost P, Richlen ML, Smith JL, Solow AR, Trainer VL. 2021. Marine harmful algal blooms (HA Bs) in the United States: history, current status and future trends. Harmful Algae 102:101975. doi:10.1016/j.hal.2021.10197533875183 PMC 8058451 · doi ↗ · pubmed ↗
- 2Trinanes J, Martinez-Urtaza J. 2021. Future scenarios of risk of Vibrio infections in a warming planet: a global mapping study. Lancet Planet Health 5:e 426–e 435. doi:10.1016/S 2542-5196(21)00169-834245713 · doi ↗ · pubmed ↗
- 3Newton A, Kendall M, Vugia DJ, Henao OL, Mahon BE. 2012. Increasing rates of vibriosis in the United States, 1996-2010: review of surveillance data from 2 systems. Clin Infect Dis 54 Suppl 5:S 391–5. doi:10.1093/cid/cis 24322572659 PMC 4604744 · doi ↗ · pubmed ↗
- 4da Silva LV, Ossai S, Chigbu P, Parveen S. 2021. Antimicrobial and genetic profiles of Vibrio vulnificus and Vibrio parahaemolyticus isolated from the Maryland Coastal Bays, United States. Front Microbiol 12:676249. doi:10.3389/fmicb.2021.67624934093499 PMC 8175909 · doi ↗ · pubmed ↗
- 5Rodgers C, Parveen S, Chigbu P, Jacobs J, Rhodes M, Harter-Dennis J. 2014. Prevalence of Vibrio parahaemolyticus, and Vibrio vulnificus in blue crabs (Callinectes sapidus), seawater and sediments of the Maryland Coastal Bays. J Appl Microbiol 117:1198–1209. doi:10.1111/jam.1260825066367 · doi ↗ · pubmed ↗
- 6Wolny JL, Egerton TA, Handy SM, Stutts WL, Smith JL, Whereat EB, Bachvaroff TR, Henrichs DW, Campbell L, Deeds JR. 2020. Characterization of Dinophysis spp. (Dinophyceae, Dinophysiales) from the mid‐Atlantic region of the United States . J Phycol 56:404–424. doi:10.1111/jpy.1296631926032 · doi ↗ · pubmed ↗
- 7Daniels R, Ellett A, Mc Combs K, Jacobs J. 2024. Vibrio vulnificus infections from water exposure in the Chesapeake Bay: are they predictable? Ecol Modell 488:110594. doi:10.1016/j.ecolmodel.2023.110594 · doi ↗
- 8Jacobs JM, Rhodes M, Brown CW, Hood RR, Leight A, Long W, Wood R. 2014. Modeling and forecasting the distribution of Vibrio vulnificus in Chesapeake Bay . J Appl Microbiol 117:1312–1327. doi:10.1111/jam.1262425139334 · doi ↗ · pubmed ↗