Contribution of Fourier transform infrared spectroscopy for outbreak investigation of carbapenem-resistant Acinetobacter baumannii
Hadas Kon, Mor N. Lurie-Weinberger, Dafna Chen, Hani Laderman, Elizabeth Temkin, Elena Lomansov, Ibraheem Firan, Worood Aboalhega, Marina Raines, Alona Keren-Paz, Yehuda Carmeli

TL;DR
This study shows that FTIR spectroscopy can quickly and effectively identify carbapenem-resistant Acinetobacter baumannii outbreaks, offering a faster and cheaper alternative to whole genome sequencing.
Contribution
The study demonstrates FTIR's effectiveness in outbreak investigation and validates its use alongside whole genome sequencing for A. baumannii.
Findings
FTIR results were consistent with whole genome sequencing for 11 sequenced isolates.
FTIR identified three clusters and four singletons in what initially appeared as one outbreak.
FTIR proved more discriminatory than multilocus sequence typing for outbreak analysis.
Abstract
The value of Fourier transform infrared (FTIR) spectroscopy as an investigation tool for outbreaks caused by Acinetobacter baumannii remains inconclusive. Here, we used FTIR as a real-time tool to investigate a carbapenem-resistant A. baumannii (CRAB) outbreak and later compared the FTIR results to results of whole genome sequencing (WGS). We used single-nucleotide polymorphism (SNP) analysis to confirm the correct FTIR cutoff and validate FTIR clustering. The outbreak occurred mainly in a general intensive care unit of an Israeli tertiary care hospital and involved 22 patients detected between December 2022 and August 2023. Isolates from 21 patients and two environmental sources were analyzed by FTIR. Eleven representative isolates underwent WGS. We performed SNP analysis using the earliest isolate as the reference. FTIR revealed that the outbreak was comprised of three clusters and…
Genes, proteins, chemicals, diseases, species, mutations and cell lines named across the full text — each resolved to its canonical identifier and authoritative record.
Click any figure to enlarge with its caption.
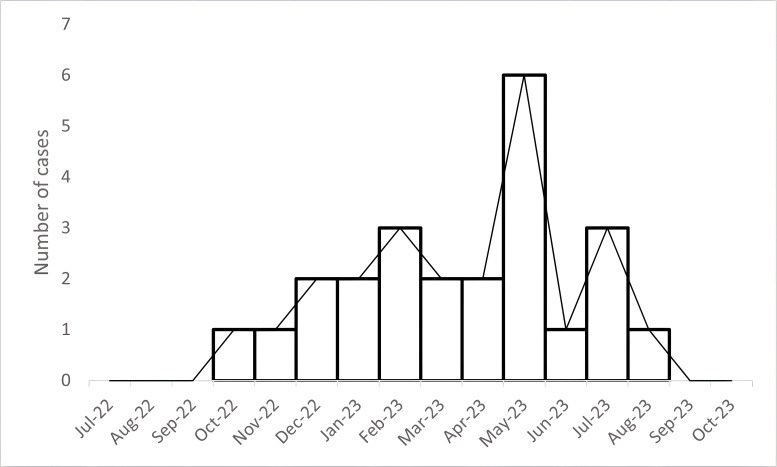 Fig 1
Fig 1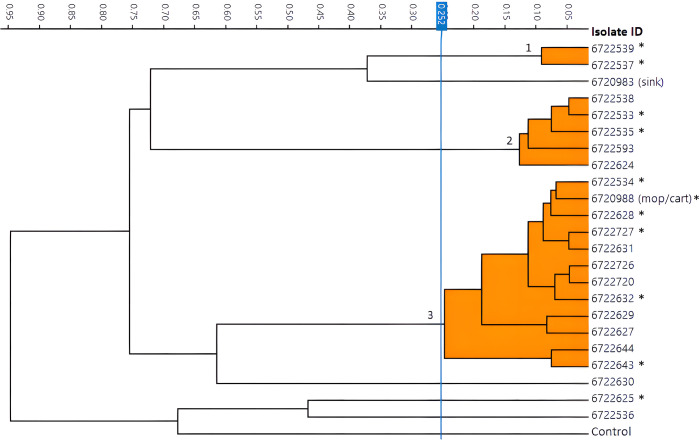 Fig 2
Fig 2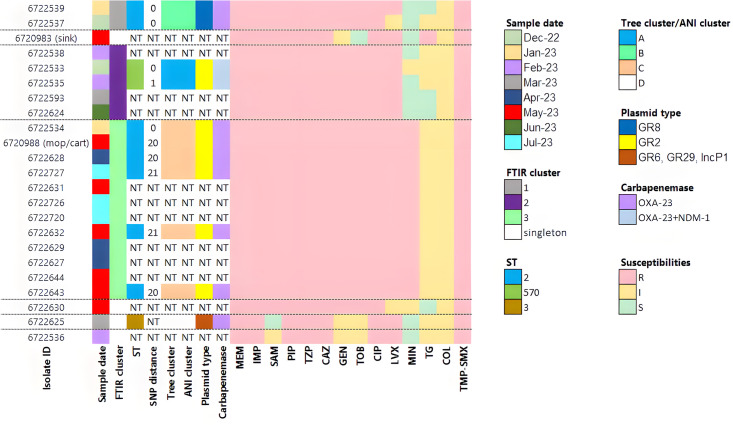 Fig 3
Fig 3Peer Reviews
No public reviews on file for this paper yet. If you reviewed it on a platform where reviews are public (OpenReview, ICLR, NeurIPS, ICML), you can paste yours below so the community can read it here.
Videos
No videos yet. Explain this paper in a talk, walkthrough, or lecture? Add one.
Taxonomy
TopicsSpectroscopy Techniques in Biomedical and Chemical Research · Bacterial Identification and Susceptibility Testing · Antibiotic Resistance in Bacteria
INTRODUCTION
Nosocomial outbreaks caused by carbapenem-resistant Acinetobacter baumannii (CRAB) are of high clinical relevance due to the organism’s environmental persistence and high associated mortality (1). These characteristics are facilitated by A. baumannii’s ability to survive on dry surfaces for up to 5 months (2) and its propensity to harbor multiple antibiotic resistance genes and virulence factors (3). A. baumannii can be transmitted via direct or indirect contact and frequently colonizes the skin and upper respiratory tract of hospitalized patients (4). Early and thorough investigation of CRAB outbreaks, including identification of the outbreak source and modes of transmission and molecular and genetic characterization of the isolates, is essential for implementing infection control measures to eliminate the bacterial reservoir and terminate the outbreak.
Whole genome sequencing (WGS) of isolates involved in an outbreak is the gold standard for typing, but it can be costly and time-consuming, and results may be delayed. Fourier transform infrared spectroscopy (FTIR) typing is a novel technique offering a rapid and cost-effective alternative. FTIR measures the absorption of infrared light by the molecules present in the bacterial cell, generating a unique spectrum that represents the isolate’s specific physicochemical content. Each spectrum is compared with all other spectra, and a dendrogram is constructed by calculating the distances between spectra according to hierarchical cluster analysis.
Here, we used FTIR as a real-time tool to investigate a CRAB outbreak and later compared the FTIR results to results of WGS. We used single-nucleotide polymorphism (SNP) analysis to confirm the correct FTIR cutoff and validate FTIR clustering.
RESULTS
The hospital identified the outbreak’s index patient on 6 December 2022. CRAB screening upon admission to the intensive care unit (ICU) was not performed, and so the case was classified as hospital-acquired but may have been imported. CRAB cases continued to emerge in the ICU at an average rate of one case every 2 weeks but reached a peak in May with six cases. From December 2022 to the end of the outbreak in August 2023, 21 patients in the ICU (including the index patient) acquired CRAB: eight had CRAB isolated in clinical cultures, and 13 were detected by screening. In addition, one patient in the pediatric surgical ward with CRAB isolated from a wound was considered part of the outbreak because he shared a surgeon with a patient with CRAB in the ICU. This case was identified during a hospital-wide epidemiological investigation, conducted to identify additional CRAB cases during the outbreak period. Aside from this individual, no additional patients outside the ICU met criteria for inclusion in the outbreak based on spatiotemporal overlap or shared exposure to healthcare personnel.
The epidemiological investigation identified several factors contributing to the outbreak, including low compliance with hand hygiene and isolation protocols, lack of cohorting of CRAB carriers with dedicated staff, compromised ability to clean equipment properly due to wear and tear, and use of shared cleaning carts for CRAB carriers and non-carriers. Environmental sampling of frequently touched surfaces (n = 43) was performed in May: two of 43 samples were positive for CRAB, one from a wooden mop handle or cleaning supplies cart (the same swab was used to sample both sites) and one from a sink. Measures taken to control the outbreak included: staff education, cohorting of CRAB carriers and assigning dedicated staff to the cohort, discarding worn-out equipment, replacing all sink drains in patient rooms, reducing shared carts and equipment, enhancing cleaning routines, and replacing all wooden mop handles with washable metal handles.
The epidemic curve is presented in Fig. 1. The CRAB outbreak included 22 clinical CRAB samples, with a peak of six clinical samples recovered in May 2023. Only two cases of CRAB were detected 5 months prior to the outbreak (Fig. 1).
Epidemic curve. Numbers of individuals carrying CRAB, by month. The outbreak isolates tested in the study, composing 22 clinical isolates, are displayed between December 2022 and August 2023.
The FTIR dendrogram of the outbreak isolates revealed one large cluster of 12 isolates (cluster 3), two smaller clusters (clusters 1 and 2), and four singletons (Fig. 2). The environmental sample from the mop handle/cart (isolate ID 6720988) belonged to the large cluster; the sample from the sink (isolate ID 6720983) was not closely related to any other outbreak isolate. The epidemiological investigation revealed links between four patients (isolate IDs 6722727, 6722632, 6722726, and 6722720) in cluster 3 who had undergone X-ray examinations, indicating a common exposure from either the portable X-ray machine or the shared radiologic technologists. Moreover, the patient from pediatric surgery (isolate ID 6722535) and the ICU patient who had the same surgeon (isolate ID 6722533) belonged to the same cluster (cluster 2). No epidemiological link was identified among the singletons.
FTIR dendrogram of outbreak isolates showing three clusters. Sequenced isolates are denoted by an asterisk ().*
FTIR results were concordant with WGS results for the 11 sequenced isolates (Fig. 3). Three different sequence types (STs) were identified: the two isolates in FTIR cluster 1 belonged to ST2, six isolates from cluster 3 also belonged to ST2, two isolates from cluster 2 belonged to ST570, and a singleton belonged to ST3. Cluster 3, the largest cluster, included patients detected over seven months. The SNP distance between isolates in the same cluster was up to 21 SNPs in cluster 3, one SNP difference in cluster 2, and in cluster 1, the isolates were genetically identical (0 SNPs). This finding confirmed that the cutoff we chose to define FTIR clusters (0.252) was suitable for the outbreak investigation. The phylogenetic tree and the ANI matrix grouped isolates into the same clusters as FTIR (Fig. 3; Fig. S1). As seen in Fig. 3, three plasmids were detected; two were cluster-specific and one crossed clusters. All isolates harbored blaOXA-23, with the coexistence of blaOXA-23 and blaNDM-1 in isolates belonging to cluster 2. The susceptibility profiles aligned with the FTIR and WGS results, with similar susceptibility patterns observed within each cluster. Where discrepancies existed—such as isolates within a cluster exhibiting susceptible versus intermediate results to a given antibiotic—they were a single doubling dilution apart and thus fell within the margin of error (Fig. 3).
Heat map of the outbreak isolates. The dotted lines indicate the division according to FTIR clusters. Phylogenetic tree and ANI clustering was based on Fig. S1. NT, not tested; ST, sequence type; MEM, meropenem; IMP, imipenem; SAM, ampicillin-sulbactam; PIP, piperacillin; TZP, piperacillin/tazobactam; CAZ, ceftazidime; GEN, gentamicin; tobramycin, TOB; ciprofloxacin, CIP; LVX, levofloxacin; minocycline, MIN; tigecycline, TG; colistin, COL; trimethoprim/sulfamethoxazole, TMP-SMX.
DISCUSSION
In this study, we described a CRAB outbreak and the use of FTIR typing as a tool to determine isolate relatedness. FTIR revealed that the outbreak was composed of three different clusters and four singletons. The detection of three simultaneous outbreaks using FTIR demonstrates its efficacy as an outbreak identification tool in high-prevalence settings. FTIR supported the hypothesis of cross-transmission within the ICU and spillage to a patient outside the ICU and provided insights on the relatedness between an environmental isolate (the mop handle/cart) and patients. The sink isolate could have been part of a cluster of two patients (sampled six months before the sink) if we had chosen a higher cutoff of 0.40.
FTIR has been applied for the discrimination of bacteria (5–7) and as a tool for outbreak investigations caused by various bacteria (8–10). Several studies proved FTIR to be a successful and accurate tool for analysis of outbreaks involving A. baumannii (8, 9, 11–13), but others reported unsatisfying FTIR results for A. baumannii outbreaks (14). Moreover, in these studies, FTIR results were either unvalidated (8, 11) or confirmed by methods less discriminatory than WGS, such as pulsed-field gel electrophoresis or multilocus sequence typing (MLST) (9, 12), with only one study providing WGS-level confirmation (via MLST and ANI) (13).
While a universal SNP threshold for CRAB has not been established, studies commonly employ a threshold of approximately 20 SNPs to identify outbreak clusters (15–17). Our results align with this practice, demonstrating that a threshold of fewer than 21 SNPs effectively differentiates non-outbreak from outbreak CRAB isolates.
A limitation of this study was the inability to perform WGS on the sink sample, as the isolate could not be grown. This absence of sequencing data, combined with a lack of epidemiological links, prevented us from raising the FTIR cutoff value; therefore, we employed a lower, more conservative cutoff. An additional limitation was that the outbreak occurred in a single hospital unit. Future studies should include a more diverse and representative set of isolates from multiple units and institutions to better assess the broader applicability of FTIR in CRAB outbreak investigations.
In conclusion, our FTIR analysis suggested that an apparently single epidemiological outbreak was actually composed of three distinct clusters. This provided us the opportunity to examine the discriminatory power of FTIR. To do so, we compared the results of FTIR clustering with MLST typing and with SNP analysis. We demonstrated that FTIR had higher discriminatory power than MLST. SNP analysis confirmed that the clustering identified by FTIR was correct. (Because the sink isolate was not sequenced, we could not verify the appropriateness of using the higher FTIR cutoff of 0.40). In addition, based on the results observed in this study, a threshold of less than 21 SNPs is appropriate when analyzing an A. baumannii outbreak.
MATERIALS AND METHODS
Setting
The CRAB outbreak occurred in the general ICU of a tertiary-care hospital in Israel, from December 2022 to August 2023. In this hospital in 2023, the annual incidence of hospital-acquired CRAB per 100,000 hospital days was 16.6 in clinical cultures and 5.1 in blood. The ICU has 18 beds in single or multi-patient rooms with curtains between patients. The ICU’s CRAB surveillance policy included screening of the rectum and throat upon admission and once a week thereafter if there were any known CRAB carriers in the unit. Additional screening sources were tracheal aspirate in ventilated patients and skin in patients who were contacts of a CRAB carrier.
Isolates
CRAB isolates from 21 patients and two environmental sources were shipped to the reference laboratory; no isolate was shipped for one patient. Isolates were grown on selective agar (modified CHROMagar Acinetobacter, containing 4.5 mg/mL meropenem, HyLabs, Rehovot, Israel) and identified to the species level using VITEK MS (GN card) (bioMérieux SA, Marcy l’Etoile, France). Antibiotic susceptibility was determined using VITEK 2 (bioMérieux).
FTIR typing
FTIR typing was performed according to the IR Biotyper (Bruker, Leipzig, Germany) manufacturer’s instructions. Briefly, isolates were grown for 24 hours on 5% sheep blood in tryptic soy agar (HyLabs, Rehovot, Israel) at 35±2°C, and samples were loaded on a 96-spot silicon sample plate (Bruker) in quadruplicate. Spectra were analyzed using hierarchical cluster analysis with Euclidean distance and average linkage. A dendrogram was generated by OPUS 7.5 software (Bruker) and was analyzed in the polysaccharide region (800–1,300 cm^−1^), as recommended by the manufacturer. A randomly selected, unrelated CRAB isolate served as a control. Quality control was performed according to the manufacturer’s recommendations and based on several criteria: absorption (0.4 arbitrary units [AU] < D value < 2 AU), noise (<150 × 10^−6^ AU), presence of water (<300 × 10^−6^ AU), and fringes (<100 × 10^−6^ AU). Samples that did not meet the quality control criteria were excluded from the analysis. Following inspection of the resulting dendrogram, we selected the cutoff value of 0.25, the most conservative cutoff option recommended by the manufacturer for A. baumannii (0.25–0.4). We examined the appropriateness of this cutoff by SNP analysis, as described below.
WGS and bioinformatics analysis
We selected 12 isolates for WGS representing the various clusters and singletons identified by FTIR. The sink isolate could not be grown and therefore only 11 isolates were sequenced. Whole genomic DNA was extracted from a loop of overnight colonies re-suspended in 100 µL phosphate buffered saline. A total of 90 µL bacterial lysis buffer and 10 µL Proteinase K (Qiagen GmbH, Germany) were added, incubated for 10 min at 65°C then 10 min at 95°C. High-molecular-weight DNA was isolated using the MagLEAD 12gC (PSS co.) and MagDEA DX Sv Kit, according to the manufacturer’s instructions. Genomes were sent to Plasmidsaurus (Eugene, OR, USA) for Illumina sequencing. Isolates were annotated using Prokka and typed using PubMLST according to the Pasteur scheme. Antibiotic resistance genes were detected using ResFinder version 0.7.1. Plasmid GR groups were determined by BlastN versus a reference of GR types and by PlasmidFinder (https://cge.food.dtu.dk/services/PlasmidFinder/). Pan-genome analysis of the 11 genomes was constructed using Roary version 3.12.0 with an unrelated CRAB isolate as a control. A phylogenetic tree was constructed using RAxML version 8.2.12 with the GTRGAMMA model. SNP and average nucleotide identity (ANI) analysis was performed using CLC workbench version 25.0.2. To determine the genetic distance between isolates in the same FTIR cluster, SNP analysis was carried out using the earliest isolate as the reference. Similarly, distance between clusters was determined using a single common reference.
The reference list from the paper itself. Each links out to its DOI / PubMed record.
- 1Lemos EV, de la Hoz FP, Einarson TR, Mc Ghan WF, Quevedo E, Castañeda C, Kawai K. 2014. Carbapenem resistance and mortality in patients with Acinetobacter baumannii infection: systematic review and meta-analysis. Clin Microbiol Infect 20:416–423. doi:10.1111/1469-0691.1236324131374 · doi ↗ · pubmed ↗
- 2Kramer A, Schwebke I, Kampf G. 2006. How long do nosocomial pathogens persist on inanimate surfaces? a systematic review. BMC Infect Dis 6:130. doi:10.1186/1471-2334-6-13016914034 PMC 1564025 · doi ↗ · pubmed ↗
- 3Lee CR, Lee JH, Park M, Park KS, Bae IK, Kim YB, Cha CJ, Jeong BC, Lee SH. 2017. Biology of Acinetobacter baumannii: pathogenesis, antibiotic resistance mechanisms, and prospective treatment options. Front Cell Infect Microbiol 7:55. doi:10.3389/fcimb.2017.0005528348979 PMC 5346588 · doi ↗ · pubmed ↗
- 4Ayoub Moubareck C, Hammoudi Halat D. 2020. Insights into Acinetobacter baumannii: a review of microbiological, virulence, and resistance traits in a threatening nosocomial pathogen. Antibiotics (Basel) 9:119. doi:10.3390/antibiotics 903011932178356 PMC 7148516 · doi ↗ · pubmed ↗
- 5Hu Y, Zhou H, Lu J, Sun Q, Liu C, Zeng Y, Zhang R. 2021. Evaluation of the IR biotyper for Klebsiella pneumoniae typing and its potentials in hospital hygiene management. Microb Biotechnol 14:1343–1352. doi:10.1111/1751-7915.1370933205912 PMC 8313285 · doi ↗ · pubmed ↗
- 6Guliev RR, Suntsova AY, Vostrikova TY, Shchegolikhin AN, Popov DA, Guseva MA, Shevelev AB, Kurochkin IN. 2020. Discrimination of Staphylococcus aureus strains from coagulase-negative Staphylococci and other pathogens by fourier transform infrared spectroscopy. Anal Chem 92:4943–4948. doi:10.1021/acs.analchem.9b 0505032129600 · doi ↗ · pubmed ↗
- 7Oho M, Nagasawa Z, Funashima Y, Ueda O, Watamabe S, Cui L, Miyamoto H, Sueoka E. 2021. Correlation of strain classification with IR biotyper and molecular epidemiological method of Pseudomonas aeruginosa. Rinsho Biseibutshu Jinsoku Shindan Kenkyukai Shi 31:29–40.34986645 · pubmed ↗
- 8Kon H, Temkin E, Elmalih P, Keren-Paz A, Ben-David D, Najjar-Debbiny R, Gottesman T, Carmeli Y. 2023. Analysis of four carbapenem-resistant Acinetobacter baumannii outbreaks using Fourier-transform infrared spectroscopy. Infect Control Hosp Epidemiol 44:991–993. doi:10.1017/ice.2022.10935535742 · doi ↗ · pubmed ↗