Clinical Significance of Mean and Day-to-Day Variability of Home Blood Pressure in Chronic Kidney Disease: A Retrospective Cohort Study
Takeshi Tosaki, Daisuke Nakashima, Takaya Sasaki, Makoto Sagasaki, Yu Honda, Shinya Yokote, Nobuo Tsuboi, Takashi Yokoo

TL;DR
This study shows that both high average blood pressure and its daily fluctuations may worsen kidney disease progression.
Contribution
The novel finding is that blood pressure variability interacts with mean blood pressure to worsen chronic kidney disease outcomes.
Findings
Higher mean systolic blood pressure was linked to faster kidney function decline.
Blood pressure variability alone did not predict outcomes but interacted with mean BP to worsen kidney disease.
Stabilizing blood pressure may be important alongside lowering it in CKD patients.
Abstract
Hypertension is a key risk factor for chronic kidney disease (CKD) progression. While mean blood pressure (BP) is well known to predict kidney outcomes, the role of BP variability (BPV)―especially day-to-day variability measured at home―in CKD remains unclear. In this retrospective cohort study of 150 patients with CKD, home systolic BP (SBP) was measured daily for up to 28 days. Mean SBP and day-to-day BPV (standard deviation of daily SBP) were calculated. Associations with the annual estimated glomerular filtration rate (eGFR) slope and a composite kidney endpoint (≥40% eGFR decline, kidney failure, or kidney-related death) were analyzed using linear mixed-effects models and Cox regression. The interaction between mean SBP and BPV on kidney outcomes was also evaluated. The study population consisted of 150 patients (mean age, 66.1 years; 52% male) with a mean baseline eGFR of 43.2…
Genes, proteins, chemicals, diseases, species, mutations and cell lines named across the full text — each resolved to its canonical identifier and authoritative record.
Click any figure to enlarge with its caption.
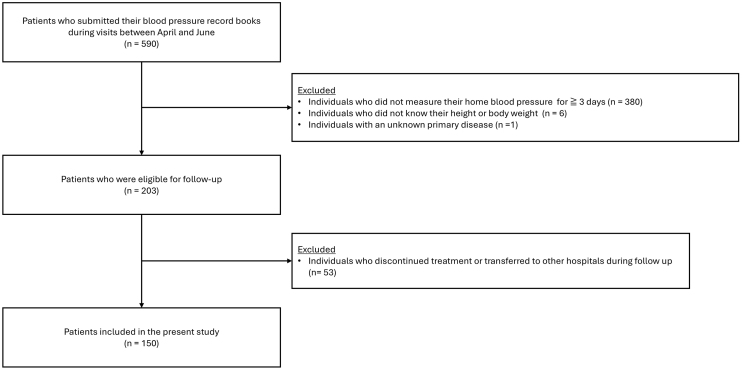 Figure 1
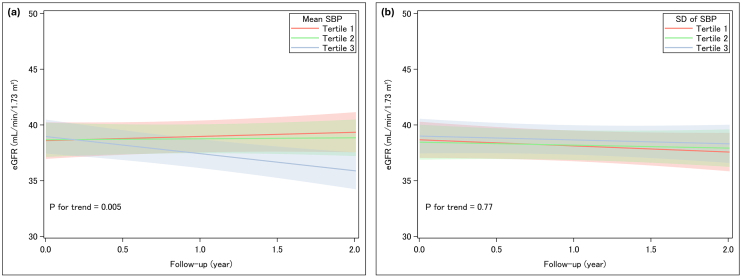 Figure 2
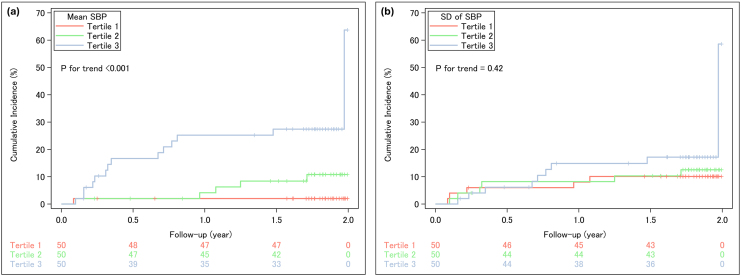 Figure 3
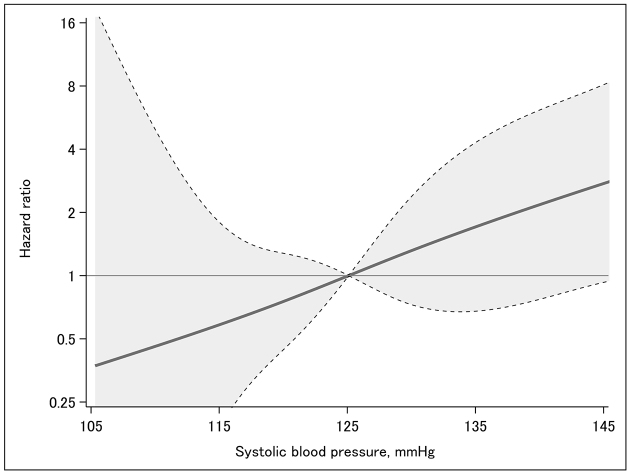 Figure 4
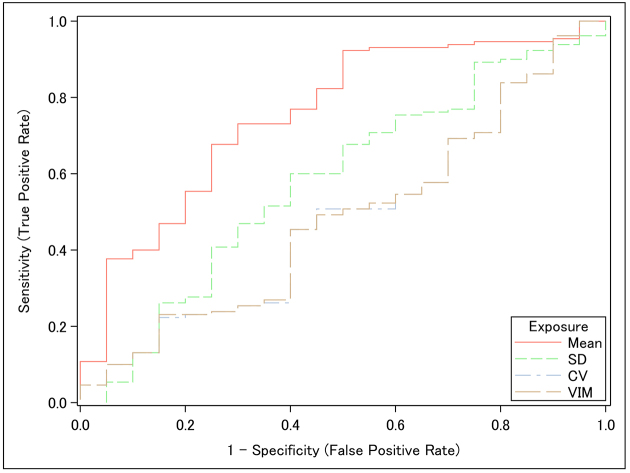 Figure 5
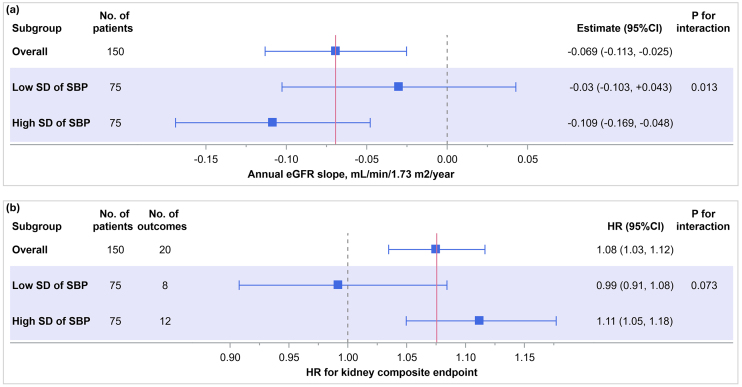 Figure 6
| Variables | Overall | Tertiles of mean home SBP, mmHg | p for trend | Tertiles of SD levels of home SBP, mmHg | p for trend | ||||
|---|---|---|---|---|---|---|---|---|---|
| Tertile 1, <119.3 | Tertile 2, 119.4-129.7 | Tertile 3, ≥129.8 | Tertile 1, <6.035 | Tertile 2, 6.036-8.292 | Tertile 3, ≥8.293 | ||||
| n = 150 | n = 50 | n = 50 | n = 50 | n = 50 | n = 50 | n = 50 | |||
| Age, years | 66.1 (16.2) | 58.9 (17.1) | 69.1 (14.1) | 70.4 (15.1) | <0.001 | 60.5 (16.6) | 64.2 (17.3) | 73.6 (11.6) | <0.001 |
| Male, n (%) | 78 (52) | 23 (46) | 26 (52) | 29 (58) | 0.23 | 26 (52) | 27 (54) | 25 (50) | 0.84 |
| Mean home SBP, mmHg | 125.5 (12.5) | 112.5 (6.2) | 125.1 (2.9) | 138.8 (8.5) | <0.001 | 119.8 (11.2) | 125.2 (10.4) | 131.4 (13.1) | <0.001 |
| Mean home DBP, mmHg | 75.8 (8.6) | 72.0 (5.1) | 75.7 (8.5) | 79.7 (10.2) | <0.001 | 75.2 (6.8) | 76.0 (8.9) | 76.2 (10.3) | 0.83 |
| Antihypertensive medication use, n (%) | 118(78.7) | 36 (72) | 41 (82) | 41 (82) | 0.22 | 40 (80) | 39 (78) | 39 (78) | 0.81 |
| Calcium channel blocker | 73 (48.7) | 16 (32.0) | 26 (52.0) | 31 (62.0) | 0.003 | 23 (46.0) | 24 (48.0) | 26 (52.0) | 0.55 |
| Renin-angiotensin system inhibitor | 97 (64.7) | 31 (62.0) | 35 (70.0) | 31 (62.0) | 1.00 | 35 (70.0) | 29 (58.0) | 33 (66.0) | 0.68 |
| Angiotensin receptor-neprilysin inhibitor | 3 (2.0) | 0 (0.0) | 0 (0.0) | 3 (6.0) | 0.032 | 1 (2.0) | 2 (4.0) | 0 (0.0) | 0.48 |
| Mineralocorticoid receptor antagonist | 11 (7.3) | 2 (4.0) | 4 (8.0) | 5 (10.0) | 0.45 | 2 (4.0) | 3 (6.0) | 6 (12.0) | 0.12 |
| Beta-blocker | 15 (10.0) | 1 (2.0) | 6 (12.0) | 8 (16.0) | 0.020 | 4 (8.0) | 5 (10.0) | 6 (12.0) | 0.51 |
| Alpha-blocker | 11 (7.3) | 1 (2.0) | 2 (4.0) | 8 (16.0) | 0.007 | 3 (6.0) | 4 (8.0) | 4 (8.0) | 0.70 |
| Thiazide diuretic | 15 (10.0) | 2 (4.0) | 4 (8.0) | 9 (18.0) | 0.020 | 4 (8.0) | 7 (14.0) | 4 (8.0) | 1.00 |
| Sodium-glucose cotransporter-2 inhibitor | 23 (15.3) | 7 (14.0) | 11 (22.0) | 5 (10.0) | 0.58 | 5 (10.0) | 8 (16.0) | 10 (20.0) | 0.17 |
| Primary kidney disease, n (%)* | 0.47* | 0.22* | |||||||
| Nephrosclerosis | 48 (32) | 16 (32) | 17 (34) | 15 (30) | NA | 21 (42) | 14 (28) | 13 (26) | NA |
| Diabetic kidney disease | 10 (6.7) | 1 (2) | 3 (6) | 6 (12) | NA | 0 (0) | 4 (8) | 6 (16) | NA |
| Chronic glomerulonephritis | 84 (56) | 31 (62) | 28 (56) | 25 (50) | NA | 27 (54) | 29 (58) | 28 (56) | NA |
| Autosomal dominant polycystic kidney disease | 8 (5.3) | 2 (4) | 2 (4) | 4 (8) | NA | 2 (4) | 3 (6) | 3 (6) | NA |
| Diabetes, n (%) | 38 (25.3) | 11 (22) | 10 (20) | 17 (34) | 0.17 | 8 (16) | 11 (22) | 19 (38) | 0.011 |
| Serum LDL cholesterol, mmol/L | 2.67 (0.71) | 2.70 (0.68) | 2.58 (0.59) | 2.73 (0.83) | 0.55 | 2.66 (0.66) | 2.77 (0.67) | 2.58 (0.79) | 0.39 |
| Use of lipid-modifying medication, n (%) | 48 (32) | 11 (22) | 20 (40) | 17 (34) | 0.20 | 16 (32) | 19 (38) | 13 (26) | 0.52 |
| Hypercholesterolemia, % | 72 (48) | 20 (40) | 27 (54) | 25 (50) | 0.32 | 26 (52) | 25 (50) | 21 (42) | 0.32 |
| Body mass index, kg/m2 | 23.3 (4.5) | 23.0 (4.2) | 23.6 (5.2) | 23.8 (4.3) | 0.81 | 23.9 (4.7) | 23.4 (4.4) | 22.7 (4.5) | 0.40 |
| Serum uric acid, mg/dL | 5.5 (1.2) | 5.9 (1.4) | 5.7 (1.3) | 6.0 (1.1) | 0.15 | 5.6 (1.3) | 5.7 (1.1) | 6.1 (1.3) | 0.19 |
| Estimated glomerular filtration rate, mL/min per 1.73 m2 | 43.2 (20.7) | 48.3 (18.9) | 43.1 (20.8) | 38.3 (21.4) | 0.054 | 47.8 (21.8) | 47.3 (23.3) | 34.6 (12.9) | 0.001 |
| Urine protein, g/gCr | 0.83 (1.39) | 0.49 (0.79) | 0.69 (1.04) | 1.30 (1.97) | 0.009 | 0.66 (1.05) | 0.67 (1.16) | 1.15 (1.80) | 0.13 |
| Current smoking habits, n (%) | 15 (10.0) | 3 (6) | 3 (6) | 9 (18) | 0.05 | 3 (6) | 7 (14) | 5 (10) | 0.51 |
| Current drinker, n (%) | 49 (32.7) | 16 (32) | 18 (36) | 15 (30) | 0.83 | 14 (28) | 20 (40) | 15 (30) | 0.83 |
| Tertile of mean home SBP, mmHg | At risk, n | Events, n | Competing events (deaths), n | Crude | Multivariable-adjusted | ||
|---|---|---|---|---|---|---|---|
| HR (95% CI) | p for trend | HR (95% CI) | p for trend | ||||
|
| |||||||
| Tertile 1, <119.3 | 50 | 1 | NA | 1 (reference) | <0.001 | 1 (reference) | 0.016 |
| Tertile 2, 119.4-129.7 | 50 | 5 | NA | 5.3 (0.6-45.2) | 4.2 (0.5-37.9) | ||
| Tertile 3, ≥129.8 | 50 | 14 | NA | 17.4 (2.3-132.6) | 9.2 (1.1-77.6) | ||
|
| |||||||
| Tertile 1, <119.3 | 50 | 1 | 1 | 1 (reference) | <0.001 | 1 (reference) | 0.005 |
| Tertile 2, 119.4-129.7 | 50 | 5 | 1 | 5.3 (0.6-46.0) | 4.3 (0.6-34.4) | ||
| Tertile 3, ≥129.8 | 50 | 14 | 2 | 16.5 (2.1-130.4) | 9.1 (1.4-59.6) | ||
Peer Reviews
No public reviews on file for this paper yet. If you reviewed it on a platform where reviews are public (OpenReview, ICLR, NeurIPS, ICML), you can paste yours below so the community can read it here.
Videos
No videos yet. Explain this paper in a talk, walkthrough, or lecture? Add one.
Taxonomy
TopicsBlood Pressure and Hypertension Studies · Chronic Kidney Disease and Diabetes · Dialysis and Renal Disease Management
Introduction
Hypertension is a well-established risk factor for the development of cardiovascular disease and chronic kidney disease (CKD) ^(1)^. Beyond absolute blood pressure levels, growing evidence indicates that blood pressure (BP) variability (BPV) may independently contribute to cardiovascular mortality and kidney-related outcomes ^(2), (3), (4)^. BPV is defined as fluctuations in blood pressure over various timeframes, including beat-to-beat (very short term), within 24 hours (short-term), day-to-day (mid-term), and visit-to-visit or monthly intervals (long-term).
In community-dwelling populations, several studies have shown that various BPV indices are associated with a decline in estimated glomerular filtration rate (eGFR) and an increased risk of kidney failure ^(3), (5)^. One study also demonstrated that day-to-day variability in home BP measurements is linked to incident CKD in a Japanese general population ^(6)^.
Among patients with prevalent CKD, prior studies evaluating the influence of short-term BPV using ambulatory BP monitoring or long-term BPV based on clinic visits have also shown potential associations with adverse kidney outcomes ^(7), (8)^. However, few studies have evaluated the association between day-to-day BPV assessed using home BP measurements and kidney dysfunction progression in this high-risk population. Therefore, in the present study, we aimed to investigate whether mean home BP and day-to-day BPV, calculated as the standard deviation (SD) of daily home systolic BP (SBP), are associated with kidney function decline and progression of kidney dysfunction in patients with CKD, and to evaluate whether day-to-day BPV modifies the relationship between mean home BP and kidney outcomes.
Materials and Methods
Study population
This retrospective cohort study was conducted at the Department of Nephrology, Kawaguchi Municipal Medical Center, Kawaguchi, Japan. In this department, nephrologists or outpatient clinic nurses routinely provide instructions on home BP measurement. Patients are encouraged to record their BP values in a diary and to bring the diary to each nephrology outpatient visit. Based on this routine clinical practice, we retrospectively collected data for the present study. This retrospective analysis was approved by the Institutional Review Board of Kawaguchi Municipal Medical Center (Approval code: 2025-19), which granted a waiver of consent. Patient data was included unless participants explicitly requested to opt out via public disclosure.
The inclusion criteria were patients not receiving maintenance dialysis or kidney transplantation who submitted self-recorded home BP logs between April and June 2023. Patients were excluded if they had fewer than three days of home BP measurements, missing height or weight data, or an unknown primary kidney disease. As shown in Figure 1, a total of 590 patients were initially identified. Of these, 387 patients were excluded for the reasons listed above (insufficient BP data, n = 380; missing data, n = 6; unknown primary disease, n = 1), leaving 203 patients eligible for follow-up. During the two-year observation period, an additional 53 patients were excluded because they discontinued follow-up or were transferred to another facility. Thus, the final study population consisted of 150 patients. The primary diagnosis for kidney diseases was obtained from medical records.
Flow diagram of patient selection.
Exposures: BP parameters
As mentioned above, patients were routinely instructed during nephrology outpatient visits to measure their home BP three times each morning at one-minute intervals within one hour of waking, before breakfast, and before taking medications, after at least five minutes of seated rest. Participants used commercially available upper-arm automated BP monitors available in Japan; however, the device type was not standardized, and validation according to international protocols was not confirmed. Patients manually recorded their BP values in self-reported logs. The median duration of home BP monitoring was 27 days (range: 4-28 days). For each patient, the mean and SD of SBP were calculated from the daily average SBP values. Day-to-day BPV was defined as the SD of these daily SBP values. Patients were categorized into tertiles based on mean SBP and SD of SBP as follows: (i) mean SBP―tertile 1, <119.3 mmHg; tertile 2, 119.4-129.7 mmHg; tertile 3, ≥129.8 mmHg; and (ii) SD of SBP―tertile 1, <6.035 mmHg; tertile 2, 6.036-8.292 mmHg; tertile 3, ≥8.293 mmHg. In addition to SD, other BPV indices were evaluated, including the coefficient of variation (CV), calculated as SD divided by mean BP × 100, and variability independent of the mean (VIM), calculated as SD divided by the mean to the power of x, multiplied by the population mean to the power of x ^(9)^.
Outcomes
The primary outcome was the annual eGFR slope, which has recently been established as a validated surrogate marker for kidney function decline and is known for its high sensitivity in detecting kidney dysfunction progression ^(10)^. The secondary outcome was a composite kidney endpoint defined as a ≥40% decline in eGFR, progression to kidney failure, or death related to kidney failure. Kidney failure was defined as initiation of kidney replacement therapy or an eGFR <15 mL/min/1.73 m^2^.
eGFR was evaluated every one to three months during routine outpatient visits throughout the follow-up period, and was calculated using the equation for the Japanese population ^(11)^. Serum creatinine was measured using an enzymatic method. Data for study outcomes and laboratory measures were collected until June 2025. Participants who did not reach the kidney endpoint were censored at their last outpatient visit during the follow-up period.
Statistical analysis
The association between SBP parameters (e.g., mean SBP, SD of SBP) and eGFR slope was analyzed using linear mixed-effects models for repeated measures ^(12)^. The cumulative incidence of the composite kidney endpoint was estimated using the Kaplan-Meier method, and differences among exposure levels were assessed using the log-rank test. Hazard ratios for the composite kidney endpoint according to tertiles of SBP were calculated using the Cox proportional hazards model. Multivariable-adjusted models were adjusted for age, sex, urinary protein-to-creatinine ratio (log-transformed), use of renin-angiotensin system inhibitors, and use of sodium-glucose cotransporter 2 inhibitors. The model also tested for trends across the SBP tertiles using an ordinal variable. Interactions between subgroups were tested by adding multiplicative terms to the model. A competing risk analysis was also conducted for all-cause death using the Fine and Gray method. Receiver operating characteristic (ROC) curve analyses were performed to evaluate the predictive ability of mean SBP, SD, CV, and VIM for the composite kidney endpoint. Sensitivity analyses were performed for the CV of SBP and VIM of SBP as BPV indices. In subgroup analyses, interactions between the mean SBP and SD of SBP were tested for associations with kidney outcomes (annual eGFR slope and composite endpoint).
All statistical tests were two-sided, and p-values <0.05 were considered statistically significant. Analyses were conducted using SAS software, version 9.4 (SAS Institute, Cary, NC, USA).
Results
Baseline characteristics
The study population consisted of 150 patients with a mean age of 66.1 years; 52% were male. The mean home SBP was 125.5 mmHg, and the mean SD of home SBP was 7.85 mmHg. Baseline characteristics stratified by tertiles of mean home SBP and SD of home SBP are presented in Table 1. Higher mean SBP was significantly associated with older age, higher mean diastolic BP (DBP), and lower eGFR. Similarly, higher SD of SBP was associated with older age, higher mean SBP and DBP, and lower eGFR.
Association with annual eGFR decline
The multivariable-adjusted mixed-effects model for repeated measures revealed that higher mean SBP was significantly associated with a steeper decline in annual eGFR slope (p for trend = 0.005; Figure 2a). The annual eGFR slopes (mL/min/1.73 m^2^/year) with 95% confidence intervals for each tertile of mean SBP were +0.37 (-0.59, +1.34), -0.09 (-0.83, +1.01), and -1.54 (-2.46, -0.62), respectively. In contrast, BPV indices of SBP (SD, CV, and VIM) showed no significant associations with eGFR slope (Figure 2b, Figure S1). Similarly, mean DBP was associated with kidney outcomes, but DBP variability was not (Figure S2).
Longitudinal changes in eGFR stratified by systolic blood pressure SBP parameters.(a) Mean SBP and (b) SD of SBP were categorized into tertiles. Individual lines represent the estimated eGFR trajectory over a two-year follow-up for each tertile, based on linear mixed-effects models for repeated measures. Shaded areas indicate 95% confidence intervals.eGFR: estimated glomerular filtration rate; SBP: systolic blood pressure; SD: standard deviation.
Composite kidney endpoint
During the two-year follow-up period, 20 patients reached the composite kidney endpoint, defined as a ≥40% decline in eGFR, eGFR <15 mL/min/1.73 m^2^, or initiation of kidney replacement therapy. Kaplan-Meier curves showed that patients with higher mean SBP had a significantly greater risk of kidney events (p for trend <0.001; Figure 3a). BP variability indices were not significantly associated with this composite endpoint (Figure 3b; Figure S3).
Incidence of the kidney composite endpoint stratified by SBP parameters.(a) Mean SBP and (b) SD of SBP were categorized into tertiles. Individual lines represent the incidence of the composite kidney endpoint over a two-year follow-up for each tertile, based on Kaplan-Meier analysis. The composite kidney endpoint was defined as a ≥40% decline in estimated glomerular filtration rate, progression to kidney failure, or death from kidney failure.eGFR: estimated glomerular filtration rate; SBP: systolic blood pressure; SD: standard deviation.
In the multivariable-adjusted Cox proportional hazards model and the multivariable-adjusted Fine-Gray model with death as a competing risk, mean SBP showed a significant positive association with the composite kidney endpoint (Table 2). Moreover, a cubic spline analysis revealed a linear association between mean SBP and the composite kidney endpoint (Figure 4).
Multivariable-adjusted cubic spline curve showing the association between mean SBP and the composite kidney endpoint.A restricted cubic spline curve with 95% confidence intervals (gray shaded areas) illustrates the cumulative incidence of the composite kidney endpoint over the two-year follow-up. The composite kidney endpoint was defined as a ≥40% decline in estimated glomerular filtration rate, progression to kidney failure, or death from kidney failure. Results were adjusted for age, sex, urinary protein-to-creatinine ratio (log-transformed), use of renin-angiotensin system inhibitors, and use of sodium-glucose cotransporter two inhibitors.SBP: systolic blood pressure.
A ROC curve analysis was performed to evaluate the discriminative ability of SBP indices. The discriminative ability of mean SBP for the composite kidney endpoint was superior to that of BP variability indices (i.e., SD, CV, and VIM) (Figure 5).
ROC curves illustrating the predictive utility of SBP parameters for the composite kidney endpoint.ROC curves were generated for mean SBP, SD of SBP, CV of SBP, and VIM of SBP. The composite kidney endpoint was defined as a ≥40% decline in estimated glomerular filtration rate, progression to kidney failure, or death from kidney failure.CV: coefficient of variation; ROC: receiver operating characteristic; SBP: systolic blood pressure; SD: standard deviation; VIM: variability independent of the mean.
Subgroup analysis: interaction of mean SBP with BPV
As shown in Figure 6, the associations between mean SBP and kidney outcomes were modified by SBP variability. In the low SD of SBP group, the annual eGFR slope (mL/min/1.73 m^2^/year) associated with mean SBP was -0.03 (95% CI: -0.103 to +0.043), whereas in the high SD group, the slope was steeper at -0.109 (95% CI: -0.169 to -0.048), with a significant interaction (p for interaction = 0.013). Similarly, the hazard ratio for the composite kidney endpoint per unit increase in mean SBP was 0.99 (95% CI: 0.91 to 1.08) in the low SD group and 1.11 (95% CI: 1.05 to 1.18) in the high SD group, with a marginal interaction (p = 0.073).
Association of mean SBP with kidney outcomes stratified by SD of SBP.The associations between mean SBP and (a) the annual eGFR slope and (b) the incidence of the composite kidney endpoint were stratified by the median SD of SBP. For eGFR slope (a): linear mixed-effects models were used; for the composite outcome (b): Cox proportional hazards models were applied.eGFR: estimated glomerular filtration rate; SBP: systolic blood pressure; SD: standard deviation.
Discussion
In this study of patients with CKD, higher mean SBP was significantly associated with a steeper decline in eGFR and a higher risk of kidney disease progression, and it showed good predictive ability for progression in ROC analysis. In contrast, the BPV indices SD, CV, and VIM were not independently associated with these outcomes. Notably, we observed a significant interaction indicating that the adverse effect of elevated mean SBP on kidney outcomes was more pronounced among patients with greater BPV.
While the association between higher mean BP and kidney disease progression is well-established ^(13), (14), (15)^, the role of BPV remains less clear. Several studies have examined visit-to-visit BPV in patients with CKD, but their findings have been inconsistent ^(8), (16), (17), (18), (19), (20)^. Our study contributes to this area by focusing on day-to-day BPV assessed through home BP monitoring, which may more accurately capture short-term hemodynamic stress. To date, only one previous study, by Okada et al. ^(21)^, has evaluated this type of BPV in CKD patients, and it similarly found no association with kidney outcomes. However, their study did not assess potential effect modification by BPV. In our analysis, while day-to-day BPV was not independently associated with eGFR decline or kidney failure, we found that elevated mean BP had a more pronounced adverse effect in individuals with higher BPV. These findings suggest that mean BP remains a dominant predictor of CKD progression. Although BPV itself was not an independent risk factor, its interaction with mean BP indicates that patients with unstable BP may be more vulnerable to the harmful effects of hypertension. This underscores the importance of not only achieving but also maintaining stable BP control in CKD management. Clinicians should therefore consider both average BP levels and day-to-day variability when adjusting antihypertensive treatment, particularly in patients with fluctuating home BP readings.
The synergistic effect of elevated mean BP and high BPV may be explained by increased hemodynamic stress and endothelial dysfunction. In animal models, Eto et al. ^(22)^ showed that increased BPV impairs endothelial function by inhibiting nitric oxide production and promoting neointimal formation, independently of mean BP levels, while Nakano et al. ^(23)^ reported a negative association between visit-to-visit BPV and flow-mediated dilation in CKD patients, suggesting BPV-related endothelial injury. In CKD, impaired autoregulatory capacity of the kidney increases susceptibility to glomerular damage even from moderate BP elevations ^(24)^, and BPV may further exacerbate this glomerular vulnerability through endothelial stress. Additionally, increased day-to-day BPV has been linked to arterial stiffness in the general population ^(25)^, and experimental studies in hypertensive rats have shown that higher BPV alone can worsen arteriosclerosis in the kidney microvasculature ^(26)^. These findings suggest that combined exposure to elevated mean BP and BPV may amplify vascular injury and promote CKD progression. Moreover, elevated BP levels and variability may indicate poor medication adherence, which could also contribute to adverse kidney outcomes ^(27), (28)^.
Several limitations of this study should be acknowledged. First, its observational design precludes causal inference between BP measures and kidney outcomes. Second, the relatively small sample size reduced statistical power and may have prevented the detection of an independent association between BPV and kidney outcomes. Third, the subgroup analyses were exploratory and hypothesis-generating, warranting confirmation in larger prospective studies. Fourth, potential confounding from unmeasured variables, such as medication adherence, may partly explain the lack of an independent association between BPV and kidney outcomes. Fifth, variability in BP measurement may have arisen from non-standardized devices, unassessed adherence, and the self-reported nature of home BP monitoring. Finally, excluding participants with fewer than three days of measurements may have introduced selection bias toward more adherent or health-conscious individuals, or those with more severe disease.
Conclusions
Mean home SBP is a robust and clinically relevant predictor of kidney disease progression in patients with CKD. While BPV was not an independent predictor, its interaction with mean BP suggests that BP instability may amplify the harmful effects of hypertension. Future studies should explore interventions targeting not only BP reduction but also BP stabilization to optimize kidney and cardiovascular outcomes in this population.
Article Information
Acknowledgments
We thank the patients who participated in this study. We are also grateful to the medical staff at Kawaguchi Municipal Medical Center for their valuable contributions to data collection and patient care.
Author Contributions
Conceptualization & Design; Data Curation; Formal Analysis & Visualization; Investigation; Manuscript Drafting; Review & Editing: Takeshi Tosaki, Daisuke Nakashima, and Takaya Sasaki. Investigation; Review & Editing: Makoto Sagasaki and Yu Honda. Supervision; Review & Editing: Shinya Yokote, Nobuo Tsuboi, and Takashi Yokoo. Contributed equally to this work: Takeshi Tosaki and Daisuke Nakashima.
Conflicts of Interest
None
IRB Approval Code and Name of the Institution
This study was approved by the Institutional Review Board of Kawaguchi Municipal Medical Center (Approval code: 2025-19).
Supplement
Supplementary Material
The reference list from the paper itself. Each links out to its DOI / PubMed record.
- 1Zhou B, Perel P, Mensah GA, et al. Global epidemiology, health burden, and effective interventions for elevated blood pressure and hypertension. Nat Rev Cardiol. 2021;18(11):785-802.34050340 10.1038/s 41569-021-00559-8PMC 8162166 · doi ↗ · pubmed ↗
- 2Frattola A, Parati G, Cuspidi C, et al. Prognostic value of 24-hour blood pressure variability. J Hypertens. 1993;11(10):1133-7.8258679 10.1097/00004872-199310000-00019 · doi ↗ · pubmed ↗
- 3Chia YC, Lim HM, Ching SM. Long-term visit-to-visit blood pressure variability and renal function decline in patients with hypertension over 15 years. J Am Heart Assoc. 2016;5(11):e 003825.27821404 10.1161/JAHA.116.003825 PMC 5210361 · doi ↗ · pubmed ↗
- 4Steinsaltz D, Patten H, Bester D, et al. Short-term and mid-term blood pressure variability and long-term mortality. Am J Cardiol. 2025;234:71-8.39447722 10.1016/j.amjcard.2024.10.005 · doi ↗ · pubmed ↗
- 5Wang X, Wang F, Chen M, et al. Twenty-four-hour systolic blood pressure variability and renal function decline in elderly male hypertensive patients with well-controlled blood pressure. Clin Interv Aging. 2018;13:533-40.29670339 10.2147/CIA.S 161752 PMC 5894670 · doi ↗ · pubmed ↗
- 6Sasaki T, Sakata S, Oishi E, et al. Day-to-day blood pressure variability and risk of incident chronic kidney disease in a general Japanese population. J Am Heart Assoc. 2022;11(19):e 027173.36172942 10.1161/JAHA.122.027173 PMC 9673700 · doi ↗ · pubmed ↗
- 7Wang Q, Wang Y, Wang J, et al. Short-term systolic blood pressure variability and kidney disease progression in patients with chronic kidney disease: results from C-STRIDE. J Am Heart Assoc. 2020;9(12):e 015359.32508195 10.1161/JAHA.120.015359 PMC 7429039 · doi ↗ · pubmed ↗
- 8Yokota K, Fukuda M, Matsui Y, et al. Impact of visit-to-visit variability of blood pressure on deterioration of renal function in patients with non-diabetic chronic kidney disease. Hypertens Res. 2013;36(2):151-7.23013884 10.1038/hr.2012.145 · doi ↗ · pubmed ↗