Repeatability of retinal vessel flicker responses in healthy individuals
Angelos Kalitzeos, Robert J. Summers, Rebekka Heitmar

TL;DR
This study shows that retinal vessel responses to flicker light are repeatable in healthy individuals, with raw data providing more consistent results than proprietary software.
Contribution
The study introduces a comparison of retinal vessel response repeatability using raw data versus proprietary software outputs.
Findings
Retinal vessel parameters were comparable across three different timepoints in healthy individuals.
Raw RVA data showed better repeatability than parameters generated by the RVA software.
Time to reach maximum dilation and constriction was least repeatable between visits.
Abstract
To determine the repeatability of retinal blood vessel parameters (from proprietary software and the raw vessel data) measured in vivo in healthy individuals at rest, during and post flicker light (FL) provocation using a standardised protocol. We recorded the diameters of one retinal artery and one vein in each of 33 healthy adult volunteers at rest, during and post FL provocation on two occasions using the Retinal Vessel Analyser (RVA). Repeat visits were scheduled at three different timepoints: (1) within 30 mins on the same day, (2) within a fortnight and (3) within a month (n = 11, each). All participants underwent intraocular and systemic blood pressure assessment to ensure these were comparable between visits. Retinal vessel parameters at rest, during and post FL provocation were comparable between all pairs of visits for all three groups. Repeatability between visits was…
Genes, proteins, chemicals, diseases, species, mutations and cell lines named across the full text — each resolved to its canonical identifier and authoritative record.
Click any figure to enlarge with its caption.
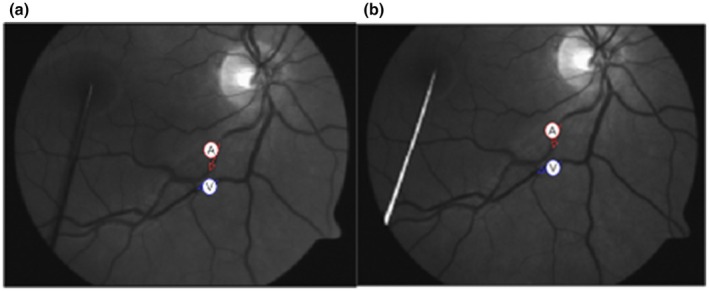 FIGURE 1
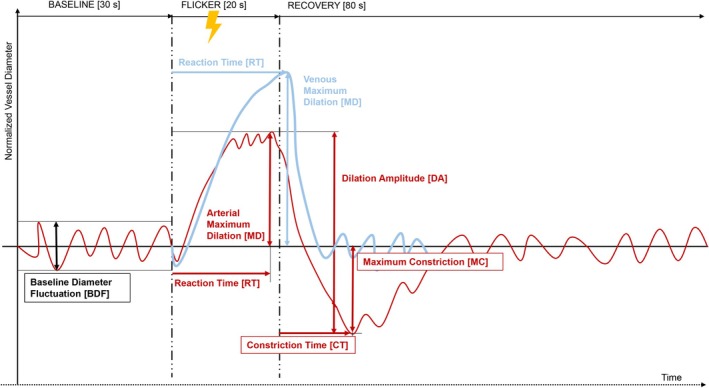 FIGURE 2
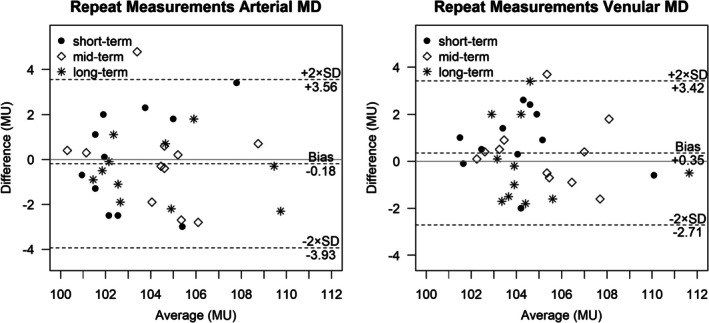 FIGURE 3
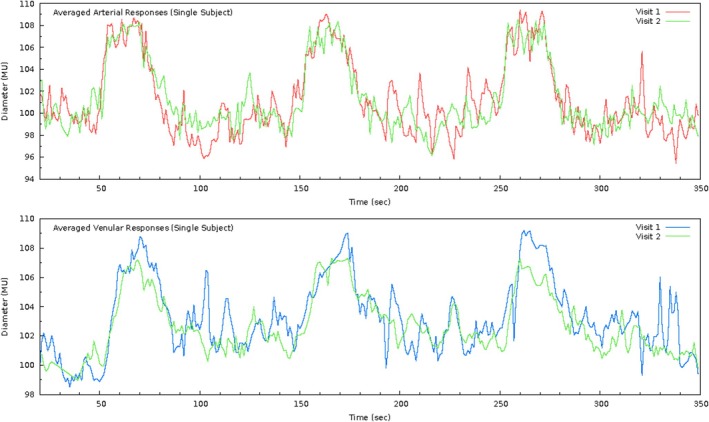 FIGURE 4
| M1 | M2 | M1 | M2 | M1 | M2 | |
|---|---|---|---|---|---|---|
| Characteristic | a ( | b ( | c ( | |||
| Age (years) | 32 ± 9 | 35 ± 10 | 28 ± 5 | |||
| Males: Females | 5: 6 | 7: 4 | 3: 8 | |||
| Caucasian: Asian | 8: 3 | 9: 2 | 5: 6 | |||
| Intraocular pressure (mmHg) | 13 ± 3 | 12 ± 3 | 12 ± 4 | 12 ± 4 | 13 ± 4 | 12 ± 3 |
| Systolic blood pressure (mmHg) | 110 ± 17 | 111 ± 16 | 114 ± 10 | 111 ± 14 | 117 ± 14 | 115 ± 14 |
| Diastolic blood pressure (mmHg) | 68 ± 13 | 69 ± 13 | 73 ± 8 | 72 ± 6 | 72 ± 11 | 72 ± 9 |
| Mean arterial blood pressure (mmHg) | 82 ± 14 | 83 ± 13 | 87 ± 8 | 85 ± 7 | 87 ± 12 | 87 ± 10 |
| Heart rate (pulses/min) | 72 ± 8 | 71 ± 9 | 69 ± 7 | 69 ± 8 | 71 ± 12 | 73 ± 12 |
| Artery diameter (MU) | 118 ± 17 | 119 ± 17 | 118 ± 23 | 118 ± 23 | 120 ± 10 | 119 ± 10 |
| Vein diameter (MU) | 146 ± 21 | 144 ± 21 | 150 ± 20 | 148 ± 18 | 155 ± 15 | 156 ± 15 |
| Parameter | Measurement 1 | Measurement 2 |
| ICC (95% CI) |
|---|---|---|---|---|
| Arteries ( | ||||
| Baseline diameter fluctuation (%) |
4 ± 2 (1.3–9.7) |
3.9 ± 1.8 (1.3–8.4) | 0.784 |
0.53 (0.22–0.74) moderate |
| Maximum dilation (%) |
3.8 ± 2.6 (0.5–9.5) |
4 ± 2.6 (0.1–10.9) | 0.574 |
0.75 (0.56–0.87) good |
| Maximum constriction (%) |
−3.4 ± 2.3 (−9.2–1.7) |
−3.3 ± 1.7 (−6.2–1.6) | 0.628 |
0.59 (0.31–0.77) moderate |
| Dilation amplitude (%) |
7.2 ± 3.1 (1.8–13.1) |
7.2 ± 2.9 (2.8–13.4) | 0.955 |
0.69 (0.45–0.83) moderate |
| Baseline‐corrected flicker response (%) |
3.2 ± 1.6 (0.2–7.8) |
3.3 ± 1.7 (0.5–6.3) | 0.596 |
0.70 (0.48–0.84) moderate |
| Reaction time (s) |
16 ± 5 (8–29) |
17 ± 5 (7–26) | 0.782 |
−0.03 (−0.38–0.31) poor |
| Constriction time (s) |
36 ± 7 (13–46) |
35 ± 10 (0–47) | 0.574 |
0.34 (0–0.61) poor |
| Veins ( | ||||
| Baseline diameter fluctuation (%) |
3.1 ± 1.7 (1.1–8.9) |
2.8 ± 1.6 (1.1–8.8) | 0.203 |
0.69 (0.46–0.83) moderate |
| Maximum dilation (%) |
4.8 ± 2.2 (1.6–11.4) |
4.5 ± 2.4 (1–11.9) | 0.193 |
0.79 (0.61–0.89) good |
| Reaction time (s) |
22 ± 5 (15–35) |
20 ± 5 (11–33) | 0.155 |
0.05 (−0.28–0.37) poor |
| Parameter (%) | Measurement 1 |
| Measurement 2 |
| ICC (95% CI) |
|---|---|---|---|---|---|
|
| 3.3 ± 2.1 (0–9) | 0.329 | 3.1 ± 2.3 (−0.8–8.7) | 0.109 |
0.72 (0.50–0.85) moderate |
| Maximum dilation (arteries) | 3.8 ± 2.6 (0.5–9.5) | 4 ± 2.6 (0.1–10.9) |
0.75 (0.56–0.87) good | ||
|
| −0.8 ± 1.1 (−3.6–2.1) |
| −0.8 ± 0.9 (−2.6–1.2) |
|
0.05 (0.00–0.38) poor |
| Maximum constriction | −3.4 ± 2.3 (−9.2–1.7) | −3.3 ± 1.7 (−6.2–1.6) |
0.59 (0.31–0.77) moderate | ||
|
| 4.1 ± 2.6 (−0.6–10.8) |
| 3.9 ± 2.4 (−0.3–9.7) |
|
0.55 (0.26–0.75) moderate |
| Dilation amplitude (arteries) | 7.2 ± 3.1 (1.8–13.1) | 7.2 ± 2.9 (2.8–13.4) |
0.69 (0.45–0.83) moderate | ||
|
| 3.6 ± 2.1 (0.6–9.3) |
| 3.7 ± 2.7 (−0.5–10.1) | 0.297 |
<0.00 poor |
| Maximum dilation (veins) | 4.8 ± 2.2 (1.6–11.4) | 4.5 ± 2.4 (1–11.9) |
0.79 (0.61–0.89) good |
Peer Reviews
No public reviews on file for this paper yet. If you reviewed it on a platform where reviews are public (OpenReview, ICLR, NeurIPS, ICML), you can paste yours below so the community can read it here.
Videos
No videos yet. Explain this paper in a talk, walkthrough, or lecture? Add one.
Taxonomy
TopicsRetinal Imaging and Analysis · Glaucoma and retinal disorders · Cardiovascular Health and Disease Prevention
INTRODUCTION
1
When introduced, the Retinal Vessel Analyser (RVA, Imedos, Germany) was used to record retinal vessel diameters across time, with high temporal and spatial resolution but under constant illumination (baseline conditions) only (Pache et al., 2002; Polak et al., 2000). Until then, quantification of retinal diameters relied heavily on static retinal photography. With the introduction of flicker light stimulation, which induces increased metabolic demand in the retinal tissue and the capability to measure in vivo retinal vascular reactivity, a plethora of different measurement protocols and parameters have been introduced (Heitmar & Summers, 2012; Streese et al., 2021).
Despite a substantial number of studies detailing attempts to exploit the potential of RVA for risk prediction and stratification in a number of pathologies, there has been limited work in examining the repeatability of flicker responses. Studies reporting on the repeatability of the flicker responses are either irrelevant to the current hardware and protocol or incomplete. Polak et al. reported a 25% Coefficient of Variation (CV) of flicker‐evoked retinal diameter responses (n = 9) across 5 repeats, but it is unclear whether this reflected arterial, venular or combined data (Polak et al., 2002). A later study (Garhöfer et al., 2003) reported flicker‐induced vasodilation CV values (n = 12) of 15.2% for arteries and 20.3% for veins, across two repeats. However, both aforementioned studies used an early model of the RVA system (spectrally separated illumination and flickering light), a flicker frequency of 8 Hz (unlike the current 12.5 Hz) and a protocol of 60 s of baseline illumination followed by 60 s of flickering light. Nagel et al. (2006) were the first to report on short‐term (1 h) and long‐term (1 month) CV values of flicker responses (~1%) using the current measurement protocol but an older camera model (n = 28) and measured only one parameter: Maximum Dilation (MD) of arteries and veins averaged across three flicker cycles. Short‐term (30–60 min) repeatability of values calculated with the inbuilt RVA analysis has been reported in healthy Asians (n = 33) using the Pearson correlation coefficient and Bland–Altman (B‐A) analyses (Nguyen et al., 2009), while correlation analyses is a poor tool to evaluate repeatability (Halligan, 2002) as it only shows the strength of linear association between two variables and lacks information on measurement agreement; B‐A analyses is a more suitable method to assess measurement agreement (Giavarina, 2015). While their Pearson correlation coefficients for baseline diameters and maximum dilation for arteries and veins were 0.95 (arteries) and 0.98 (veins), 0.85 (arteries) and 0.8 (veins), respectively. The B‐A analyses, however, showed a bias of 0.044 for arterial diameters and 0.217 for venous diameters due to flicker provocation with 95% limits of agreement (LOA) for retinal arterioles and venules of 2.060/−1.971 and 8.847/−2.414, respectively. A later publication (n = 78) on the repeatability of individual flicker responses (per flicker cycle) reports data on CV values for MD (arteries: 1.3 ± 1.1%; veins: 1 ± 0.8%), Maximum Constriction (MC) (arteries: 1.2 ± 0.9%; veins: 0.8 ± 0.6%) and Reaction Time (RT) (arteries: 31.5 ± 19.3%; veins: 17.9 ± 12.7%) (Heitmar et al., 2010). Short‐term retesting (30 min) has also been examined in healthy participants (n = 20) with intraclass correlation coefficient (ICC) values of 0.94 and 0.56 for arterial and venular MD, respectively (Noonan et al., 2013).
Despite a feature review on the RVA and its applicability, highlighting several ‘unresolved open questions’ (Garhöfer et al., 2010) in particular reproducibility of flicker responses, few have been addressed to date. The aim of this study was to evaluate the repeatability of vascular parameters (for both arteries and veins) as measured with the standard 12.5 Hz, three cycle flicker protocol, in healthy participants.
METHODS
2
Participants
2.1
All measurements were performed by a single examiner (AK). Tests were performed twice in one arbitrarily selected eye in 33 healthy volunteers. Repeat tests took place within (a) 15–30 mins (short‐term), (b) 3–14 days (mid‐term) and (c) 16–28 days (long‐term) with 11 individuals in each group, respectively. Mid‐term repeat tests took place at the same time of the day, ranging from 0 to 52 mins apart. Long‐term repeat tests took place at the same time of the day for the majority (n = 7), ranging from 1 to 60 mins apart, with the remaining 4 participants tested between 3.5 and 8.5 h apart. All participants conformed to the following criteria: aged over 18 years, with no history of systemic or ocular vascular disease or epilepsy, medication‐free and with clear optical media. For a minimum of 12 h prior to testing, participants were instructed to abstain from smoking, consuming alcoholic or caffeinated products, as well as from taking up any sort of strenuous physical activity.
Written informed consent was obtained from all participants. The study complied with the tenets of the Declaration of Helsinki, and ethics approval was granted by the Aston University Ethics Committee.
Data acquisition
2.2
All measurements took place in a temperature‐controlled room (21–24°C). Participants remained seated for at least 20 min prior to the start of the examination to ensure stable haemodynamic conditions. Non‐contact tonometry (Pulsair EasyEye, Keeler Ltd., UK) was performed to assess intraocular pressure (IOP) using a validated method and protocol (Ogbuehi & Almubrad, 2008). Three readings were obtained from each eye, and the average value was recorded.
Blood pressure (BP) was measured from the brachial artery of the left forearm using a validated (Rogoza et al., 2000), automated, oscillometric, digital BP monitor (UA‐767, A&D Instruments Ltd., UK). Three consecutive readings of Systolic BP (SBP), Diastolic BP (DBP) and Heart Rate (HR) were recorded, and mean arterial BP (MABP) was calculated according to the formula:
Details on the measuring principle of the RVA have been described previously (Nagel et al., 2004). The standard flicker protocol (Nagel et al., 2005) was carried out, which comprises 50 s of baseline illumination (of which the initial 20 s were consequently discarded from analysis), followed by three 100‐s cycles of 20 s of flickering light and 80 s of recovery. Following full pupil dilation using Tropicamide (1% w/v, Bausch & Lomb, UK), dynamic retinal vessel assessment in one arbitrarily selected eye commenced. The fellow eye was covered to achieve good fixation. During the examination, subjects were encouraged to blink normally (to maintain a sufficiently wet cornea) and to keep steady fixation. A pin that served as a fixation target was placed accordingly in order to position the desired vessel segments centrally as viewed on the computer monitor (Figure 1). The measurement location selected was a minimum of 1 disc diameter (DD) away from the rim of the optic nerve head (ONH). First, the arterial vessel segment was selected, then the venular one, and as soon as the software registered successfully the corresponding positions, the measurement session started automatically. In case the contrast between the vessels and the background retinal tissue was inadequate, or other degradations affecting video quality appeared, the measurement was aborted and restarted.
Sample vessel selection. (a) First measurement session, (b) Second measurement session. Red arrow denotes the arterial segment and blue arrow the venular one.
Standardisations
2.3
Each participant's inferior temporal vessels were assessed. When the patient is in slight upward gaze with a dilated pupil, this ensured that the upper lid was naturally positioned higher than in straight forward or slight down gaze. The higher lid position meant it was less likely to reduce the pupillary aperture; therefore, ensuring a more consistent and uniform illumination throughout the measurement cycle.
Vessel length selection was governed by each individual's angioarchitecture but was always kept as long as possible. Nevertheless, when selecting vessel segments for a measurement in real time, no two pairs can be selected to be precisely of equal length. Thus, in order to standardise comparisons and to eliminate potential confounding effects of the segment length measured across repeats, the following procedure was applied: for each vessel pair, measured segments were truncated to exactly equal lengths by processing the raw data matrix output of the RVA. Moreover, for the repeated measurement, the repetition feature of the software was used, which automatically measures at exactly the same location as in the initial measurement session. In a few cases, this was not possible due to registration issues; then the location was manually matched as closely as possible.
Outcome variables tested
2.4
Data were analysed independently of the vendor‐supplied software. Custom‐built scripts were implemented to process raw RVA data. Details are provided elsewhere (Kalitzeos, 2014). The following parameters were calculated (a schematic can be seen in Figure 2) and compared across the two measurement sessions, averaging all three flicker cycles per session:
- Baseline diameter fluctuation (BDF), the maximum amplitude (peak‐to‐peak) for arteries and veins, 30 s prior to (each) flicker start (Nagel et al., 2004)
- Maximum dilation (MD), the maximum 1‐s diameter for arteries and veins, within 50 s after (each) flicker start (Heitmar et al., 2010)
- Maximum constriction (MC), the minimum 1‐s diameter for arteries, within 50 s after (each) flicker start (Heitmar et al., 2010)
- Dilation amplitude (DA), the difference between MD and MC for arteries (Heitmar et al., 2010)
- Baseline‐corrected flicker response (bFR), the difference between DA and BDF for arteries (Nagel et al., 2004)
- Reaction time (RT), time (in seconds) to reach MD for arteries and veins (Heitmar et al., 2010)
- Constriction time (CT), time (in seconds) to reach MC for arteries (Heitmar, Blann, et al., 2011; Heitmar, Cubbidge, et al., 2011)
Schematic showing the calculation of retinal vessel parameters from raw Retinal Vessel Analyser data. Parameters in red were calculated for arteries, parameters in blue were calculated for veins and parameters in black were calculated for both arteries and veins.
Arteriolar and venular diameters relative to the baseline were recorded in measuring units (MU) which correspond to μm in the Gullstrand model eye and compared across repeats. In addition, we report the inbuilt RVA software‐generated parameters of A max, A min, A peak and V max and compare these to arterial MD, MC, DA and venular MD, respectively. Software‐generated dilatory responses, for arteries (A max, A min, A peak) and veins (V max) represent the averaged responses across 3 flicker cycles, also averaged within an arbitrarily chosen time window that encompasses 6 s: 3 s before and 3 s after flicker cessation (Mandecka et al., 2007).
Statistical analysis
2.5
SPSS (Version 13.0, Chicago, SPSS Inc.) was used for all statistical analyses. Graphs were created in R (version 4.4.3). Normality tests were performed on all continuous data by means of the Shapiro–Wilk test to determine distribution. Where normally distributed, data are expressed as means ± SD and repetitions are compared by paired‐samples t‐tests. Group means were compared with one‐way analysis of variance. Outcome variables were compared between measurement sessions using Bland–Altman plots. Test–retest repeatability was assessed by calculating ICC values (single measures) with a 95% confidence interval (CI) (two‐way mixed effects model, absolute agreement) (Koo & Li, 2016). For all statistical tests, an alpha level of 0.05 was used.
RESULTS
3
Participant characteristics for each measurement session (M1, M2) and for all three repeat subgroups – (a) short‐term, (b) mid‐term and (c) long‐term – are shown in Table 1. A representative retinal arterial and venular recording of one individual across two measurement sessions 7 days apart (mid‐term) is shown in Figure 4.
All continuous variables were normally distributed, so parametric tests were employed. One‐way analysis of variance between groups (a), (b) and (c) revealed no statistically significant differences either for both measurement sessions (M1, M2) or for their difference (M1‐M2) (Table S1). Bland–Altman plots of all parameters (BDF, MD, MC, DA, BFR, RT, CT, A max, A min, A peak and V max) using labelled data points belonging to all three subgroups of short‐term, mid‐term and long‐term repeats (a, b and c, respectively) did not reveal any significant systematic difference (bias) or trend of increasing variance with increasing time‐frame or otherwise (plots shown for arterial and venular Maximum Dilation only, Figure 3). Hence, ICC values were calculated including all 33 participants (Table 2).
Bland–Altman plots of arterial maximum dilation (left) and venular maximum dilation (right) averaged across three flicker cycles (measuring units; MU) for short‐term (15–30 min), mid‐term (3–14 days) and long‐term (16–28 days) repeat measurements (n = 11, each).
For both arteries and veins, Maximum Dilation was the most repeatable parameter with an ICC estimate of 0.75 and 0.79 (95% confidence intervals ranging from ‘moderate’ to ‘good’ according to the classification suggested by (Koo & Li, 2016)), respectively. Venular BDF showed lower levels of repeatability (0.69) and was more repeatable compared to its arterial counterpart (0.53). Reaction Time and Constriction Time for arteries and Reaction Time for veins were found to be the least repeatable (<0.34). Paired‐samples t‐tests showed no statistically significant differences between the two repeat measurements. Repeatability of RVA software‐generated responses (A max, A min, A peak and V max) was on average worse than their counterparts generated using raw data analysis (arterial MD, MC, DA and venular MD, respectively) (Table 3). Paired‐samples t‐tests also revealed statistically significant differences for MC, DA (for both M1, M2) and venular MD (for M1 only) (Table 3).
TABLE 3: Intraclass correlation coefficients, across measurement sessions and comparison between software‐generated output (A max, A min, A peak, V max) and raw output flicker analysis (maximum dilation [MD], maximum constriction [MC], dilation amplitude [DA]), within measurement sessions.
DISCUSSION
4
We have shown that, in general, superior repeatability is obtained for retinal vessel parameters computed from the raw arterial or venule diameter profiles in response to flicker light stimulation than the parameterisations provided by RVA software.
Substantial repeatability is paramount for any parameter should it be used for diagnostic, follow‐up, monitoring or risk stratification purposes. Despite the RVA being in the research forefront for over two decades and a number of reviews (Heitmar & Summers, 2012; Lim et al., 2013; Streese et al., 2020) and one consensus report (Garhöfer et al., 2010) being published highlighting shortcomings and possibilities, very little attention has gone into the assessment of flicker responses' repeatability.
In addition to the RVA software output, numerous groups have introduced a plethora of dilatory‐response parameters for arteries and veins (Heitmar & Summers, 2012; Streese et al., 2021). This proliferation in parameters is most likely due to the lack of a standardised parameterisation among research groups and the selective reporting of markers most suited to show differences in vessel responses in a diverse range of clinical groups with systemic (i.e. diabetes, cardiovascular disease) and ocular vascular disease (i.e. diabetic retinopathy, glaucoma) (Gugleta et al., 2012; Mandecka et al., 2007). Stratification between different pathologies has not been assessed widely, with only a few studies showing differences between disease stages (Mandecka et al., 2007) and systemic disease(s) (Al‐Fiadh et al., 2014; Günthner et al., 2022; Heitmar et al., 2017). Disease progression monitoring also requires good repeatability, as parameters with large variability could potentially mask disease progression. Unfortunately, most vessel parameters lack validation, at least in terms of repeatability.
The purpose of this study was to examine the repeatability of the vessel dilatory‐response parameters using the most commonly applied 3‐flicker (12.5 Hz) cycle protocol (Nagel et al., 2004) in healthy eyes. Although some data have been published on the repeatability of flicker responses, these are limited to a single parameter (Maximum Dilation) (Al‐Fiadh et al., 2014; Nagel et al., 2006; Noonan et al., 2013) or have become redundant with the introduction of the 12.5 Hz inbuilt flicker module (Garhöfer et al., 2003; Polak et al., 2000). Others have included repeatability data including responses with only one valid flicker cycle (Nguyen et al., 2009), whereas the main purpose of a repeat provocation protocol (three flicker cycles) is to minimise noise and variance and thus increase accuracy and confidence. So, when assessing repeatability, it is crucial to ensure all provocation cycles are completed and included in any subsequent analysis.
By adhering to a strict protocol where across measurements the location and vessel length were closely matched and only those measurements with three full flicker cycles were included, our analyses yielded ‘moderate’ to ‘good’ agreement for the majority of parameters, apart from blood vessel reaction times, which had ‘poor’ agreement (Koo & Li, 2016). A possible explanation for this could be due to the way Reaction Time and Constriction Time are calculated: the time taken from flicker start to the mathematical maximum/minimum (respectively) following flicker provocation. As most healthy individuals show a two‐stage reaction during flicker light provocation (Heitmar & Summers, 2015; Summers & Heitmar, 2025) characterised by a rapid diameter increase followed by a plateau, the time until the mathematical maximum can vary substantially depending on the extent of the plateau phase (Figure 4). Similarly for arterial constriction and Constriction Time.
Sample flicker responses (raw data) for a single individual for arteries (top) and veins (bottom) for two measurement sessions 7 days apart (mid‐term). Initial 20 s have been discarded.
Software‐generated parameters appear to underestimate vessel responses in both arteries and veins when compared to the independently analysed values (Table 3), in line with previous findings (Heitmar et al., 2010; Streese et al., 2021). This is a direct consequence of the entirely dissimilar definitions of the two: the former are calculated as the mathematical average across a narrow time window between 17 and 23 s after flicker initiation, whereas the latter select the mathematical maximum (or minimum) within a wider time window post flicker start. The assumption of the definition of the software‐generated parameters is that the range of higher (or lower) dilatory responses expected to be found within 3 s prior to flicker cessation and 3 s after is proving problematic, as most young individuals reach their maximum much earlier than this 6‐s window (Heitmar et al., 2010; Heitmar & Summers, 2015; Streese et al., 2021; Summers & Heitmar, 2025). Constriction Time, for instance, in our sample population is found to fluctuate around 36 ± 7 (for M1) and 35 ± 10 (for M2) seconds, which includes time points well beyond that narrow 6‐s range (Table 2). Hence, the differences for A min and A peak to their counterparts (MC and DA, respectively) are found to be significantly different. Similarly, albeit to a lesser extent, this is true for venular RT values; hence, the differences are borderline significant for M1 and insignificant for M2. Arterial MD is not statistically significantly different from A max, but the trend still exists. The strength of this study lies within the standardised approach to data collection and analysis, in particular, including only data where all three flicker cycles were completed and by keeping vessel lengths constant. Additionally, the vast majority (18/22) of participants had repeat tests at the same time of the day (for mid‐ and long‐term visits) to mitigate the effect of potential diurnal variations. While, on the other hand, one of our limitations is the relatively small sample size and the fact that we examined a multi‐ethnic cohort. However, as most of our clinical cohorts consist of multi‐ethnic groups, it was important for us to reflect this in our sampling.
In conclusion, our data on repeatability highlights the importance to consider the strength of some parameters vs. others when choosing a suitable parameter identifying group differences and to plan follow‐up measurements. Our results are in agreement with the sample published in healthy Asians (Nguyen et al., 2009) but highlight the variability of the parameters derived from retinal vessels during flicker provocation. Future studies should consider the data spread of retinal vessel reactivity parameters when considering effect size and sample size calculations.
Supporting information
Table S1:
The reference list from the paper itself. Each links out to its DOI / PubMed record.
- 1Al‐Fiadh, A.H. , Farouque, O. , Kawasaki, R. , Nguyen, T. T. , Uddin, N. , Freeman, M. et al. (2014) Retinal microvascular structure and function in patients with risk factors of atherosclerosis and coronary artery disease. Atherosclerosis, 233(2), 478–484.24530782 10.1016/j.atherosclerosis.2013.12.044 · doi ↗ · pubmed ↗
- 2Garhöfer, G. , Bek, T. , Boehm, A.G. , Gherghel, D. , Grunwald, J. , Jeppesen, P. et al. (2010) Use of the retinal vessel analyzer in ocular blood flow research. Acta Ophthalmologica, 88, 717–722.19681764 10.1111/j.1755-3768.2009.01587.x · doi ↗ · pubmed ↗
- 3Garhöfer, G. , Zawinka, C. , Huemer, K.H. , Schmetterer, L. & Dorner, G.T. (2003) Flicker light–induced vasodilatation in the human retina effect of lactate and changes in mean arterial pressure. Investigative Ophthalmology & Visual Science, 44, 5309–5314.14638731 10.1167/iovs.03-0587 · doi ↗ · pubmed ↗
- 4Giavarina, D. (2015) Understanding bland Altman analysis. Biochemical Medicine, 25(2), 141–151.10.11613/BM.2015.015PMC 447009526110027 · doi ↗ · pubmed ↗
- 5Gugleta, K. , Kochkorov, A. , Waldmann, N. , Polunina, A. , Katamay, R. , Flammer, J. et al. (2012) Dynamics of retinal vessel response to flicker light in glaucoma patients and ocular hypertensives. Graefe's Archive for Clinical and Experimental Ophthalmology, 250, 589–594.10.1007/s 00417-011-1842-222008947 · doi ↗ · pubmed ↗
- 6Günthner, R. , Streese, L. , Angermann, S. , Lorenz, G. , Braunisch, M.C. , Matschkal, J. et al. (2022) Mortality prediction of retinal vessel diameters and function in a long‐term follow‐up of haemodialysis patients. Cardiovascular Research, 118, 3239–3249.35576475 10.1093/cvr/cvac 073 · doi ↗ · pubmed ↗
- 7Halligan, S. (2002) Reproducibility, repeatability, correlation and measurement error. The British Journal of Radiology, 75, 193–194.11893647 10.1259/bjr.75.890.750193 · doi ↗ · pubmed ↗
- 8Heitmar, R. , Blann, A. , Cubbidge, R.P. , Lip, G. & Gherghel, D. (2010) Continuous retinal vessel diameter measurements ‐ the future of retinal vessel assessment? Investigative Ophthalmology & Visual Science, 51, 5833–5839.20435593 10.1167/iovs.09-5136 · doi ↗ · pubmed ↗