Milk Kefir Beverage Improves Histomorphometry, Reduces Inflammatory Infiltrates and Desulfovibrio and Increases Lactobacillus in IL‐10−/− Mice
Iasmim Xisto Campos, Vinicius Fernandes Paris, Mariana de Fátima Albuquerque Pereira, Gabriela de Cássia Ávila Alpino, Andressa Ladeira Bernardes, Larissa Gabriela Morais de Ávila, Marcella Duarte Villas Mishima, Manoela Maciel dos Santos Dias, Soraya Torres Gaze Jangola

TL;DR
Milk kefir reduces inflammation and improves gut health in mice lacking a key anti-inflammatory protein.
Contribution
The study shows milk kefir reduces inflammation and alters gut microbiota in IL-10−/− mice, a model for inflammatory bowel disease.
Findings
Kefir improved histomorphometry and increased goblet cells in the small intestine.
Kefir reduced inflammatory infiltrates and Desulfovibrio while increasing Lactobacillus.
Kefir increased butyrate levels, an anti-inflammatory short-chain fatty acid.
Abstract
This study aimed to evaluate the effects of milk kefir on parameters related to inflammatory bowel disease (IBD) in interleukin‐10 knockout (IL‐10−/−) mice. Sixteen C57BL/6J IL‐10−/− male mice were divided into two experimental groups. The control group (n = 8) received 0.4 mL of whole milk (UHT) and the kefir group (n = 8) received 0.4 mL of a fermented beverage made from milk kefir grains (2.4 × 10⁸ colony‐forming units [CFU]), both administered via gavage for 4 weeks. Feces were collected and body weight was measured weekly. At the end of the study, the animals were anesthetized and euthanized, and the small intestine and cecum content were collected for analysis. Proximate composition of kefir and microbiological analysis were conducted. Histomorphometry measurements and quantification of short‐chain fatty acids (SCFAs) were conducted in small intestine. SFCAs were also evaluated in…
Genes, proteins, chemicals, diseases, species, mutations and cell lines named across the full text — each resolved to its canonical identifier and authoritative record.
Click any figure to enlarge with its caption.
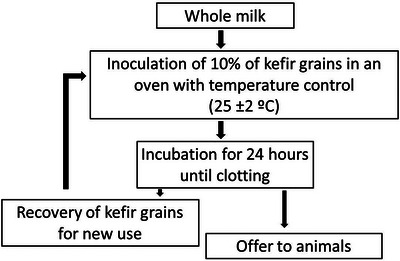 FIGURE 1
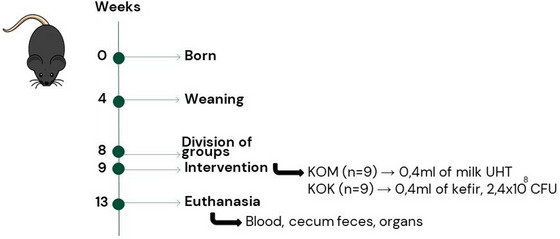 FIGURE 2
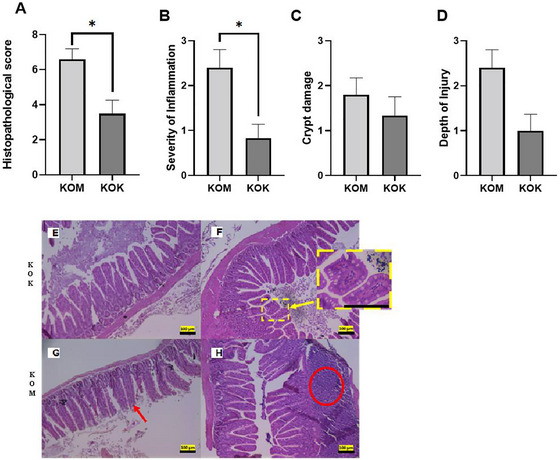 FIGURE 3
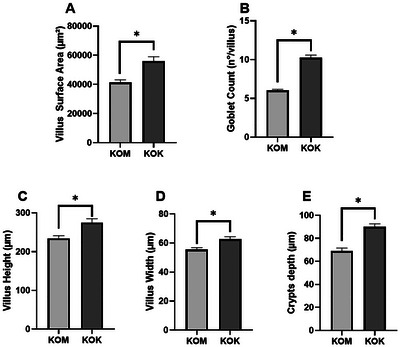 FIGURE 4
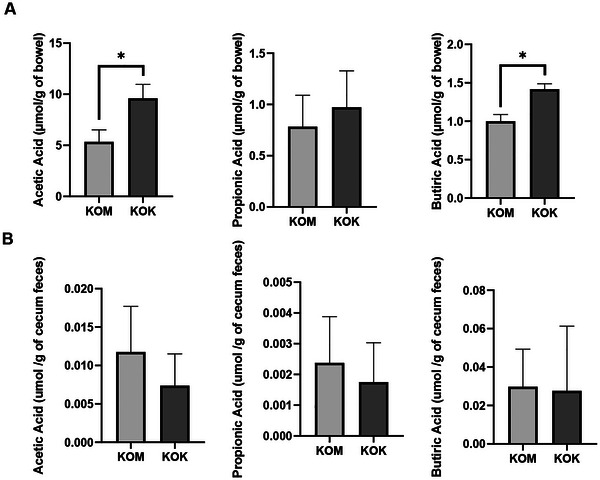 FIGURE 5
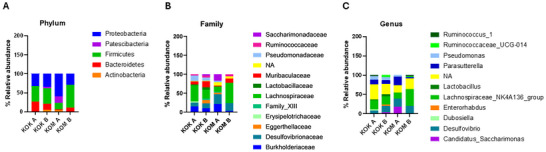 FIGURE 6
| Week | Mean of body weight (g) |
| Evolution of body weight (g) |
| ||
|---|---|---|---|---|---|---|
| KOM | KOK | KOM | KOK | |||
|
| 24.77 ± 0.74 | 23.67 ± 1.28 | 0.0538 | |||
|
| 25.65 ± 0.89 | 24.67 ± 1.32 | 0.1050 | |||
|
| 26.60 ± 1.08 | 24.40 ± 1.40 | 0.0034* | 0.96 ± 0.42 | −0.27 ± 0.39 | 0.0002* |
|
| 25.96 ± 2.05 | 24.84 ± 1.33 | 0.2233 | −0.65 ± 1.08 | 0.46 ± 0.59 | 0.0232* |
|
| 26.09 ± 1.45 | 25.04 ± 1.18 | 0.1459 | 0.33 ± 0.87 | 0.18 ± 0.53 | 0.6859 |
|
| 22.75 ± 1.37 | 22.28 ± 1.49 | 0.5200 | −3.50 ± 0.44 | −2.76 ± 1.34 | 0.1867 |
- —Conselho Nacional de Desenvolvimento Científico e Tecnológico10.13039/501100003593
- —Coordination for the Improvement of Higher Education Personnel10.13039/501100002322
- —Ministry of Education, Brazil10.13039/501100006366
- —Fundação de Amparo à Pesquisa do Estado de Minas Gerais10.13039/501100004901
Peer Reviews
No public reviews on file for this paper yet. If you reviewed it on a platform where reviews are public (OpenReview, ICLR, NeurIPS, ICML), you can paste yours below so the community can read it here.
Videos
No videos yet. Explain this paper in a talk, walkthrough, or lecture? Add one.
Taxonomy
TopicsProbiotics and Fermented Foods · Infant Nutrition and Health · Gastrointestinal motility and disorders
Introduction
1
Inflammatory bowel disease (IBD) is a chronic disorder that can affect any part of the gastrointestinal tract (Chou et al. 2019; Sairenji et al. 2017; Ng et al. 2017). The term comprises the disorders of Crohn's disease (CD) and ulcerative colitis (UC), which differ from an anatomical and histological perspective (Hadji and Bouchemal 2022). The pathogenesis is multifactorial, with an impact from the association between genetics and environmental factors and intestinal microbiota (Dai et al. 2023; Ananthakrishnan 2015). Due to the different related events, the development of efficient therapies to combat IBD is a challenge (Venegas et al. 2019).
The intestinal microbiota is directly related to the development of IBD, given that the same factors influencing microbiota composition can also have an impact on IBD, such as breastfeeding, antibiotics, and diet (Pittayanon et al. 2020; Qiu et al. 2021). Therefore, alterations in the composition or functionality of the microbiota, such as a reduction in alpha bacterial diversity and a decrease in the production of short‐chain fatty acids (SCFAs), can influence the progression of the disease (Qiu et al. 2021; Kostic et al. 2014; Russo et al. 2019).
Regarding treatment strategies in IBD, the use of probiotics stands out, and one of the potential mechanisms they are involved in is their immunomodulatory effect and anti‐inflammatory properties (Lê et al. 2022; Selvamani et al. 2022). In this context, kefir is a fermented beverage, which is obtained through fermentation by a protocooperation of bacteria and yeasts, known as “kefir grains,” that settle in a substrate matrix with milk or water (Azizi et al. 2021; de Souza et al. 2024). As the beverage obtained by kefir grains fermentation exhibits probiotic microbial species, recent studies in the literature place the application of kefir with the potential to obtain probiotic foods with probiotic effects, along with the production of bioactive compounds such as bioactive peptides, amino acids, SCFA, enzymes, and bacteriocins, adding beneficial properties to the beverage (de Souza et al. 2024; Pihurov et al. 2021). Experimental models of intestinal inflammation have been used in studies about the pathophysiology of diseases and the development of new therapeutics. Interleukin‐10 knockout mice (IL‐10^−/−^) develop spontaneous chronic inflammation (Mizoguchi 2012), affecting the entire gastrointestinal tract but predominantly the colon region, resembling IBD in humans from a histopathological perspective (Elson et al. 1995; Davidson et al. 1996).
Therefore, the present study aimed to evaluate the effects of milk kefir beverage consumption on parameters related to IBD in an experimental model of (IL‐10^−/−^) mice.
Materials and Methods
2
Preparation of the Kefir Beverage
2.1
The kefir grains were obtained from families who traditionally consume them in the city of Viçosa, Minas Gerais, Brazil. The production of the fermented beverage was carried out at the Laboratory of Nutritional Biochemistry, Department of Nutrition and Health (DNS) at Federal University of Viçosa (UFV).
To produce fermented kefir beverage, the grains were separated into portions and 10% of the kefir grains were inoculated into commercially obtained whole cow's milk (UHT) from a single brand and batch. After inoculation, the milk containing the kefir grains was kept at a controlled temperature of 25°C ± 2°C for 24 h, without agitation (D. D. Rosa et al. 2016). The grains were separated from the fermented milk (kefir), washed with distilled water, and reused for a new production successively. The product obtained from kefir fermentation was offered to the animals during the intervention period (Figure 1).
Milk kefir production flowchart.
The same fermentation protocol, using the same kefir grains, was performed daily during all the experimental design period, ensuring that the mice consumed a similar product (10^8^ colony‐forming units [CFU]/mL for lactic acid bacteria (LAB) and 10^4^ CFU/mL for yeasts).
Proximate Composition of Kefir and pH Evaluation
2.2
The fermented kefir beverage was freeze‐dried. The difference in weight between the liquid and dried products was used to calculate moisture content. The powdered product was used for the assessment of proximate composition (protein, lipids, ashes, and carbohydrates). All the analyses were conducted following methods described by AOAC (Association of Official Analytical Chemistry 2005) and performed in triplicate. The quantity of carbohydrates was inferred by difference. The pH of the fermented kefir beverage was determined using a pH meter (Instrutherm, model PH‐1900, Brazil) (Instituto Adolfo Lutz 1985).
Microbiological Analysis
2.3
To assess the viability of kefir as a probiotic beverage, it was necessary to evaluate the quantity of LAB in the beverage. Using the microdrop technique, 20 µL of serial dilutions of kefir were inoculated on the surface of each plate containing Man, Rogosa, and Sharpe agar medium (MRS). The plates were then incubated at 37°C for 48 h in an incubator for CFU counting. Yeast counting was also performed using the surface plating method with serial dilutions. On the surface of each plate containing potato dextrose agar (PDA) acidified with a 10% tartaric acid solution, 100 µL of decimal dilutions of kefir were inoculated. The plates were then incubated at 25°C in an incubator for 5 days. Using the formula: (final mean CFU count × dilution factor)/volume used for plating, the quantity of CFU/mL of kefir was determined (Ministério Da Agricultura, Pecuária e Abastecimento 2003).
Experimental Design
2.4
Sixteen C57BL/6J IL‐10^−/−^ male mice at 8 weeks old, weighing approximately 24 g, were obtained from the Central Animal Facility at the Center for Biological and Health Sciences (CCB) at UFV, with approval from the Ethics Committee for Animal Use (CEUA/UFV) under protocol number 52/2019. The sample size was calculated according to Mera et al. (1998), and no animals were excluded. A confidence level of 99% was used (α < 0.01), obtaining a value from the distribution table t (two‐tailed) = *t_ɑ_ */2 = 2,5 with a statistical power of 95% and 20% of losses.
The animals were housed in 4 collective cages, 2 for each group, under a 12‐h light/dark cycle, at 23 ± 2°C and provided with water and commercial feed ad libitum throughout the experiment. The animals were randomized based on weight into two experimental groups: control group (KOM, n = 8) and the kefir group (KOK, n = 8). After a week of acclimatization, the control group (KOM) received 0.4 mL of whole cow's milk (UHT) and the kefir group (KOK) received 0.4 mL of fermented kefir beverage (2.4 × 10^8^ CFU) both by orogastric gavage, daily, for 4 weeks (Du et al. 2022) (Figure 2). The animals were individually weighed weekly on a digital scale. At the same time, excreted feces were collected and promptly placed in the ultrafreezer at −80°C.
Experimental design. CFU, colony‐forming units; KOK, kefir group; KOM, control group.
At the end of the experimental period, the animals were weighed, anesthetized with 3% isoflurane (Isoflorine, Cristalia), and euthanized by exsanguination. The small intestine was removed, flushed with physiological saline solution, weighed, and stored at −80°C until the analysis or fixed in Carson's formalin (Carson et al. 1973) for histological analysis. The content from the cecum was also removed and stored at −80°C until the analysis.
Histological Analyses in the Small Intestine
2.5
The tissue was embedded in the paraffin. Subsequently, 5 µm‐thick sections were obtained using a rotary microtome (Olympus America Inc., CUT 4055). These sections were then stained with hematoxylin and eosin (H&E). Images of the histological sections were captured with a 10x objective directly on the LEICA DM750 light microscope (Leica, Switzerland) using a LEICA 170HD video camera (Leica, Switzerland). Analyses and measurements were performed using the Image Pro‐Plus version 4.5 software (Media Cybernetics).
The histopathological score in small intestine was composed of the average of three different parameters: crypt damage (0: none; 1: 1/3 damaged; 2: 2/3 damaged; 3: only the superficial epithelium intact; 4: epithelium lost); inflammation severity (0: none; 1: mild; 2: moderate; 3: severe); and lesion depth (0: none; 1: mucosa; 2: submucosa; 3: transmural). A score was assigned for each parameter, and the overall score was obtained by summing the points for each parameter (Cruz et al. 2020).
Histomorphometry measurements were conducted using Image Pro‐Plus version 4.5 (Media Cybernetics), following the methodology proposed by D. D. Rosa et al. (2012). Goblet cells were manually counted in 70 villi for each experimental group.
Quantification of SCFAs in the Small Intestine and in Cecum Content
2.6
SCFAs were extracted following the methodology proposed by Siegfried et al. (1984), and the concentration was quantified by HPLC on an UltiMate 3000 chromatograph (Dionex, Germany). Twenty microliters of the sample homogenate were injected and passed through a Rezex ion‐exchange column (00H‐0138‐K0 300 × 7.8 mm, Phenomenex) with 5 mM sulfuric acid as the eluent at 0.7 mL/min, at 40°C. The detector used was a refractive index detector at 40°C (RI‐101, Shodex). The concentration of fatty acids was determined based on the standard curve of acetic, propionic, and butyric acids, and the result expressed in µmol of fatty acid/g of tissue or µmol of fatty acid/g of cecum content.
Analysis of Intestinal Microbiota Composition
2.7
For sequencing, fecal samples from the first and last week of the intervention were used. Fecal DNA extraction was performed as described by Zhang et al. (2006), using 30 ± 2 mg of feces. Collected feces from the animals were distributed into three pools per group. The concentration and integrity of bacterial DNA were assessed using NanoDrop, with the calculation of the 260/230 and 260/280 ratios, absence of degradation smear in 0.8% agarose gel electrophoresis, and positive PCR amplification using 337F and 518R 16S rRNA primers for the V3 hypervariable region to detect 16S rRNA (Park et al. 2021). The samples were then sent to the company Neoprospecta (Florianópolis, Santa Catarina, Brazil) for sequencing on Illumina HiSeq 2500 platform (Caporaso et al. 2012).
The sequence quality was assessed using the FastQC package to remove low‐quality sequences, those with a Phred quality score less than 30, using the Trimmomatic v0.36 program. High‐quality reads were then processed using the DADA2 package version 1.8 implemented in R platform version 3.6.1. Chimeric sequences were identified and removed. The representative OTU sequences were taxonomically classified (phylum, family, and genus) using the Silva 16S rRNA database release 138 (Quast et al. 2013).
Statistical Analyses
2.8
The normality of variables was determined using the Shapiro–Wilk test. For comparison between experimental groups with parametric distribution, Student's t‐test was employed. Nonparametric tests were used for values that did not exhibit normal distribution. Abundance profiles of the top 50 bacterial taxa were calculated at taxonomic levels from phylum to species, presented as percentage abundance, and compared using either a paired Student's t‐test or Wilcoxon test for dependent samples and Student's t‐test or Mann–Whitney test for independent samples.
Results were expressed as mean ± standard deviation. Statistical analyses were conducted using the Statistical Package for the Social Sciences (SPSS) version 28.0 for Windows Evaluation Version, assuming a p < 0.05. Microbiota analyses were assessed using GraphPad Prism 8 software.
Results and Discussion
3
The proximate composition was determined only for the kefir beverage to characterize the fermented product administered to the animals. The UHT milk used as control is a commercially regulated product, subject to standardized quality control and nutritional labeling requirements. As the main objective of this study was to evaluate the biological effects of kefir consumption, the manufacturer's information was considered sufficient. A moisture content was observed as 89%. In terms of macronutrients, 4.50 g of carbohydrates, 3.20 g of protein, and 2.60 g of lipids were found in 100 g of fermented kefir beverage. The ash content was 0.70/100 g, and the total caloric value provided by the beverage was 53.80 kcal per 100 g. Additionally, the pH of the beverage was 4.03. Moreover, the composition of the milk used, according to the manufacturer, was 4.5% carbohydrates, 3% protein, and 3% lipids, providing a total of 57 kcal per 100 g. After plating in serial dilutions, a count of 10^8^ CFU/g of total LAB and 10^6^ CFU/g of total yeast was obtained.
Body weight differed between groups only at specific time points. A significant difference was observed in Week 2, when the KOM group showed higher body weight compared to the KOK group (Table 1). In Week 10, the KOM group exhibited weight gain, whereas the KOK group showed weight loss (p = 0.0002). No significant differences were detected between groups in subsequent weeks. At the end of the experiment, all animals in both groups lost body weight, suggesting the development of spontaneous IBD.
In the assessment of histopathological scores for the small intestine (Figure 3A) and the severity of inflammation parameter (Figure 3B), the group fed with kefir demonstrated a reduction in both parameters. Additionally, it was observed that kefir treatment preserved the physiological tissue appearance (Figure 3E,F), maintaining homogeneous villi and reducing focal inflammatory infiltrates. In contrast, the control group exhibited tissue damage and large foci of inflammatory infiltrates between the intestinal epithelium and lamina propria (Figure 3G,H). There was no difference in crypt damage and depth injury (Figure 3C,D). An increase in villus surface area, height and width of villi, and crypt depth was observed (Figure 4A,C–E) in the group KOK. The control group demonstrated a reduction in the number of goblet cells per villus compared to the kefir group (Figure 4B).
Histopathological score of the use of kefir on the small intestine of IL10−/− mice (eosin–hematoxylin stain). (A) Total histopathological score; (B) severity of inflammation; (C) damage to crypts and villi; (D) depth of lesion. Values expressed as mean ± standard deviation. * Indicates p < 0.05 demonstrating statistical difference by Mann–Whitney or unpaired t‐test. Photomicrograph of the small intestine of C57BL/6J IL10−/− mice stained with HE. (E) Preserved villi and crypts; (F) evident and enlarged goblet cells; (G) damaged villi and reduction of goblet cells; (H) presence of inflammatory infiltrate. Yellow arrow: goblet cells. Red arrow: flattening and damage to the villi. Red circle: inflammatory infiltrate. Objective 10×. KOK, kefir group; KOM, control group.
Evaluation of the use of kefir on the histomorphometric variables of the small intestine of IL10−/− mice (eosin–hematoxylin stain). Evaluation of kefir use on histomorphometric variables of the small intestine of IL10−/− mice. (A) Villus surface area; (B) goblet cell count; (C) villus height; (D) villus width; (E) crypt depth. Values expressed as mean ± standard deviation. * Indicates statistical difference p < 0.05 by Mann–Whitney. KOK, kefir group; KOM, control group.
Kefir treatment increased the concentration of SCFAs in the small intestine, with an increase in acetic and butyric acid concentrations compared to the control group (Figure 5A). The functionality of intestinal bacteria was assessed through the concentration of SCFAs (acetate, butyrate, and propionate) in cecal content and no differences were found in acetate, propionate, and butyrate concentrations between the experimental groups (p = 0.11, 0.39, 0.39) (Figure 5B).
Short‐chain fatty acid (SCFA) concentrations in the small intestine (A) and cecum feces (B) of IL10−/− mice after kefir consumption. Values expressed as mean ± standard deviation. * Indicates statistical difference p < 0.05 by Mann–Whitney. KOK, kefir group; KOM, control group.
The results of the metataxonomic analysis were assessed intragroup (A), meaning a comparison between the first and last week of intervention, and intergroup (B), where the results of the last week of the experiment were compared between experimental groups. The phyla Bacteroidetes, Firmicutes, and Proteobacteria were present in both groups at the beginning and at the end of the experimental period (Figure 6A). The kefir intervention led to a reduction in the Desulfovibrionaceae family compared to the control group, and the Lactobacillaceae family was identified only in the KOK group during the first week of intervention and persisted until the end of the experimental period (Figure 6B). Regarding the genera, an increase in Lactobacillus was observed after kefir intervention (Figure 6C). Desulfovibrio, the only genus of the Desulfovibrionaceae family identified, was more abundant in the KOM group compared to the KOK group (Figure 6C).
Taxonomic analyses of fecal microbiota of IL10−/− mice at the phylum, family, and genus levels. Taxonomic analyses of fecal microbiota at the phylum, family, and genus levels. (A) phylum relative abundance; (B) family relative abundance; (C) genus relative abundance; KOK A: kefir group in first week of intervention; KOK B: kefir group in fourth week of intervention; KOM A: control group in first week of intervention; KOM B: control group in fourth week of intervention.
Alterations in the composition and functionality of the microbiota are associated with IBD, and the use of probiotics has been studied as a potential treatment. Kefir is a fermented beverage that contains probiotic microbial species which add beneficial properties to the beverage. Here, we aimed to evaluate the effects of milk kefir beverage consumption on parameters related to IBD in IL‐10^−/−^ mice. Our results demonstrated that, in the small intestine of IL‐10^−/−^ mice, kefir improved histomorphometric characteristics, maintaining normal tissue physiological appearance with homogeneous villi and increased concentrations of acetate and butyrate. An increase in Lactobacillaceae family and Lactobacillus genus was observed, whereas the Desulfovibrionaceae family and Desulfovibrio genus decreased, also suggesting attenuation of the inflammatory process.
In our study, we used whole milk kefir due to its better‐established scientific knowledge. The proximate composition of kefir demonstrated an expected moisture content for a beverage (89%). A similar value, 90% moisture, was found in another study from our group (D. D. Rosa et al. 2017) and 87.5% in a review conducted by Otles and Çağındı (2003). Regarding the protein composition, the value found in our beverage (3.20/100 g) is higher than the minimum requirement specified in the legislation for fermented milks in Brazil, which considers a minimum protein content of 2.90/100 g of product (Ministério Da Agricultura, Pecuária e Abastecimento 2007). Similar values, ranging from 3.16 to 3.18 g of protein, were reported (E. R. Farnworth 2008). Considering the use of whole milk as the substrate for kefir, the lipid found is below the recommended range for fermented milks, which is between 3.0 and 5.0 g of lipid per 100 g of product (Ministério Da Agricultura, Pecuária e Abastecimento 2007). According to the same regulation, the fermentation product would be classified as partially skimmed, with a fat content between 0.6% and 2.9%. The reduction in lipid content may result from the action of some yeast species with lipolytic activity present in kefir (Vujičić et al. 1992; Lopitz‐Otsoa et al. 2006). The average pH found was 4.03, a value that classifies it as acidic (below 7.0). This characteristic is achieved through the fermentation process of milk, which induces the production of lactic acid and contributes to the preservation of the obtained product (Leite et al. 2013).
The proximal composition of kefir undergoes variation based on the type of milk, the fermentation process, climatic conditions, and grain management (Sarkar 2008). Its microbiological composition can vary depending on the origin of the grains, the type of substrate used for its development, and its cultivation method (Prado et al. 2015). Here, our microbiological evaluation of kefir demonstrated a count of 10^8^ CFU/g of total LAB and 10^6^ CFU/g of total yeast was obtained. This result suggests that the analyzed kefir possesses possible probiotic properties, as it aligns with the characteristics established by the legislation in Brazil (Ministry of Agriculture, Livestock and Food Supply) in Ministério Da Agricultura, Pecuária e Abastecimento (2007).
In the present study, the body weight loss in the KOK group may be related to inflammation generated. This weight loss is expected due to the degree of inflammation they may reach. In the study conducted by Chen et al. (2017), probiotic treatment was able to improve body weight loss in IL‐10^−/−^ animals compared to the untreated control group. Besides that, in IBD, histological changes in the small intestine, such as partial villous atrophy, crypt/villus ratio alterations, and infiltration of inflammatory cells, can be observed (Mourad et al. 2017). According to our results, kefir had a positive effect on maintaining the tissue characteristics of the small intestine, demonstrating a positive effect. The structure of the villi can increase the surface area, and increasing the height of the villi leads to greater efficiency in the process of digestion and absorption of nutrients. The surface area of the villi and the depth of the crypts are indicators of intestinal development and functional status (Hou and Tako 2018; Núñez‐Gómez et al. 2023; Mishima et al. 2023).
Goblet cells secrete mucus; the mucus layer functions as a crucial barrier and that is responsible for covering the intestinal epithelium and providing the first line of defense against injuries caused by ingested food, microbes, or microbial products. However, the process of infection or chronic inflammation can lead to depletion of goblet cells and changes in the mucosal layers (Liévin‐Le Moal and Servin 2006; Dharmani et al. 2009; Kim and Ho 2010; Pelaseyed et al. 2014). The disruption of this barrier may constitute one of the possible causes of IBD (van der Post et al. 2019; Naama et al. 2023).
The production of SCFA benefits the host as regulatory molecules with various physiological effects, including energy homeostasis, lipid and carbohydrate metabolism, and suppression of inflammatory signals (Hee and Wells 2021; Fu et al. 2023). Furthermore, butyrate may protect against colitis by regulating the production of Treg cells and enhancing the antibacterial activity of macrophages (Haneishi et al. 2023). Therefore, a higher concentration of butyrate could attenuate inflammation in the small intestine. Besides that, it improves the integrity of intestinal epithelial cells, promoting tight junctions and cell proliferation, inhibits the secretion of pro‐inflammatory cytokines while increasing the secretion of anti‐inflammatory cytokines and increases mucin production by goblet cells (Siddiqui and Cresci 2021), which is in accordance with our results. Here, we found higher number of goblet cells and higher concentration of butyrate in small intestine, but we did not find differences in SCFA concentrations in cecal content.
Dysbiosis can be assessed through the variations in Firmicutes to Bacteroidetes ratio (F:B ratio), which is used as a predisposing factor for diseases (Jandhyala et al. 2015). In the present study, the control group demonstrated a decrease in the F:B ratio after 4 weeks of intervention, whereas the kefir intervention, after 4 weeks, increased the F:B ratio, suggesting an imbalance in the microbiota of the control group. Usually, a decreased F:B ratio and a decrease in the abundance of Firmicutes are observed during the active phase of the disease in individuals with IBD (Stojanov et al. 2020; Xue et al. 2022). According to Qu et al. (2021), animals induced with dextran sulfate sodium (DSS) for IBD exhibited a reduction in the abundance of both Firmicutes and Bacteroidetes. Restoring the F: B ratio with proper probiotics can help or support the immune system (Stojanov et al. 2020).
Among the predominant probiotic strains in kefir are bacteria such as Lactobacillus, Lacticaseibacillus, and Lactiplantibacillus, and the yeasts Saccharomyces, Candida kefyr, and Kluyveromyces. Thus, the presence of probiotic species makes the beverage a potential probiotic food matrix (de Souza et al. 2024). In our study, the kefir intervention reduced the Desulfovibrionaceae family, which produces hydrogen sulfide that can compromise the intestinal mucosal barrier and induce IBD (Zhai et al. 2019) and it is more prevalent in individuals with IBD compared to healthy (Nagao‐Kitamoto and Kamada 2017). The Lactobacillaceae family was identified only in the KOK group during the first week of intervention and persisted until the end of the experimental period, and the Lactobacillus genera were increased after kefir intervention. Several species of Lactobacillus have been found in kefir samples (D. D. Rosa et al. 2017) and it is one of the most found microorganisms in it (Slattery et al. 2019). Several species of Lactobacillus are used for IBD treatment, including L. reuteri, L. plantarum, L. fermentum, and L. casei. Except for L. fermentum, all Lactobacillus species have been found or are related to kefir consumption in various outcomes, such as weight loss, reduction of pro‐inflammatory cytokines, changes in cholesterol profile, and reduction of oxidative stress (Peluzio et al. 2021).
Desulfovibrio was more abundant in the KOM group compared to the KOK group. This genus has been found in biopsies of patients with UC and it is associated with leaky gut, a compromise in the integrity of the intestinal barrier (Singh et al. 2022). The increase in Desulfovibrio, the most prevalent sulfate‐reducing bacteria, is linked to IBD and pouchitis, an inflammation that occurs in the lining of a pouch created during surgery to treat UC or other diseases (Singh et al. 2022). Sulfate‐reducing anaerobic bacteria utilize organic compounds as a source of energy and carbon through a process known as dissimilatory sulfate reduction. This process produces toxic hydrogen sulfide (H_2_S), which, at high concentrations, can induce inflammation of the intestinal epithelium and consequently contribute to the development of colitis (Kushkevych et al. 2020). Desulfovibrio bacteria genus utilizes sulfate as a terminal electron acceptor and organic compounds in its metabolism. Therefore, kefir treatment could attenuate the inflammatory process by reducing the abundance of this genus.
Although we identified changes in the composition of the microbiota, we did not observe any alterations in the functionality of SCFA production (concentration of SCFA in the cecal content). This suggests the possibility that altered bacteria may not be responsible for the synthesis of these acids. We can hypothesize that the kefir administered to IL‐10 knockout mice may have influenced species not specialized in SCFA production, or that the duration of intervention and the quantity employed were not sufficient to effectively modulate this specific function.
Conclusion
4
In conclusion, the present study demonstrates that the consumption of a whole milk kefir beverage exerted beneficial effects on intestinal health and inflammatory parameters in IL‐10^−/−^ mice, a well‐established model of IBD. The kefir showed an adequate nutritional and microbiological profile in addition to relevant biological effects associated with gut integrity, such as preservation of physiological architecture of the small intestine, improving histomorphometric parameters, while reducing inflammatory infiltrates.
The modulation of the intestinal microbiota further supports the protective effects of kefir. The increase in Lactobacillaceae and Lactobacillus, alongside the reduction of Desulfovibrionaceae and Desulfovibrio, indicates a shift toward a more favorable microbial profile. This microbial modulation is especially relevant in the context of IBD, as sulfate‐reducing bacteria are associated with hydrogen sulfide production, mucosal barrier disruption, and disease exacerbation. Thus, kefir intake may contribute to attenuating intestinal inflammation by selectively favoring beneficial microbial taxa while reducing potentially harmful ones.
Despite these positive outcomes, some limitations should be acknowledged. The duration of the intervention may not have been sufficient to induce detectable changes in cecal SCFA concentrations, suggesting that longer exposure or different dosing strategies could be necessary to fully assess functional microbial outputs. Moreover, although metataxonomic analysis revealed shifts in microbial composition, functional metagenomic or metabolomic approaches were not employed to directly link microbial changes with metabolic pathways. The use of a specific type of whole milk kefir also limits the generalizability of the findings.
Future studies should explore longer intervention periods, different kefir formulations, and dose–response relationships to better understand the functional impact of kefir on gut microbiota metabolism. Integrating multi‐omics approaches and evaluating additional inflammatory and immune markers may further clarify the mechanisms of the use of this probiotic with such potential protective effects. Ultimately, these findings contribute to the growing body of evidence supporting kefir as a promising functional food approach in the dietary management of intestinal inflammatory disorders.
Author Contributions
Iasmim Xisto Campos: conceptualization, investigation, writing – original draft, methodology, validation, visualization, writing – review and editing, formal analysis, data curation, supervision. Vinicius Fernandes Paris: conceptualization, investigation, writing – original draft, methodology, validation, writing – review and editing, visualization, formal analysis, data curation. Mariana de Fátima Albuquerque Pereira: conceptualization, investigation, writing – original draft, methodology, validation, visualization, writing – review and editing, formal analysis, data curation. Gabriela de Cássia Ávila Alpino: conceptualization, investigation, writing – original draft, methodology, validation, visualization, writing – review and editing, formal analysis, data curation. Andressa Ladeira Bernardes: conceptualization, investigation, writing – original draft, methodology, validation, visualization, writing – review and editing, formal analysis, data curation. Larissa Gabriela Morais de Ávila: conceptualization, investigation, writing – original draft, methodology, validation, visualization, writing – review and editing, formal analysis, data curation. Marcella Duarte Villas Mishima: conceptualization, investigation, writing – original draft, methodology, validation, visualization, writing – review and editing, formal analysis, data curation. Manoela Maciel dos Santos Dias: conceptualization, writing – original draft, investigation, methodology, validation, visualization, writing – review and editing, formal analysis, data curation. Soraya Torres Gaze Jangola: conceptualization, investigation, writing – original draft, methodology, validation, visualization, writing – review and editing, supervision, resources, data curation, formal analysis. Tiago Antonio de Oliveira Mendes: conceptualization, investigation, writing – original draft, methodology, validation, visualization, writing – review and editing, formal analysis, supervision, resources, data curation. Maria do Carmo Gouveia Peluzio: conceptualization, investigation, writing – original draft, methodology, validation, visualization, writing – review and editing, formal analysis, project administration, data curation, supervision, resources.
Conflicts of Interest
The authors declare no conflicts of interest.
The reference list from the paper itself. Each links out to its DOI / PubMed record.
- 1Ananthakrishnan, A. N. 2015. “Epidemiology and Risk Factors for IBD.” Nature Reviews Gastroenterology & Hepatology 12, no. 4: 205–217. https://www.nature.com/articles/nrgastro.2015.34. 10.1038/nrgastro.2015.34.25732745 · doi ↗ · pubmed ↗
- 2Association of Official Analytical Chemistry . 2005. Official Methods of Analysis. Association of Official Analytical Chemistry.
- 3Azizi, N. , M. , Kumar , S. , Yeap , et al. 2021. “Kefir and Its Biological Activities.” Foods 10, no. 6: 1210. https://www.mdpi.com/2304‐8158/10/6/1210.34071977 10.3390/foods 10061210 PMC 8226494 · doi ↗ · pubmed ↗
- 4Ministério Da Agricultura, Pecuária e Abastecimento . 2023. Instrução Normativa No 62, de 26 de Agosto de 2003. Oficializa Os Métodos Analíticos Oficiais Para Análises Microbiológicas Para Controle de Produtos de Origem Animal e Água. Ministério Da Agricultura, Pecuária e Abastecimento.
- 5Ministério Da Agricultura, Pecuária e Abastecimento . 2007. Resolução N° 46. Padrões de Identidade e Qualidade (PIQ) de Leites Fermentados. Ministério Da Agricultura, Pecuária e Abastecimento.
- 6Caporaso, J. , C. Lauber , W. A. Walters , et al. 2012. “Ultra‐High‐Throughput Microbial Community Analysis on the Illumina Hi Seq and Mi Seq Platforms.” ISME Journal 6, no. 8: 1621–1624. https://academic.oup.com/ismej/article‐abstract/6/8/1621/7587776.22402401 10.1038/ismej.2012.8PMC 3400413 · doi ↗ · pubmed ↗
- 7Carson, F. , J. Martin , and J. A. Lynn . 1973. “Formalin Fixation for Electron Microscopy: A Re‐Evaluation.” American Journal of Clinical Pathology 59, no. 3: 365–373. https://academic.oup.com/ajcp/article‐abstract/59/3/365/1770672.4119901 10.1093/ajcp/59.3.365 · doi ↗ · pubmed ↗
- 8Chen, H. , Y. Xia , S. Zhu , et al. 2017. “ Lactobacillus plantarum LP‐Onlly Alters the Gut Flora and Attenuates Colitis by Inducing Microbiome Alteration in Interleukin‐10 Knockout Mice.” Molecular Medicine Reports 16, no. 5: 5979–5985. 10.3892/MMR.2017.7351.28849048 PMC 5865777 · doi ↗ · pubmed ↗