Improving the Annotation for Spatial Proteomics: A Computational Approach to Enhance Molecular Characterization of Thyroid Nodules
Vasco Coelho, Nicole Monza, Natalia S. Porto, Giulia Capitoli, Vincenzo L’Imperio, Daniele M. Papetti, Vanna Denti

TL;DR
This paper introduces a computational workflow that improves MALDI-MSI analysis of thyroid tissue by using digital pathology to select cell-rich regions, enhancing diagnostic accuracy and biomarker discovery.
Contribution
A novel automated workflow integrating digital pathology with spatial proteomics to enhance MALDI-MSI analysis of thyroid lesions.
Findings
The pixel classifier reduced interfering signals by 15% and increased the signal-to-noise ratio of tryptic peptides by 37%.
The approach detected 9-24% more m/z signals and improved spectral clustering for distinguishing histopathological regions.
ROC analysis showed a 50% increase in discriminatory m/z features across thyroid nodule diagnoses compared to conventional methods.
Abstract
The present work proposes a reproducible and automated workflow for integrating digital pathology in matrix-assisted laser-desorption ionization mass spectrometry imaging (MALDI-MSI) data analysis, using thyroid tissue as a proof-of-concept application. MALDI-MSI has shown promise in the molecular characterization of thyroid neoplasms. Yet challenges remain in minimizing signal interferents and improving diagnostic discrimination. In this study, we propose an interdisciplinary approach integrating digital pathology with spatial proteomics to enhance MALDI-MSI analysis of thyroid lesions from formalin-fixed paraffin-embedded tissue sections. We trained a pixel classifier to automatically select cell-rich regions of interest (ROIs) from hematoxylin and eosin-stained tissue microarrays, reducing interference from colloid-rich areas. The proteomics signals obtained with the pixel classifier…
Genes, proteins, chemicals, diseases, species, mutations and cell lines named across the full text — each resolved to its canonical identifier and authoritative record.
Click any figure to enlarge with its caption.
 1
1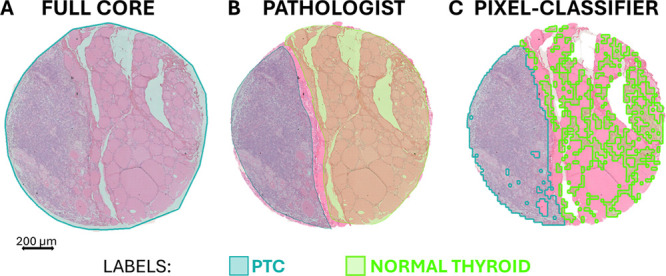 2
2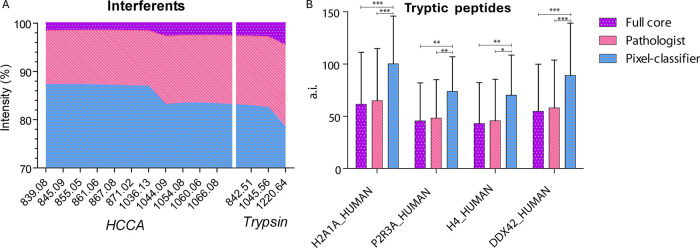 3
3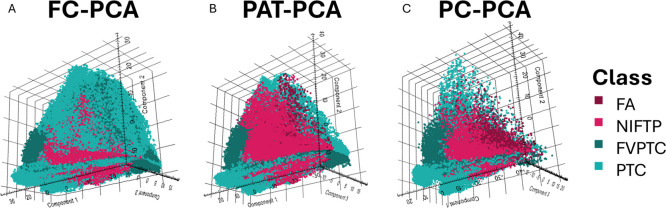 4
4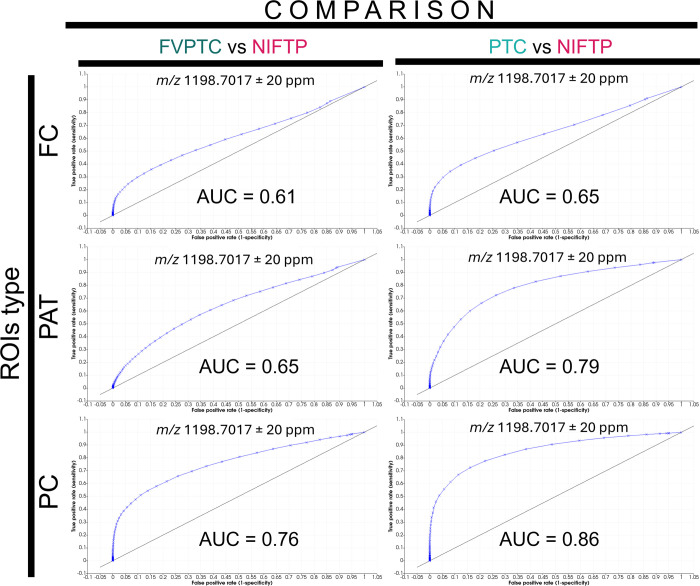 5
5- —Regione Lombardia10.13039/501100009882
- —Ministero dell'Universit? e della Ricerca10.13039/501100021856
- —Ricerca FinalizzataNA
- —National Plan for NRRP Complementary InvestmentsNA
Peer Reviews
No public reviews on file for this paper yet. If you reviewed it on a platform where reviews are public (OpenReview, ICLR, NeurIPS, ICML), you can paste yours below so the community can read it here.
Videos
No videos yet. Explain this paper in a talk, walkthrough, or lecture? Add one.
Taxonomy
TopicsMass Spectrometry Techniques and Applications · Advanced Proteomics Techniques and Applications · Metabolomics and Mass Spectrometry Studies
Introduction
Among the spatial-omics techniques, matrix-assisted laser desorption/ionization-mass spectrometry imaging (MALDI-MSI) has already shown promising results in the characterization and classification of different tissue lesions.? The high sensitivity of this technique allows for the measurement of relative intensity and spatial distribution of hundreds of analytes from a single tissue section. ?,? Additionally, MALDI-MSI permits the spatial measurement of different analyte classes (i.e., small molecules, lipids, peptides, and N-Glycans) both in fresh-frozen and archival tissue sections. ?−? ? ? When considering MALDI-MSI in clinical investigations, our team has extensively applied this technique for the investigation of molecular changes in thyroid neoplasms. ?−? ? For instance, MALDI-MSI proteomics analysis showed the capability to distinguish putative biomarkers that distinguish RAS-mutated tumors from wild-type tumors.? In particular, the differential diagnosis of follicular-patterned thyroid lesions can be complicated due to the well-known tissue heterogeneity that comprises entities with different clinical courses and prognosis. ?,? Although computational pathology assists in the morphological evaluation of thyroid lesions, ?,? spatial proteomics approaches might improve the correct diagnosis by encoding molecular information. The possibility to perform the proteomics analysis after in situ digestion of formalin-fixed paraffin-embedded (FFPE) tissue allows the analysis of several patients at the same time using tissue microarrays (TMA). ?,? In this work, as a proof-of-concept, we considered four different thyroid lesions: papillary thyroid cancer (PTC), follicular-variant of PTC (FVPTC), noninvasive follicular thyroid neoplasm with papillary-like nuclear features (NIFTP), and follicular adenoma (FA). The latter represents a benign condition, whereas PTC, FVPTC, and NIFTP are malignant lesions, with the last having indolent behavior with an extremely low risk of recurrence and distant spread.? However, previous studies have shown that colloid-rich regions – a gel-like substance within thyroid follicles primarily composed of thyroglobulin – in thyroid tissue can interfere with paraffin removal and consequent in situ tissue digestion, leading to signal suppression of cellular molecules and to contamination of MALDI-matrix adducts.? In our case study, we observed a strong interference from α-Cyano-4-hydroxycinnamic acid (HCCA), in particular the [M4–3H+3Na+K]+ adduct (861.07 m/z),? as shown in Figure S1. The direct consequence is impaired molecular characterization of thyroid nodules. A possible solution requires the manual definition of regions of interest (ROIs) that exclude colloid regions. However, this detailed work is time-consuming, suffers from interoperator variability, and is not reproducible. Therefore, automating fine-grained detection of cell-rich regions, avoiding colloid, would greatly improve the entire workflow, thus facilitating the extraction of specific proteomic signatures for each thyroid neoplasm. To do so, we trained a QuPath pixel classifier (PC) ?,? to pinpoint specific ROIs in hematoxylin and eosin (H&E)-stained thyroid tissue sections after MSI data acquisition, enabling a virtual microdissection of those areas. ?,? To confirm the enhanced proteomic data specificity of the PC-derived ROIs, we compared them with those resulting from ROIs manually annotated by an experienced pathologist, as described in the H&E-derived histopathologic ROIs subsection.
In the vision of translating MALDI-MSI to clinical routine, we used ROI annotations defined by the pathologist and not specifically designed for MSI applications. These annotations were used in our automatic pipeline in QuPath to assign labels to the PC cell-rich regions.
Moreover, our findings proved the enhanced discriminatory capability of PC-derived proteomic signatures in differentiating among distinct thyroid nodule diagnoses.
In the Data section, we present the bimodal spatially resolved microscopic biomedical data processed in this work: MALDI-MSI and H&E-stained whole-slide image (WSI). The proposed enhanced molecular characterization workflow is detailed in the Methods section and includes data normalization, coregistration, and accurate MALDI-MSI region selection. Moreover, in the Results and Discussion section, we applied peak-picking separately to the PC-derived ROIs, pathologist-guided ROIs, and full-core ROIs, and we compared the resulting peak lists based on their discriminatory capability to distinguish the labeled regions annotated by an experienced pathologist. Finally, in the Conclusions section, we discuss the advantages and flexibility of the proposed workflow for enhancing spatial omics MSI analysis and future developments for morphomolecular biomarker discovery.
Data
The study cohort under investigation included 44 patients who underwent thyroid surgery for different thyroid lesions at the IRCCS Fondazione San Gerardo in Monza, Italy. The study was conducted in accordance with the Declaration of Helsinki and approved by the local ethical committee (Comitato Etico Brianza, via Pergolesi, 33, 20900 Monza (MB). Approval code: FINAL-TIR PU 3581/21. Approval date: January 14, 2021. All participants gave their informed consent. Two different areas of each lesion section were selected from each FFPE tissue block to build a TMA using the semiautomatic arrayer ISE Galileo TMA CK 4500 with the software ISE Galileo TMA R4.30 (Integrated Systems Engineering, Milan, Italy). The study was approved by the local ethical committee (FINAL-TIR PU 3581/21).
MALDI–MSI Data
A 5 μm-thick section obtained from the TMA was processed for the in situ analysis of tryptic peptides, as previously described.? The analysis was performed using a timsTOF fleX mass spectrometer (Bruker Daltonics, Bremen, Germany) equipped with a SmartbeamTM 3D laser, measuring in the m/z range of 700–3000. The spatial acquisition was performed using a raster width of 20 × 20 μm (x, y) and a lateral laser scan configuration of 16 μm. After the MALDI–MSI analysis, the matrix was washed with increasing concentrations of ethanol, and the slide was stained with hematoxylin and eosin (H&E). The H&E-stained slide was digitized as a WSI using a MIDI II digital scanner (3DHISTECH, Budapest, Hungary). The ROIs of each TMA core in the H&E image were manually annotated by an experienced pathologist (V.L.). The histopathologic ROIs labels comprised: PTC, FVPTC, NIFTP, FA, Hürthle cell adenoma, stroma, and normal thyroid tissue. Only samples labeled as PTC, FVPTC, NIFTP, and FA were considered in this study, leading to a total of 39 patients and 64 cores, with a maximum of 2 cores per patient.
Methods
MALDI–MSI Data Normalization and H&E coregistration
MALDI-MSI raw data files of each TMA core were imported into SCiLS Lab 2025a Pro software (Bruker, Bremen, Germany). Root mean square normalization was applied to the entire dataset, and patient IDs and diagnoses were assigned as attributes. The corresponding H&E-stained WSI (referred to as H&E in the rest of the manuscript for brevity) was imported and manually coregistered with the MSI data in SCiLS, a paramount step for a precise ROI selection. To improve the precision of structural alignment, coregistration was adjusted following the MSI distribution of the ion m/z 1459.688, putatively corresponding to the hydroxylated tryptic peptide (GSAGPPGATGFPGAAGR) of Collagen alpha-1(I) chain precursor,? a spatial reference for fine-structure alignment.
H&E-Based Automatic Cell-Rich ROIs Detection
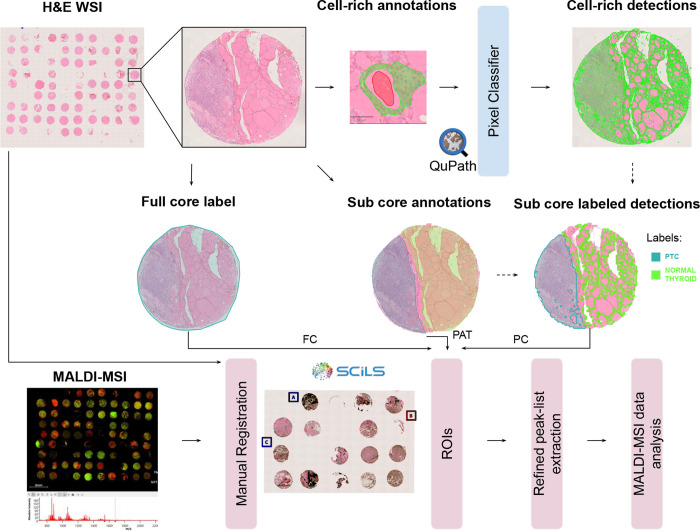
In Figure, we provide an overview of the workflow proposed in this work. To train the PC in QuPath, we manually annotated the H&E by highlighting small regions of different TMA cores, which correspond either to cell-rich regions or non-cell-rich regions. Additional annotations were iteratively added until the segmentation performance of PC was considered satisfactory by an experienced operator (V.D.). In particular, the final PC was trained with approximately 15 annotations per class across 3 TMA cores. Although in this case study we focused on cell-rich and noncell-rich regions, different regions should be annotated for different biological problems, and a novel PC should be trained. We provide the source code of the main steps of the QuPath pipeline in the GitHub repository at the following URL: https://github.com/Vsc0/msi-enhanced.
Overview of the proposed workflow to enhance the molecular characterization of thyroid nodules. Cell-rich vs non-cell-rich annotations are manually generated to train the QuPath pixel classifier. The pathologist's subcore annotations and the cell-rich detections are merged (dashed lines) to generate new subcore-labeled detections. In the SCiLS software, the H&E WSI is manually registered with the MALDI-MSI. The labeled ROIs derived from the full core (FC) contour, subcore pathologist-guided annotations (PAT), and subcore pixel classifier (PC) detections are imported, and the relative peak list is extracted for data analysis.
To do so in practice, after the creation of a QuPath project, we first executed the TMA dearrayer. The TMA dearrayer was executed by setting the horizontal and vertical labels for each core, while we used the default values for the remaining parameters. We manually adjusted the TMA grid produced by the TMA dearrayer to improve the alignment with the actual tissue contour of each core. Since not all the tissue regions in the H&E were targeted by the MSI acquisition, we considered valid only the TMA cores whose MSI spot locations were present in SCiLS; an example of H&E with valid cores is reported in Figure S2. For each valid core, we set the resolution parameter to 512 × 512 px, and we extracted patches at 0.44 μm/px from the H&E. The PC is a multilayer perceptronthat is, a small artificial neural networkavailable in QuPath. We selected Gaussian and weighted deviation multiscale features from the Red, Green, Blue, and Hematoxylin image channels. The multiscale features are extracted by applying both a Gaussian and a weighted deviation kernel with the standard deviation parameter set to 2 and 4.? The Gaussian filter extracts general-purpose features like color and pixel intensity, while the weighted deviation feature discriminates between textured and smooth areas. For additional information, we redirect the reader to the official QuPath PC documentation.? The resulting PC model architecture is composed of 32 parameters. In the GitHub repository, we provided a Groovy script to load and run the trained PC. We executed the PC within each TMA core, setting the minimum object size and the minimum hole size parameters to 7 μm^2^. In Figure S3, we show the PC predictions on a detail from the original TMA.
We assigned the label of the pathologist subcore annotations to the PC detections using QuPath; an example of pathologist subcore annotation is reported in Figure S4. To take into account the large resolution gap between the H&E and MSI m/z ion images, that is, from 0.2208 to 20 μm/px, we simplified the resulting polygons by slightly expanding and tiling the pixel classifier detections to approximate the 20 × 20 μm/px MSI spot resolution. This polygon simplification step, consisting of a reduction in the number of vertices of the predicted polygons, made the import of the detection in the SCiLS software more efficient. We provided a Groovy script to perform this step in the GitHub repository. In Figure S5, we show the final annotations exported from the QuPath software and imported into the SCiLS software for the MSI data analysis. Notwithstanding the previous example, the provided Groovy scripts (available at https://github.com/Vsc0/msi-enhanced) allow users to transfer pathologist region labels to the PC detections and consequently to tile these regions to approximate the MALDI-MSI lateral resolution. This modular approach is adaptable: researchers can retrain PCs to distinguish additional classes (e.g., tumor vs stroma) following the official QuPath pixel classifier documentation, thereby tailoring the workflow to their specific biological or clinical questions.
H&E-Derived Histopathologic ROIs
To perform the comparison of the peak lists (list of m/z feature intervals) derived from cell-rich regions against those delineated from the full core contours and subcore pathologist annotations, three different types of ROIs were generated in the SCiLS software and then partitioned by diagnosis label. For the first type, each ROI corresponds to the area analyzed with MALDI-MSI in each full TMA core; therefore, the ROI type was named “Full core” (FC), as shown in FigureA. The other two types were exported from QuPath as SCiLS Exchange Format (*.sef) and imported into the SCiLS dataset. In particular, the ROIs named “PAT” correspond to the subcore manual annotations defined by the pathologist, as shown in FigureB. The PC, cell-rich ROIs were generated using QuPath, as described in the previous section. Contextually, a mean spectrum per ROI type was generated and used to detect the corresponding peak list. Peak-picking was performed in mMass (v5.5.0),? setting the signal-to-noise ratio (S/N) to 6 and the relative intensity threshold to 0.3%. The peak list allows the retrieval of the absolute signal intensity of the m/z features it contains in each MSI spot within the ROI. We compared the three types of ROI, using the corresponding peak lists, by performing principal component analysis (PCA) and finally receiver operator characteristic (ROC) analyses.
Exemplary figure of the three types of ROIs used. MALDI-MSI regions overlaid on the H&E-stained image of the same TMA core across all panels: (A) full core (FC), corresponding to the original MSI measurement area; (B) subcore annotations, manually drawn by the pathologist (PAT); (C) ROIs generated in QuPath using the PC. A color legend is provided, indicating the label assigned by the pathologist for this core: PTC, teal; normal thyroid, light green.
The PC ROIs findings were compared with those obtained from other ROI types (FC and PAT). PCA analysis was performed in SCiLS, using unit variance for scaling, considering all the individual spectra and setting a maximum of 5 components. ROC analysis was performed by selecting the all-spectra option. An m/z feature was considered discriminatory for the ROC analysis if the output, that is, the area under the curve (AUC), was greater than 0.7 or less than 0.3.
Results and Discussion
This study was designed as a proof of concept to demonstrate an automated and reproducible workflow for refining pathologist-defined ROIs. The proposed straightforward interdisciplinary approach was used to simplify and improve spatial proteomics data analysis of thyroid nodules acquired by MALDI-MSI.
A dedicated QuPath-trained PC was used to specifically select cell-rich ROIs based on the tissue morphology from the H&E staining of the TMA.
Overall Comparison of the Different ROIs Type
Compared to the FC, both PAT and PC regions had the advantage of including pathology-specific regions (PTC, FVPTC, NIFTP, and FA), excluding stroma and normal thyroid spectra, as shown in Figure, where normal thyroid regions are included in the same region as FC. The greater specificity of PC-derived ROIs can be easily explained by the specific selection of regions containing a high density of cellular nuclei. In this way, cellular protein content was increased, leading to a more precise characterization of the different pathologies included in this study. This particular aspect allows further concentration of pathology-distinct proteomic signatures. However, the manually selected regions (PAT) do not comprise dense cellular regions, resulting in an overall signal with additional interfering peaks and, in some cases, signals coming from connective tissue (of the stroma) surrounding or included in the tumor regions. Moreover, PAT ROIs strongly suffer from inter-observer variability: different pathologists might annotate different regions, leading to less reproducibility and less precision in the selection of cellular-specific regions. Nonetheless, these annotations can be used to label the regions selected by the PC. In fact, a key step to reach the histopathological specificity observed in PC ROIs is the labeling inherited by the PAT ROIs. An example is reported in Figure, where the two labels “PTC” and “normal thyroid” are present in both PAT and PC ROIs. Here, the important difference lies in the cell-specific selection achieved by PC. Indeed, we can appreciate a colloid-rich region in the PAT ROI labeled as normal thyroid (in green), while the PC ROI specifically follows the cell borders of thyroid follicles, excluding the colloid. Another advantage to note is the automatic selection of these regions, leading to more reproducible results across different specimens analyzed. Finally, the number of pixels examined has significantly decreased as a result of this precise and careful selection of cell-rich areas (FC = 205425 px, PAT = 173027 px, PC = 60929 px). This step further simplifies MSI data elaboration, requiring less computational resources for spatial-omics analysis, and speeding up the molecular characterization of samples with complex histopathological features. The proposed workflow is flexible in terms of the pixel classifier task, the WSI staining (e.g., H&E, Papanicolaou), and the MALDI-MSI modality (e.g., proteomics, lipidomics, glycomics), allowing easy replacement with different or more powerful morphology-specific pixel/instance-classifier predictive models as they become available, given sufficient computational resources for inference.
Improvement of Signals of Interest
To investigate the informative power of the PC ROI, the signal intensity of the contaminant peaks was first explored. The peak lists obtained using mMass (v5.5.0)? were compared with a reference list containing m/z signals corresponding to the HCCA matrix and trypsin autolysis signals. For the PC ROI, around a 15% decrease in the signal intensity of 11 interfering peaks from the HCCA matrix (m/z 839.08, m/z 845.09, m/z 855.05, m/z 861.06, m/z 867.08, m/z 1036.13, m/z 1044.09, m/z 1054.08, m/z 1060.06, m/z 1066.08) and 3 from trypsin autolysis (m/z 842.51, m/z 1045.56, m/z 1220.64) was observed when comparing it to the PAT and FC ROIs, as shown in FigureA. Conversely, the signal intensity of tryptic peptides significantly increased. In particular, four peptides of interest, previously identified in a comparable MSI dataset,? were investigated in the three ROI types.
*Interferents and peptide signal intensities in full core (FC), pathologist (PAT), and pixel classifier (PC) ROIs. A color legend is provided on the right, illustrating the ROI type and the corresponding color code. (A) Signal intensity of contaminant peaks in the three ROI types. On the y-axis, the relative signal intensity of each contaminant m/z peak on the x-axis is provided. The m/z signals on the left group belong to 4-HCCA peaks, while those on the right correspond to trypsin autolysis peaks. (B) Bar plot reporting the signal intensities of four tryptic peptides: H2A1A_HUMAN, P2R3A_HUMAN, H4_HUMAN, and DDX42_HUMAN (Histone H2A type 1-A, Serine/threonine-protein phosphatase 2A regulatory subunit B” subunit alpha, Histone H4, and ATP-dependent RNA helicase DDX42). The absolute intensity (a.i.) and corresponding error bars in the three ROI types are reported. Two-way ANOVA with Bonferroni post-tests results are reported above the bar plot (P < 0.001= ***, P < 0.01 = **, P < 0.05 = ).
As shown in FigureB, the signal intensity of these four analytes showed a significant improvement in PC ROIs, compared to both the FC (+38%) and the PAT (+35%) ROIs. This signal intensity increment is even clearer when looking at the signal intensities of these peptides in different histopathological classes included in the TMA, as shown in Figure S6. Here, we can appreciate a significant signal increase in the malignant conditions (FVPTC and PTC) when comparing not only FC and PC but also PAT and PC ROIs. When looking at the NIFTP regions, we can observe that no significant improvement in signal intensity is observed when using manual annotations (PAT). However, the PC ROIs led to a significant improvement (average +31% compared to FC and +30% compared to PAT) for peptides of interest intensities. These observations can be extended generally to all peptide signals and lead to more molecularly informative spectra. In fact, when performing peak-picking, the S/N plays a crucial role in feature finding. As a result, a greater number of interfering peaks were found in FC spectra, compared to both PAT and PC regions. Overall, 527 m/z values were common to the three ROIs' peak lists. Importantly, the PC peak list allowed the detection of a greater number of unique (+34% and +95%) and total m/z values (+9% and +24%) compared to FC and PAT. Overall, the PC ROIs allowed for a decrease of the interfering signals (matrix peaks and trypsin autolysis peaks) while increasing the S/N of the analytes of interest, in this case, tryptic peptides. These results lead to the retrieval of deeper proteomic information from the histopathological classes included in this study.
Histopathological Discrimination
Since the ultimate scope of the MSI analysis performed on this TMA was to identify possible molecular signatures able to distinguish diverse thyroid pathologies, we compared the ability to discriminate the four pathologic conditions in the three ROI types. To do so, PCA was performed separately on FC, PAT, and PC ROIs. When the PCA obtained from the FC ROIs in FigureA, a large variability within the four different histopathological regions is observed, and no clear clusters are highlighted. On one hand, with the PAT ROIs, a general improvement of the clustering is observed, with a separation of PTC regions from FVPTC, NIFTP, and FA along principal component (PC) 3. On the other hand, FVPTC and NIFTP regions appear to be dispersed in two separate classes each, suggesting that the PAT annotations and the relative peak list are not able to define a clear molecular signature for these histopathological regions. Conversely, looking at the PCA of the PC ROIs, we can appreciate a separation of the four diagnostic classes according to their aggressiveness along the first component. In fact, a clear cluster for the benign condition (FA) close to the origin of the axes can be observed, while moving along higher values of the PC1, it is possible to see an NIFTP cluster, followed by the FVPTC. The PTC region is separated along the second and third components, suggesting a higher molecular variability compared to the other histologic regions. The NIFTP regions are separated into two clusters along PC2 and PC3. This observation confirms the molecular behavior already observed with MALDI-MSI in a previous work.?
Principal component analysis (PCA) of proteomics profiles obtained from FC (A), PAT (B), and PC (C) ROIs, using the corresponding peak list. 3D PCA score plots showing the clustering of proteomics features extracted from mass spectrometry imaging data. Each point represents a pixel-level spectrum, with the three principal components (Component 1, Component 2, and Component 3) capturing the majority of variance across the datasets. A color legend indicating the corresponding histopathological class is provided on the right.
To further explore the discriminatory capability of the PC ROIs compared to FC and PAT, a ROC analysis was performed using the three peak lists obtained, comparing each diagnostic class to the others. Briefly, the PC peak list allowed for finding around 50% more discriminatory m/z signals compared to the FC and PAT (PC = 41, PAT = 21, and FC = 22). Nonetheless, when comparing the area under the curve (AUC) for the same m/z value in the different ROIs, the PC data allowed for the highest value in the same comparison, as shown in the example in Figure.
Receiver operating characteristic (ROC) curves for the classification of thyroid tumor subtypes based on the intensity of an exemplary m/z signal (m/z 1198.7017 ± 20 ppm). The left column compares FVPTC with NIFTP, while the right column compares PTC with NIFTP, across three types of regions of interest (ROIs): FC (top row), PAT (middle row), and PC (bottom row). The area under the curve (AUC) values indicate classification performance, with higher AUCs reflecting better discrimination. The PC ROIs show the highest classification accuracy in both comparisons (PTC vs NIFTP, AUC = 0.86; FVPTC vs NIFTP, AUC = 0.76).
Conclusions
In this work, we showed how a QuPath PC can be leveraged to enable the precise selection of cell-rich ROIs, effectively minimizing contamination from colloid-rich regions and reducing interfering signals, such as matrix peaks and trypsin autolysis products. Importantly, the refined ROIs retain the original pathologist-assigned labels (e.g., normal, tumor), enabling accurate biological interpretation. The obtained results confirm that the cell-rich ROIs selection achieved with QuPath enhances cell proteomic signatures. As a result, the S/N of tryptic peptides was enhanced, allowing for a deeper proteomic characterization of the histopathological subtypes analyzed. The improved proteomic information is particularly relevant for the discrimination of NIFTP lesions, which present diagnostic challenges due to their histological and molecular overlap with other follicularly patterned thyroid neoplasms. On one hand, by refining molecular characterization, this approach may aid in the accurate classification of NIFTP nodules, reducing diagnostic uncertainty and supporting better clinical decision-making. On the other hand, improving cell-specific molecular signatures might assist the identification of novel putative biomarkers that could be included in routine clinical diagnostic workflows. Finally, the presented work used a single thyroid TMA with multiple diagnostic classes as a proof-of-concept dataset. Future work will employ the PC ROI’s selection to multiple thyroid nodules TMAs. By doing so, patient size will be improved to reinforce the statistical strength of novel putative biomarkers for thyroid nodule precise discrimination. This preliminary approach lays the groundwork for further improvement in spatial-omics analysis, in terms of both time and resource efficiency, including computational time and operator-dependent workload.
Supplementary Material
The reference list from the paper itself. Each links out to its DOI / PubMed record.
- 1Colley M. E.Esselman A. B.Scott C. F.Spraggins J. M.High-specificity imaging mass spectrometry Annual Review of Analytical Chemistry 20241712410.1146/annurev-anchem-083023-02454638594938 · doi ↗ · pubmed ↗
- 2Baquer G.SementéL.Mahamdi T.Correig X.Ràfols P.García-Altares M.What are we imaging? Software tools and experimental strategies for annotation and identification of small molecules in mass spectrometry imaging Mass Spectrom. Rev.2023421927196410.1002/mas.2179435822576 · doi ↗ · pubmed ↗
- 3Piga I.Magni F.Smith A.The journey towards clinical adoption of MALDI-MS-based imaging proteomics: from current challenges to future expectations FEBS Lett.202459862163410.1002/1873-3468.1479538140823 · doi ↗ · pubmed ↗
- 4Liu H.Pan Y.Xiong C.Han J.Wang X.Chen J.Nie Z.Matrix-assisted laser desorption/ionization mass spectrometry imaging (MALDI MSI) for in situ analysis of endogenous small molecules in biological samples Tr AC Trends in Analytical Chemistry 202215711680910.1016/j.trac.2022.116809 · doi ↗
- 5Kittrell C.Sells B.Young L.Angel P.Drake R.471 Defining proteomic and cellular elements of the pancreatic ductal adenocarcinoma (PDAC) tumor microenvironment with mass spectrometry imaging Journal of Clinical and Translational Science 2025913913910.1017/cts.2024.1064 · doi ↗
- 6Kremslehner C.Zoratto S.Sochorova M.Haschemi A.Ponwieser E.Gendronneau G.Marchetti-Deschmann M.Gruber F.Imaging the skin epilipidome and the activity of metabolic key enzymes in the senescence process at single cell level Free Radical Biol. Med.2023208 S 5310.1016/j.freeradbiomed.2023.10.121 · doi ↗
- 7Claes B. S.Krestensen K. K.Yagnik G.Grgic A.Kuik C.Lim M. J.Rothschild K. J.Vandenbosch M.Heeren R. M.MALDI-IHC-guided in-depth spatial proteomics: targeted and untargeted MSI combined Analytical chemistry 2023952329233810.1021/acs.analchem.2c 0422036638208 PMC 9893213 · doi ↗ · pubmed ↗
- 8Capitoli G.Piga I.Galimberti S.Leni D.Pincelli A. I.Garancini M.Clerici F.Mahajneh A.Brambilla V.Smith A.MALDI-MSI as a Complementary diagnostic tool in cytopathology: a pilot study for the characterization of thyroid nodules Cancers 201911137710.3390/cancers 1109137731527543 PMC 6769566 · doi ↗ · pubmed ↗