Proteome-Wide Multipoint Internal Calibration Curves for Evaluating Peptide-Level Linearity in Relative Quantitative Proteomics
Cristina Chiva, Zahra Elhamraoui, Julia Morales-Sanfrutos, Olga Pastor, Eduard Sabidó

TL;DR
This paper introduces a new method using TMT to create internal calibration curves for all peptides in a proteome, improving accuracy in relative quantification.
Contribution
A novel TMT-based multipoint internal calibration strategy for proteome-wide peptide linearity assessment in a single experiment.
Findings
The new strategy enables internal calibration curves for all identified peptides in a proteome.
Application to human ovarian cancer cells revealed significant proteome changes after cisplatin treatment.
Abstract
Mass spectrometry (MS)-based proteomics is known for its high accuracy in quantifying peptides and proteins using various calibration strategies including internal and external calibration curves. While external multipoint calibration curves are created from serial dilutions, they often fail to account for sample-specific matrix effects. In contrast, internal calibration curves account for the sample matrix but face scalability and cost challenges for whole proteome analyses. In this manuscript, we present a novel TMT-based multipoint internal calibration curve strategy, which enables the generation of internal calibration curves for all peptides identified within a proteome in a single experiment to assess their linearity prior relative quantification. We applied this strategy to human ovarian cancer cells to evaluate the linear quantitative responses of all of the identified peptides…
Genes, proteins, chemicals, diseases, species, mutations and cell lines named across the full text — each resolved to its canonical identifier and authoritative record.
Click any figure to enlarge with its caption.
 1
1|
|
|
|
|---|---|---|
| 126 | SK-OV-3 Cells Untreated Replicate 1 | 25 |
| 127N | SK-OV-3 Cells Untreated Replicate 2 | 25 |
| 127C | SK-OV-3 Cells Untreated Replicate 3 | 25 |
| 128N | SK-OV-3 Cells Treated (25 μM cisplatin) Replicate 1 | 25 |
| 128C | SK-OV-3 Cells Treated (25 μM cisplatin) Replicate 2 | 25 |
| 129N | SK-OV-3 Cells Treated (25 μM cisplatin) Replicate 3 | 25 |
| 129C | Calibration curve pool | 0.25 |
| 130N | Calibration curve pool | 1.25 |
| 130C | Calibration curve pool | 6.25 |
| 131N | Calibration curve pool | 25 |
| 131C | Calibration curve pool | 125 |
| Example
1: Protein | |||
|---|---|---|---|
|
|
|
|
|
| [R].ELIQAK.[V] | Nonlinear | - |
|
| [K].LQNFAQLPAHR.[V] | 4 Linear Points | R2 4 = 0.975 | |
|
|
| ||
| Using all peptides | 0.48 | 0.110 | |
| Using only linear peptides | 0.85 | 0.001 | |
- —H2020 Marie Sklodowska-Curie Actions10.13039/100010665
- —Ministerio de Ciencia, Innovaci?n y Universidades10.13039/100014440
- —Ministerio de Ciencia, Innovaci?n y Universidades10.13039/100014440
- —Centres de Recerca de Catalunya10.13039/100015439
- —Departament d'Universitats, Recerca i Societat de la Informaci?10.13039/501100006531
Peer Reviews
No public reviews on file for this paper yet. If you reviewed it on a platform where reviews are public (OpenReview, ICLR, NeurIPS, ICML), you can paste yours below so the community can read it here.
Videos
No videos yet. Explain this paper in a talk, walkthrough, or lecture? Add one.
Taxonomy
TopicsAdvanced Proteomics Techniques and Applications · Mass Spectrometry Techniques and Applications · Advanced Biosensing Techniques and Applications
Introduction
Mass spectrometry (MS)-based proteomics is well-known for its ability to identify and quantify thousands of peptides and proteins in complex biomedical samples. ?,? In proteome-wide studies, protein relative quantification is performed by comparing peptide areas to derive fold-changes between conditions. In these experiments, the linear range of quantification and the positioning of each endogenous peptide within this range are often not evaluated, which can affect the accuracy and precision of subsequent protein relative quantification. In contrast, in quantitative targeted proteomics experiments, various calibration strategies are employed, including internal and external calibration curves, to establish the relationship between peptide signal and peptide concentration. ?−? ? ? While these curves establish the range of linearity between instrument response and analyte concentration, they also have limitations in accounting for sample-specific matrix effects, as linearity is not directly determined within each sample. This issue is particularly significant when dealing with patient cohorts and complex samples, where variations in sample matrices can affect the linear quantitative behavior and, therefore, the accuracy in relative proteome quantification. To address these limitations, internal calibration curves have been proposed, using either matrix-matched approaches? or by spiking isotopically labeled standards directly into the samples. ?−? ? These internal isotopically labeled standards are often used in the single-point internal calibration mode, in which a known concentration of the standard is added to determine the response factor, assuming a linear relationship through zero. While this method is quick and resource-efficient, it does not fully capture the complexity of the response curve. A few years ago we developed an isotopologue multipoint calibration strategy (ImCal) that uses a mixture of isotopically labeled peptides at different concentrations to establish a multipoint internal calibration curve for the peptides of interest.? This method facilitated determining the linear range of quantification for each targeted analyte directly in its sample, and it ensured precise and accurate absolute quantification of specific peptides in targeted proteomics applications. ?−? ? However, the use of multiple isotopologue peptides increases the cost of each targeted assay, and its application to entire proteomes remains limited due to the challenges of scaling, making it suitable only for clinical projects in which a small number of peptides are measured across a large number of samples.
In this study, we relied on the ImCal concept to evaluate the peptide quantitative linearity in the entire proteome by developing a tandem mass tag (TMT)-based multipoint internal calibration curve strategy for all of the peptides identified within a proteome. This approach is based on TMT-labeled serial dilutions of total protein extract that are used to generate internal calibration curves together with the samples of interest within a single experiment. These multipoint internal calibration curves enable researchers to assess the quantitative linearity of each identified peptide in its context matrix prior its use in relative quantification.
Materials and Methods
Human ovarian cancer cells (SK-OV-3 from American Type Culture Collection, ATCC) were cultured in the presence or absence of 25 μM cisplatin in triplicates. Protein extracts (600 μg) were reduced with TCEP (1.8 μmol, 37 °C, 60 min), alkylated in the dark with iodoacetamide (3.6 μmol, 25 °C, 30 min), and digested with endoproteinase LysC (1:10 w:w, 37 °C, over 6h, Wako, cat
129–02541) and trypsin (1:10 w:w, 37 °C, over 8h, Promega
cat # V5113). After digestion, the peptide mixes were acidified with formic acid and desalted with a MicroSpin C18 column (The Nest Group, Inc.). A pooled sample was generated by combining equal amounts of the three biological replicates from both conditions to create a pool from which to generate an internal calibration curve with five different serial dilutions. Individual samples were labeled using tandem mass tags (TMT-11) according to the manufacturer instructions and the experimental design specified in Table. This experiment was performed in triplicate. TMT mixes were fractionated using a basic pH reversed-phase fractionation. Twelve fractions were analyzed in using an Orbitrap Eclipse mass spectrometer (Thermo Fisher Scientific, San Jose, CA, USA) coupled to an EASY-nLC 1000 (Thermo Fisher Scientific (Proxeon), Odense, Denmark) with a 90 min gradient.? Data acquisition was done using the real-time synchronous precursos selection MS3 acquisition method (RTS-SPS-MS3).? The scan sequence began with an MS1 spectrum, and in each cycle of data-dependent acquisition analysis, following each survey scan, the most intense ions were selected for fragmentation. Fragment ion spectra were produced via collision-induced dissociation (CID) at normalized collision energy of 35% and they were acquired in the ion trap mass analyzer in “Turbo” mode. MS2 spectra were searched in real time using the algorithm embedded in the instrument control software and the canonical human database from Uniprot (version 2021). MS2 spectra with an Xcorr greater than or equal to 1 and less than 10 ppm precursor mass error triggered the submission of an MS3 spectrum to the instrument. MS3 spectra were collected using the multinotch MS3-based TMT method, in a way where ten MS2 fragment ions were captured in the MS3 precursor population using isolation waveforms with multiple frequency notches. MS3 precursors were fragmented by high energy collision-induced dissociation (HCD) at a normalized collision energy of 65% and acquired in the Orbitrap analyzer. The mass spectrometry proteomics data have been deposited to the ProteomeXchange Consortium via the PRIDE partner repository with the data set identifier PXD059628.?
1: Experimental Design for samples, Tandem Mass Tags, and Protein Amounts (μg) Multiplexed in a Single TMT Batch
Acquired spectra were analyzed using the Proteome Discoverer software suite (v2.4, Thermo Fisher Scientific) and the Mascot search engine (v2.6, Matrix Science).? Data was searched against a customized database including the Uniprot human canonical database plus a list of common contaminants and all the corresponding decoy entries (version 2021).? For peptide identification, a precursor ion mass tolerance of 7 ppm was used for the MS1 level, trypsin was chosen as enzyme, and up to three missed cleavages were allowed. The fragment ion mass tolerance was set to 0.5 Da for the MS2 spectra. Oxidation of methionine and N-terminal protein acetylation were used as variable modifications, whereas carbamidomethylation on cysteines, TMT6plex in Lysines and in peptide N-terminal were set as a fixed modification. False discovery rate (FDR) in peptide identification was set to a maximum of 5%. The list of identified peptides was filtered to remove those peptides without quantitation values, i.e. those labeled as “NoQuanLabels”, “NoQuanValues” and “ExcludedByMethod” by the Proteome Discoverer software suite were excluded from the subsequent quantification analysis. Peptides were quantified using the reporter ion intensities in MS3. Reporter ion intensities were adjusted to correct for the isotopic impurities of the different TMT reagents according to the manufacturer specifications. A linear regression was fit for peptides with at least three valid quantitative values within the calibration curve. Statistical inference was performed MSstatsTMT (v4.16). ?−? ?
This research did not involve human or animal participants, and according to the CRG, all experiments were performed with proper ethics.
Results
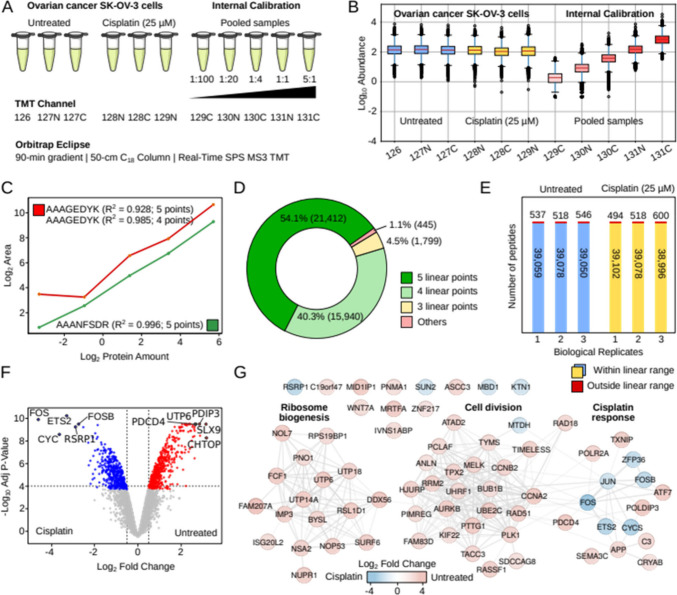
To evaluate the quantitative linearity of each identified peptide within a proteome, human ovarian cancer cells (SK-OV-3) were cultured in triplicate with and without cisplatin (25 μM), and the resulting proteomes were digested with endoproteinase LysC and trypsin. Simultaneously, a pooled sample was prepared to generate serial dilutions for the internal multipoint calibration curve (FigureA,B and Table). Tandem mass tags (TMT-11) were employed to label all of the samples and serial dilutions, which were combined to form a single multiplexed TMT experiment. After basic pH reversed-phase fractionation, the TMT samples were analyzed using a 90 min gradient on an Orbitrap Eclipse mass spectrometer, and an acquisition method with real-time search and synchronous precursor selection MS3 analysis (RTS-SPS-MS3). ?,? The acquired data were processed using Proteome Discoverer (v2.4) and all the mass spectrometry proteomics data have been deposited to the ProteomeXchange Consortium via the PRIDE partner repository? with the data set identifier PXD059628.
A) Human ovarian cancer cells (SK-OV-3) were cultured in triplicate with and without cisplatin treatment (25 μM) and subsequently digested with trypsin. An internal multipoint calibration curve was generated using a pooled sample with six different dilutions ranging from 5:1 to 1:100. B) Experimental log-transformed peptide abundance values (MS3 reported ion intensities) corresponding to the three biological replicates of human ovarian cancer cells (SK-OV-3) cultured with and without cisplatin and to the serial dilutions of the internal calibration curve. C) Linear regression fit for peptides [K].AAANFSDR.[S] (green) with 5 linear points (R2 > 0.99), and [K].AAAGEDYK.[A] (red) with four linear points (R2 > 0.98). D) Donut chart illustrating the classification of peptide linearity based on the count of linear points with R2 > 0.95. A linear fit was applied to all valid quantitative points for each peptide, and the R2 value was calculated. If R2 was below 0.95, the lowest concentration value was iteratively removed until R2 exceeded 0.95. The remaining quantitative values represent the number of linear points for that peptide. E) Number of endogenous peptides from the ovarian cancer cell lines that lay within the linear range established with the internal multipoint calibration curves. F) Volcano plot with proteins with significant abundance changes in human ovarian cancer cells (SK-OV-3) with and without cisplatin treatment (25 μM) using linear peptides. G) Functional protein–protein interaction networks (String-db) with the proteins exhibiting the most significant fold-changes in protein abundance in cisplatin treated human ovarian cancer cells (SK-OV-3) using linear peptides.
Using this TMT-based approach, we first evaluated the linear behavior of the TMT-labeled internal calibration curves for 39,596 peptides with at least three valid quantitation valuesout of a total of 46,641 identified peptides (). Based on the log-transformed MS3 signals obtained from the TMT-labeled calibration curves, we calculated the number of linear points for each peptide. Briefly, a linear fit was applied to all valid quantitative points for each peptide, and R^2^ was calculated. If R^2^ was below 0.95, the lowest concentration value was iteratively removed until R^2^ exceeded 0.95. The remaining quantitative values represent the number of linear points for that peptide. With this approach, we observed that the majority of identified peptides exhibited an excellent linear quantitative response within the serial dilutions tested, with approximately 95% of them demonstrating complete or nearly complete linear regression curves, i.e. four or five linear points with R^2^ > 0.95 (FigureC,D). Not only were most calibration curves complete, but when missing values did occur, these missing values were predominantly found at the lowest values of the calibration curves (i.e., 89.7% of the missing points were found in the lowest concentration), thus aligning with the expectations for the data. The excellent linear quantitative response observed in this study contrasts with previous quantitative results reported at the MS1 and MS2 levels, ?,?,? and it is likely attributable to the enhanced interference removal achieved through the synchronous precursor selection (SPS) MS3 quantification, as well as the fact that potential coisolated interferences will rarely contribute to the corresponding TMT channel.
After evaluating the linear behavior of the TMT-labeled dilution curves for all identified peptides, we aimed to assess the reproducibility of this quantitative behavior across different batches. To achieve this, we conducted two additional TMT-labeled experiments, following the same experimental design, sample preparation, data acquisition, and data analysis protocols as those previously described. The analysis of the three TMT-calibrated replicate experiments resulted in the identification and quantification of 57,951 peptides, with approximately 70% (39,224 peptides) being identified and quantified in at least two out of the three batches (). This result highlights a common challenge in analyzing multiple TMT batches, where slight variations in the list of identified peptides reduce the completeness across batches. Nevertheless, for the peptides identified in all batches, we evaluated whether their quantitative behavior remained consistent. We observed that approximately 90% (35,077) of the peptides exhibiting complete or nearly complete linear regression dilution curves,i.e. four or five linear points with R^2^ > 0.95 in one batch, also demonstrated a complete or nearly complete linear quantitative behavior in the other batches in which they were identified. Some peptides exhibited four linear quantitative points in one batch, while showing five in another, and vice versa. In the batches where only four linear quantitative points are observed, the peptides consistently display lower intensity in the MS3 spectra compared to the same peptide in the other batches. This observation could be attributed to the precise timing of the sampling events for fragmentation during chromatographic elution, to small differences in R^2^ values around 0.95, and to specific matrix effects from coeluting peptides present in each of the three batches ().
Finally, we applied the TMT calibration curves to a model system of ovarian cancer (SK-OV-3 cell line) treated with and without cisplatin (25 μM) to quantify the proteome remodeling that occurs after treatment. First, we assessed whether the endogenous peptides fell within the linear range of quantification established by the internal multipoint calibration curves constructed for each peptide. We observed that the vast majority of peptides identified in human ovarian cancer cells were within the linear range of quantification in the different replicates assessed (FigureE). This observation enables accurate and precise relative quantification for most proteins either through direct comparison of the MS3 reported ion intensities, or by adjusting these intensities using the individualized regression lines derived from the calibration curves available for each peptide. As a direct consequence of this finding, the fold changes in protein abundances obtained by directly comparing reporter ion signals were similar to those derived from calibrated reporter ion signals (). However, for some proteins, discrepancies arise in the estimated fold-changes and p-values depending on whether quantification is performed using all endogenous peptides or only those within the linear range of quantitation, leading to differences in the set of significantly changing proteins (Table and ). This highlights that the decision to include all peptides or restrict the analysis to those with linear quantitative behavior can impact the overall statistical significance of certain proteins and, therefore, influence the biological conclusions drawn from an experiment. Following these observations, we conducted the proteome relative quantification of the ovarian cancer model with and without cisplatin treatment using only endogenous peptides within the linear range of quantification with MSstats (v4.12.1). ?−? ? This relative quantification allowed us to discern the significant changes in the proteome of the ovarian cancer cell lines following cisplatin treatment, which primarily affected proteins associated with the ribosome biogenesis, cell cycle, nucleic acid metabolic processes and, as expected, the cellular response to cisplatin (FigureF,G, ).
2: Examples of Discrepancies in Protein Relative Quantification between Treated and Untreated (Cisplatin 25 μM) SK-OV-3 Ovarian Cancer Cells When Using All Identified Peptides or Only Those with a Linear Quantitative Behavior
Beyond the use case just highlighted, using the TMT-based strategy to assess peptide-level linearity in relative quantification could also enhance results in more sensitivity-challenging scenarios, such as low-input and single-cell proteomics, where a greater number of peptides are likely to fall within the noise and thus be outside the linearity range. In these scenarios, the increased proportion of nonlinear peptides could impact relative quantification if they are not identified and filtered out beforehand, thereby enhancing the value of the TMT-based strategy presented here. To illustrate the effect of using nonlinear peptides in scenarios that challenge sensitivity, we took advantage of the existing dilutions within the calibration curve to calculate their expected protein ratios to the 1:1 dilution. This analysis shows that employing only the peptides previously designated as linear results in significantly reduced dispersion around the expected theoretical protein ratios, and that the effect is especially pronounced when calculating ratios involving lower dilutions, where quantitative linearity is often compromised (). Finally, to further demonstrate the value of internal multipoint calibration curves, we simulated more challenging scenarios by adding increasing background noise to the ovarian cancer experimental data set. This was accomplished by adding constant background offsets of 20, 50, or 200 units to the measured values of each TMT channel (). Higher background noise increased the number of nonlinear peptides () and amplified the discrepancies in the calculation of protein fold-changes when using all identified peptides versus using only linear peptides (). Moreover, having an internal calibration curve not only helped identify peptides within the linear range of quantification but also enabled the calibration of endogenous peptide intensities, robustly recovering the original fold-changes despite higher background noise ().
Conclusion
In conclusion, we developed a tandem mass tag (TMT)-based multipoint internal calibration curve strategy that extends the benefits of internal calibration to assess the quantitative linearity range for each identified peptide in a proteome before its use in relative quantification. By applying this approach to human ovarian cancer cells with real-time synchronous precursor selection (SPS) MS3 quantification, we demonstrated that the majority of identified peptides exhibit a linear quantitative response within the serial dilutions tested and that most endogenous peptides fall within the linear range of quantification. Our experimental findings, together with the observations in simulated data sets with higher background noise, highlight the importance of this TMT-based approach as a method to assess peptide-level linearity and to identify peptides outside the linear quantification range before performing relative protein quantification, while also providing insights into proteome remodeling in ovarian cancer cells in response to cisplatin treatment.
Supplementary Material
The reference list from the paper itself. Each links out to its DOI / PubMed record.
- 1Aebersold R.Mann M.Mass Spectrometry-Based Proteomics Nature 2003422692819810.1038/nature 0151112634793 · doi ↗ · pubmed ↗
- 2Aebersold R.Mann M.Mass-Spectrometric Exploration of Proteome Structure and Function Nature 2016537762034710.1038/nature 1994927629641 · doi ↗ · pubmed ↗
- 3Abbatiello S. E.Mani D. R.Schilling B.Maclean B.Zimmerman L. J.Feng X.Cusack M. P.Sedransk N.Hall S. C.Addona T.Allen S.Dodder N. G.Ghosh M.Held J. M.Hedrick V.Inerowicz H. D.Jackson A.Keshishian H.Kim J. W.Lyssand J. S.Riley C. P.Rudnick P.Sadowski P.Shaddox K.Smith D.Tomazela D.Wahlander A.Waldemarson S.Whitwell C. A.You J.Zhang S.Kinsinger C. R.Mesri M.Rodriguez H.Borchers C. H.Buck C.Fisher S. J.Gibson B. W.Liebler D.Maccoss M.Neubert T. A.Paulovich A.Regnier F.Skates S. J.Tempst P.Wang M.Carr S. A.Design, Implementation and Multisite Ev · doi ↗ · pubmed ↗
- 4Abbatiello, S. E. ; Schilling, B. ; Mani, D. R. ; Zimmerman, L. J. ; Hall, S. C. ; Mac Lean, B. ; Albertolle, M. ; Allen, S. ; Burgess, M. ; Cusack, M. P. ; Ghosh, M. ; Hedrick, V. ; Held, J. M. ; Inerowicz, H. D. ; Jackson, A. ; Keshishian, H. ; Kinsinger, C. R. ; Lyssand, J. ; Makowski, L. ; Mesri, M. ; Rodriguez, H. ; Rudnick, P. ; Sadowski, P. ; Sedransk, N. ; Shaddox, K. ; Skates, S. J. ; Kuhn, E. ; Smith, D. ; Whiteaker, J. R. ; Whitwell, C. ; Zhang, S. ; Borc · doi ↗ · pubmed ↗
- 5Carr S. A.Abbatiello S. E.Ackermann B. L.Borchers C.Domon B.Deutsch E. W.Grant R. P.Hoofnagle A. N.Hüttenhain R.Koomen J. M.Liebler D. C.Liu T.Mac Lean B.Mani D. R.Mansfield E.Neubert H.Paulovich A. G.Reiter L.Vitek O.Aebersold R.Anderson L.Bethem R.Blonder J.Boja E.Botelho J.Boyne M.Bradshaw R. A.Burlingame A. L.Chan D.Keshishian H.Kuhn E.Kinsinger C.Lee J. S. H.Lee S.-W.Moritz R.Oses-Prieto J.Rifai N.Ritchie J.Rodriguez H.Srinivas P. R.Townsend R. R.Van Eyk J.Whiteley G.Wiita A.Weintraub S.Targeted Peptide Measurements in Biology and Medi · doi ↗ · pubmed ↗
- 6Abbatiello S.Ackermann B. L.Borchers C.Bradshaw R. A.Carr S. A.Chalkley R.Choi M.Deutsch E.Domon B.Hoofnagle A. N.Keshishian H.Kuhn E.Liebler D. C.Mac Coss M.Mac Lean B.Mani D. R.Neubert H.Smith D.Vitek O.Zimmerman L.New Guidelines for Publication of Manuscripts Describing Development and Application of Targeted Mass Spectrometry Measurements of Peptides and Proteins Mol. Cell Proteomics 201716332732810.1074/mcp.E 117.06780128183812 PMC 5340997 · doi ↗ · pubmed ↗
- 7Pino L. K.Searle B. C.Yang H.-Y.Hoofnagle A. N.Noble W. S.Mac Coss M. J.Matrix-Matched Calibration Curves for Assessing Analytical Figures of Merit in Quantitative Proteomics J. Proteome Res.20201931147115310.1021/acs.jproteome.9b 0066632037841 PMC 7175947 · doi ↗ · pubmed ↗
- 8Schilling B.Mac Lean B.Held J. M.Sahu A. K.Rardin M. J.Sorensen D. J.Peters T.Wolfe A. J.Hunter C. L.Mac Coss M. J.Gibson B. W.Multiplexed, Scheduled, High-Resolution Parallel Reaction Monitoring on a Full Scan Qq TOF Instrument with Integrated Data-Dependent and Targeted Mass Spectrometric Workflows Anal. Chem.2015871022210.1021/acs.analchem.5b 0298326398777 PMC 5677521 · doi ↗ · pubmed ↗