Local systems, local solutions: which factors drive essential medicine availability in public health facilities across Indonesia?
Relmbuss Biljers Fanda, Ari Probandari, Yuyun Yuniar, Margo van Gurp, Wouter Guus van der Hoeven, Harimat Hendarwan, Laksono Trisnantoro, Maarten Olivier Kok

TL;DR
This study explores why essential medicines are unevenly available in Indonesian health centers, finding that local systems and infrastructure play a key role.
Contribution
The study identifies localized factors and pharmaceutical system functionality as key drivers of medicine availability in Indonesian health facilities.
Findings
66% of essential medicines were available on average in primary health centers, with significant variation between districts.
PHCs with pharmacists, proper storage, and inventory management had higher medicine availability.
High-availability clusters were found even in low-performing districts, indicating the influence of localized factors.
Abstract
Ensuring free access to essential medicines is a cornerstone of universal health coverage, yet many countries face persistent local disparities in medicine availability. This study investigates the factors driving variation in essential medicine availability in primary health facilities across Indonesia, focusing on the functionality of Local Pharmaceutical Systems (LOPHAS) and the influence of socioeconomic and geographical environments. Enumerators visited each of the 514 district health offices and 9831 primary health centres (PHCs) to conduct a nationwide health facility assessment. These data were combined with publicly available information on spatial, geographical, socioeconomic and health system factors. Using regression analysis, multilevel modelling and spatial autocorrelation techniques, we identified facility-level, district-level and provincial-level factors associated…
Genes, proteins, chemicals, diseases, species, mutations and cell lines named across the full text — each resolved to its canonical identifier and authoritative record.
Click any figure to enlarge with its caption.
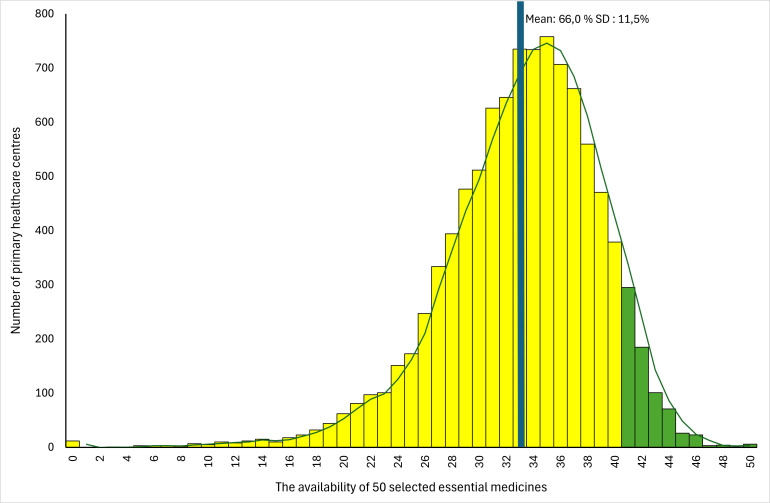 Figure 1
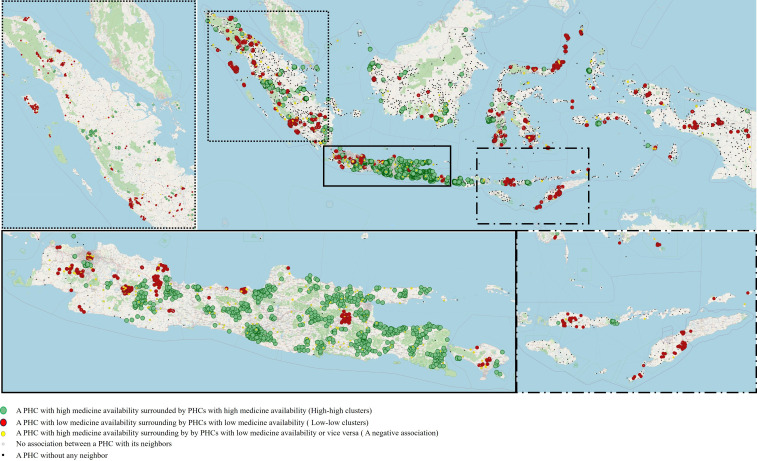 Figure 2
| The availability of 50 medicines | ||||
|---|---|---|---|---|
|
|
|
|
| |
| PHC level | ||||
| Output | ||||
| Medicine availability | 9831 | 100.00 | 66.00 | 11.50 |
| Local pharmaceutical systems | ||||
| Managing human and physical resources | ||||
| The availability of pharmacists | 7630 | 77.61 | 67.17 | 10.58 |
| The availability of medicine shelves | 9483 | 96.46 | 66.42 | 11.11 |
| Perceived of a sufficient number of shelves | 5886 | 59.87 | 66.92 | 11.01 |
| The availability of lighting | 9066 | 92.22 | 66.51 | 11.14 |
| The availability of the guidelines of medicine and medical product services | 8393 | 85.37 | 66.96 | 10.91 |
| The availability of the guidelines for preparing and dispensing medicine concoction prescription | 8702 | 88.52 | 66.91 | 10.89 |
| Inpatient services | 4094 | 41.64 | 68.70 | 11.06 |
| Accredited | 7569 | 76.99 | 67.71 | 10.5 |
| The availability of ventilation or air circulation | 8628 | 87.76 | 66.44 | 11.19 |
| The availability of a separate room for pharmaceutical products | 9548 | 97.12 | 66.38 | 11.15 |
| The availability of the guidelines for preparing and dispensing dry syrup | 7848 | 79.83 | 66.99 | 10.99 |
| Financing | ||||
| Receiving district government fund | 6289 | 63.97 | 66.73 | 11.08 |
| Receiving retribution from patients | 6569 | 66.82 | 67.75 | 10.6 |
| Receiving a non-capitation fund from the National Health Insurance Agency (BPJS Kesehatan) | 6570 | 66.83 | 67.87 | 10.5 |
| Receiving a central government fund | 7562 | 76.92 | 66.11 | 11.57 |
| Receiving the capitation fund from the National Health Insurance Agency (BPJS Kesehatan) | 9441 | 96.03 | 66.26 | 11.44 |
| Having independent financial autonomy | 3239 | 32.95 | 68.24 | 10.62 |
| Monitoring performance | ||||
| Having the PHC management information system (SIMPUS) | 6087 | 61.92 | 66.82 | 11.22 |
| Having an electronic PHC management information system (SIMPUS) | 4257 | 43.30 | 67.78 | 10.66 |
| Having an online PHC management information system (SIMPUS) | 3430 | 34.89 | 67.98 | 10.47 |
| Managing pharmaceutical product supply | ||||
| Developing an independent medicine quantification | 8119 | 82.59 | 66.81 | 10.81 |
| The availability of medicine use and ordering a monthly report (LPLPO) | 9722 | 98.89 | 66.17 | 11.44 |
| The completeness of LPLPO | 9351 | 95.12 | 66.41 | 11.22 |
| Implementing DRP planning for an 18-month period | 7285 | 74.10 | 66.76 | 11.22 |
| Sources of medicine—combining DHO & PHC | 3984 | 40.52 | 67.92 | 10.5 |
| Achieving the volume target | 6383 | 64.93 | 66.72 | 11.1 |
| Procuring using the capitation fund via e-purchasing scheme | 3612 | 36.74 | 67.92 | 10.61 |
| Procuring using the capitation fund through direct purchasing | 5229 | 53.19 | 67.21 | 10.88 |
| Note for medicine in and out in 2018 | 9343 | 95.04 | 66.56 | 11.02 |
| Apply FIFO and FEFO methods | 9036 | 91.91 | 66.86 | 10.77 |
| Reporting rational use of medicines | 8430 | 85.75 | 67.10 | 10.72 |
| Sources of medicine—only DHO procurements | 5665 | 57.62 | 64.85 | 12.09 |
| Able to use the capitation fund | 8437 | 85.82 | 66.45 | 11.38 |
| Independent procurement of medicines using a capitation fund | 3625 | 36.87 | 66.74 | 11.22 |
| Make independent medicine needs plan (Rencana Kebutuhan Obat) | 9237 | 93.96 | 66.46 | 11.17 |
| All medicines were from the PHC procurement | 150 | 1.53 | 64.23 | 11.89 |
| Accessibility, financial and demographical determinants | ||||
| PHC type | ||||
| Remote/very remote (reference) | 2192 | 22.30 | 62.57 | 13.75 |
| Rural | 4663 | 47.43 | 67.15 | 11.08 |
| Urban | 2976 | 30.27 | 67.02 | 9.86 |
| District level | ||||
| Local pharmaceutical systems | ||||
| Managing human and physical resources | ||||
| Having a pharmacist as the PIC at district warehouses | 8082 | 82.21 | 66.29 | 11.53 |
| Availability of pharmacist staff | 8864 | 90.16 | 66.08 | 11.52 |
| Having a staff with a pharmacy background as the PIC at the district warehouses | 8568 | 87.15 | 66.22 | 11.58 |
| Financing | ||||
| Financial resources for the medicine procurements—national fund | 9162 | 93.19 | 66.22 | 11.6 |
| Financial resources for the medicine procurements—provincial fund | 1090 | 11.09 | 69.2 | 11.47 |
| Financial resources for the medicine procurements—local fund | 4149 | 42.2 | 67.31 | 11.11 |
| Financial resources for the medicine procurements—capitation | 2515 | 25.58 | 66.4 | 12.29 |
| Managing pharmaceutical product supply | ||||
| Conduct medicine quantification | 9550 | 97.14 | 66.09 | 11.63 |
| Procurement schemes—national e-catalogue platform | 9241 | 94.00 | 66.29 | 11.43 |
| Procurement schemes—local auction | 4337 | 44.12 | 66.75 | 11.77 |
| Procurement schemes—local direct purchasing | 4635 | 47.15 | 67.38 | 11.28 |
| Implement procurement medicine policy: over 2 years of date expiration | 9316 | 94.76 | 66.15 | 11.51 |
| All medicines procured with policy: over 2 years of date expiration | 6416 | 65.26 | 65.83 | 11.74 |
| Waiting time for medicine procurement is less than 1 month | 2356 | 23.97 | 67.12 | 10.95 |
| Accessibility, financial and demographical determinants | ||||
| District type | ||||
| Rural | 8131 | 82.71 | 66.08 | 11.93 |
| Urban | 1700 | 17.29 | 66.14 | 9.54 |
| Percentile of the total district expenditure | ||||
| Quartile 1 | 1292 | 13.14 | 62.85 | 12.14 |
| Quartile 2 | 1324 | 13.47 | 64.15 | 12.19 |
| Quartile 3 | 1688 | 17.17 | 64.44 | 12.22 |
| Quartile 4 | 2144 | 21.81 | 68.23 | 11.36 |
| Quartile 5 | 3383 | 34.41 | 67.55 | 10.25 |
| Percentile of district population | ||||
| Quartile 1 | 1127 | 11.46 | 60.73 | 14.31 |
| Quartile 2 | 1241 | 12.62 | 64.62 | 12.03 |
| Quartile 3 | 1731 | 17.61 | 65.30 | 11.73 |
| Quartile 4 | 2136 | 21.73 | 67.06 | 10.97 |
| Quartile 5 | 3596 | 36.58 | 68.08 | 9.92 |
| District fiscal capacity | ||||
| Low and very low | 3535 | 35.96 | 63.66 | 12.48 |
| Medium | 2315 | 23.55 | 67.79 | 11.52 |
| High and very high | 3981 | 40.49 | 67.26 | 10.28 |
| Located on a separate island from its provincial capital | 1267 | 12.89 | 63.41 | 13.37 |
| Provincial level | ||||
| Accessibility, financial and demographical determinants | ||||
| Region | ||||
| Eastern Indonesia | 1215 | 12.36 | 60.12 | 14.59 |
| Sumatera | 2547 | 25.91 | 65.06 | 11.48 |
| Borneo, West Nusa Tenggara, Sulawesi | 2373 | 24.14 | 65.89 | 11.04 |
| Java and Bali | 3696 | 37.60 | 68.89 | 9.77 |
| Provincial fiscal capacity | ||||
| Low and very low | 2661 | 27.07 | 64.57 | 12.2 |
| Medium | 2299 | 23.39 | 66.53 | 10.53 |
| High and very high | 4871 | 49.55 | 66.71 | 11.57 |
| Univariable | Multilevel | Spatial autocorrelation | ||||
|---|---|---|---|---|---|---|
| B | CI | B | CI | B | CI | |
| PHC level | ||||||
| Local pharmaceutical systems | ||||||
| Managing human and physical resources | ||||||
| The availability of pharmacists | 2.43*** | (2.16 to 2.70) |
|
| ||
| The availability of medicine shelves | 1.03*** | (0.80 to 1.26) | 0.31 | (−0.44 to 1.06) | −0.10 | (−0.90 to 0.70) |
| Perceived of a sufficient number of shelves | 4.75*** | (4.14 to 5.36) | −0.16 | (−0.36 to 0.04) | −0.15 | (−0.36 to 0.06) |
| The availability of lighting | 2.74*** | (2.32 to 3.16) |
| 0.41 | (−0.02 to 0.85) | |
| The availability of the guidelines of medicine and medical product services | 2.99*** | (2.67 to 3.31) |
|
| ||
| The availability of the guidelines for preparing and dispensing medicine concoction prescription | 3.59*** | (3.24 to 3.95) |
|
| ||
| Inpatient services | 2.24*** | (2.01 to 2.46) |
|
| ||
| Accredited | 3.52*** | (3.26 to 3.78) |
|
| ||
| Financing | ||||||
| Receiving district government fund | 1.61*** | (1.37 to 1.85) | −0.01 | (−0.27 to 0.25) | −0.08 | (−0.29 to 0.14) |
| Receiving retribution from patients | 0.89*** | (0.65 to 1.13) |
|
| ||
| Receiving a non-capitation fund from the National Health Insurance Agency | 2.50*** | (2.26 to 2.74) |
|
| ||
| Having Independent financial autonomy | 2.68*** | (2.45 to 2.92) | 0.02 | (−0.33 to 0.36) | 0.20 | (−0.03 to 0.44) |
| Monitoring performance | ||||||
| Having an online Puskesmas Management Information System (SIMPUS) | 1.46*** | (1.22 to 1.69) | 0.20 | (−0.02 to 0.43) | 0.10 | (−0.13 to 0.32) |
| Managing pharmaceutical product supply | ||||||
| Implementing Back-Referral Programme (PRB) | 2.08*** | (1.78 to 2.38) |
|
| ||
| The availability of medicine use and ordering a monthly report (LPLPO) | 3.88*** | (2.79 to 4.96) |
|
| ||
| The completeness of LPLPO | 3.28*** | (2.75 to 3.80) | 0.26 | (−0.24 to 0.76) | 0.36 | (−0.16 to 0.88) |
| Implementing DRP planning for an 18-month period | 1.29*** | (1.03 to 1.55) |
| 0.20 | (−0.04 to 0.43) | |
| Sources of medicine—combining DHO & PHC procurements | 1.54*** | (1.31 to 1.77) |
|
| ||
| Achieving the volume target | 0.90*** | (0.66 to 1.14) | 0.05 | (−0.16 to 0.25) |
| |
| Procuring using capitation fund via the e-purchasing scheme | 1.45*** | (1.21 to 1.68) |
|
| ||
| Procuring using capitation fund through a direct purchasing | 1.20*** | (0.97 to 1.42) |
|
| ||
| Note for medicine in and out in 2018 | 4.73*** | (4.21 to 5.24) | 0.23 | (−0.39 to 0.84) | 0.47 | (−0.18 to 1.12) |
| Apply FIFO and FEFO methods | 4.74*** | (4.33 to 5.15) |
|
| ||
| Reporting rational use of medicines | 3.56*** | (3.24 to 3.88) |
|
| ||
| Accessibility, financial and demographical determinants | ||||||
| PHC type | ||||||
| Remote/very remote | ||||||
| Rural | 2.29*** | (2.00 to 2.58) | 0.27 | (−0.04 to 0.58) | 0.07 | (−0.24 to 0.37) |
| Urban | 2.23*** | (1.91 to 2.54) |
| 0.26 | (−0.12 to 0.63) | |
| Distance between PHC and its district capital point | −0.01*** | (−0.01 to −0.00) | 0.00 | (−0.00 to 0.00) | 0.00 | (−0.00 to 0.00) |
| Distance between PHC and the nearest PHC | −0.00 | (−0.00 to 0.00) | −0.00 | (−0.00 to 0.00) | −0.00 | (−0.00 to 0.00) |
| District level | ||||||
| Local pharmaceutical systems | ||||||
| Managing human and physical resources | ||||||
| Having a pharmacist as the PIC at district warehouses | 0.58*** | (0.28 to 0.88) | 0.12 | (−0.47 to 0.70) | −0.12 | (−0.39 to 0.14) |
| Financing | ||||||
| Financial resources for the medicine procurements—national fund | 0.96*** | (0.50 to 1.41) | 0.23 | (−1.00 to 1.45) | 0.14 | (−0.42 to 0.69) |
| Financial resources for the medicine procurements—provincial fund | 1.75*** | (1.39 to 2.11) |
|
| ||
| Financial resources for the medicine procurements—local fund | 1.06*** | (0.83 to 1.29) | −0.34 | (−0.86 to 0.18) | −0.15 | (−0.37 to 0.08) |
| Managing pharmaceutical product supply | ||||||
| Conduct medicine quantification | 0.03 | (−0.65 to 0.72) |
|
| ||
| Procurement schemes—e-catalogue | 1.68*** | (1.20 to 2.16) | −1.05 | (−2.41 to 0.31) |
| |
| Procurement schemes—local auction | 0.59*** | (0.36 to 0.82) |
|
| ||
| Procurement schemes—local direct purchasing | 1.23*** | (1.00 to 1.45) | 0.48 | (−0.03 to 0.98) |
| |
| Implement procurement medicine policy: over 2 years of date expiration | 0.63* | (0.12 to 1.14) | 0.73 | (−0.36 to 1.81) | 0.36 | (−0.13 to 0.84) |
| All medicines procured with policy: over 2 years of date expiration | −0.37** | (−0.61 to −0.13) | −0.16 | (−0.68 to 0.37) | −0.04 | (−0.26 to 0.19) |
| Waiting time for medicines is less than 1 month | 0.68*** | (0.41 to 0.94) | 0.03 | (−0.57 to 0.62) | 0.23 | (−0.03 to 0.49) |
| Medicine availability at the DHO level | ||||||
| The availability of 50 medicines | 0.15*** | (0.13 to 0.16) |
|
| ||
| Accessibility, financial and demographical determinants | ||||||
| District type | ||||||
| Rural | ||||||
| Urban | 0.03 | (−0.27 to 0.33) | −0.65 | (−1.45 to 0.15) |
| |
| Percentile of the total district expenditure | ||||||
| Quartile 1 | ||||||
| Quartile 2 | 0.65** | (0.21 to 1.08) | 0.63 | (−0.17 to 1.42) | 0.27 | (−0.14 to 0.68) |
| Quartile 3 | 0.79*** | (0.38 to 1.21) | 0.23 | (−0.61 to 1.08) | 0.05 | (−0.36 to 0.46) |
| Quartile 4 | 2.69*** | (2.30 to 3.08) | 0.47 | (−0.46 to 1.40) | 0.33 | (−0.11 to 0.77) |
| Quartile 5 | 2.35*** | (1.99 to 2.72) | −0.93 | (−2.09 to 0.23) |
| |
| Percentage of subsidised JKN insurance participants | −0.03*** | (-0.03 to −0.02) | −0.01 | (−0.03 to 0.01) |
| |
| District fiscal capacity | ||||||
| Low and very low | ||||||
| Medium | 2.06*** | (1.76 to 2.36) | 0.42 | (−0.25 to 1.10) |
| |
| High and very high | 1.80*** | (1.54 to 2.06) | 0.69 | (−0.19 to 1.57) |
| |
| Separated from the provincial capital | −1.54*** | (−1.88 to −1.20) | 0.01 | (−0.00 to 0.03) | −0.00 | (−0.01 to 0.01) |
| Accessibility score to other dispensing points | 0.06*** | (0.05 to 0.06) | 0.20 | (−0.60 to 1.00) | −0.29 | (−0.64 to 0.07) |
| Provincial level | ||||||
| Accessibility, financial and demographical determinants | ||||||
| Region | ||||||
| Eastern Indonesia | ||||||
| Sumatera | 2.47*** | (2.09 to 2.85) | 0.90 | (-0.52 to 2.31) | 0.28 | (−0.20 to 0.77) |
| Borneo, West Nusa Tenggara, Sulawesi | 2.88*** | (2.50 to 3.27) | 0.79 | (−0.60 to 2.19) | 0.05 | (−0.41 to 0.50) |
| Java and Bali | 4.39*** | (4.02 to 4.75) | 1.47 | (−0.19 to 3.13) |
| |
| Percentage of health expenditure from total expenditure | 0.19*** | (0.16 to 0.22) | −0.01 | (−0.13 to 0.11) | 0.00 | (−0.03 to 0.03) |
| Provincial fiscal capacity | ||||||
| Low and very low | ||||||
| Medium | 0.98*** | (0.66 to 1.30) | −0.07 | (−1.05 to 0.91) | −0.23 | (−0.53 to 0.07) |
| High and very high | 1.07*** | (0.80 to 1.34) | 0.19 | (−0.86 to 1.23) | −0.12 | (−0.43 to 0.20) |
| Spatial lag | 0.00*** | (0.00 to 0.00) | ||||
| AIC change in multilevel | R2 change in spatial autocorrelation | |||||||
|---|---|---|---|---|---|---|---|---|
| Dimension only | Excl. dimension | Dimension only | Excl. dimension | |||||
| Actual value | The changes | Actual value | The changes | Actual value | The changes | Actual value | The changes | |
| Level of data | ||||||||
| Full model: all dimensions | 57 922 | 29.5% | ||||||
| Primary health centres level | 58 024 | +102 (+0.18%) | 58 847 | +925 (+1.6%) | 26.3% | −3 (−10.85%) | 22.7% | −7 (−23.05%) |
| District level | 58 843 | +921 (+1.59%) | 58 031 | +109 (+0.19%) | 22.3% | −7 (−24.41%) | 26.4% | −3 (−10.51%) |
| Provincial level | 58 964 | +1042 (+1.8%) | 57 914 | +−8 (−0.01%) | 19.0% | −11 (−35.59%) | 24.5% | −5 (−16.95%) |
| Local Pharmaceutical System | 58 016 | +94 (+0.16%) | 58 919 | +997 (+1.72%) | 29.1% | 0 (−1.36%) | 20.1% | −9 (−31.86%) |
| Primary health centres | 58 025 | +103 (+0.18%) | 58 814 | +892 (+1.54%) | 26.3% | −3 (−10.85%) | 22.8% | −7 (−22.71%) |
| Managing physical and human resources | 58 422 | +500 (+0.86%) | 58 229 | +307 (+0.53%) | 24.2% | −5 (−17.97%) | 26.8% | −3 (−9.15%) |
| Financing | 58 877 | +955 (+1.65%) | 57 942 | +20 (+0.03%) | 20.0% | −10 (−32.2%) | 29.4% | 0.1 (−0.34%) |
| Monitoring and evaluation | 58 963 | +1041 (+1.8%) | 57 923 | +1 (+0%) | 17.7% | −12 (−40%) | 29.5% | 0 (0.00%) |
| Managing supply chain | 58 401 | +479 (+0.83%) | 58 270 | +348 (+0.6%) | 22.5% | −7 (−23.73%) | 28.1% | −1 (−4.75%) |
| District health offices | 58 869 | +947 (+1.63%) | 58 036 | +114 (+0.2%) | 20.0% | −9 (−32.2%) | 26.9% | −3 (−8.81%) |
| Managing physical and human resources | 58 967 | +1045 (+1.8%) | 57 920 | −2 (+0.00%) | 17.3% | −12 (−41.36%) | 28.8% | −1 (−2.37%) |
| Financing | 58 966 | +1044 (+1.8%) | 57 922 | +0 (+0.00%) | 17.8% | −12 (−39.66%) | 29.4% | 0 (−0.34%) |
| Managing supply chain | 58 958 | +1036 (+1.79%) | 57 937 | +15 (+0.03%) | 17.9% | −12 (−39.32%) | 28.8% | −1 (−2.37%) |
| Medicine availability—DHO | 58 854 | +932 (+1.61%) | 58 024 | +102 (+0.18%) | 18.8% | −11 (−36.27%) | 27.5% | −2 (−6.78%) |
| Accessibility, financial and demographical determinants | 58 919 | +997 (+1.72%) | 58 016 | +94 (+0.16%) | 20.1% | −9 (−31.86%) | 29.1% | −0.4 (−1.36%) |
| Primary health centres level | 58 929 | +1007 (+1.74%) | 57 922 | +0 (+0.00%) | 18.2% | −11 (−38.31%) | 29.5% | 0 (0.00%) |
| District level | 58 946 | +1024 (+1.77%) | 57 921 | −1 (0.00%) | 19.6% | −10 (−33.56%) | 29.1% | −0.4 (−1.36%) |
- —http://dx.doi.org/10.13039/501100017022Ministry of Health of the Republic of Indonesia
- —http://dx.doi.org/10.13039/501100014538Lembaga Pengelola Dana Pendidikan
Peer Reviews
No public reviews on file for this paper yet. If you reviewed it on a platform where reviews are public (OpenReview, ICLR, NeurIPS, ICML), you can paste yours below so the community can read it here.
Videos
No videos yet. Explain this paper in a talk, walkthrough, or lecture? Add one.
Taxonomy
TopicsPharmaceutical Economics and Policy · Pharmaceutical Quality and Counterfeiting · Healthcare Systems and Reforms
Introduction
Around the world, many countries struggle to provide access to medicine to their population. Studies consistently reveal considerable disparities in medicine availability between different regions within countries.1 2 These local variations exacerbate inequalities, as medication availability is often higher in richer urban areas and lower in rural and remote areas, where residents typically have lower incomes and more limited access to healthcare.36 Limited availability of medicines, combined with high prices, poses significant risks to patients’ health by increasing the likelihood of untreated conditions, suboptimal care and inflated healthcare costs. Furthermore, the scarcity of medicines in public facilities often drives patients to seek alternatives from private, unregulated sources, which raises the risk of exposure to expensive, expired or falsified medications.711
Previous studies indicate that several factors influence the availability of essential medicines. These include infrastructural, geographical, socioeconomic aspects, as well as the organisation of the health and pharmaceutical systems.12 13 Poor road conditions, limited transportation options and long travel times can significantly hinder access to medicines. Additionally, geographical and political challenges—such as rurality, distance from distribution points, poor governance and insecurity—are well-documented barriers to maintaining a consistent supply of essential medicines.14 In contrast, effective procurement, proper storage and dispensing practices, well-trained personnel, real-time monitoring, transparent funding mechanisms and a strong health and pharmaceutical system significantly enhance access to medicines.15 16
One of the countries striving to improve access to essential medicine in public facilities is Indonesia, the world’s fourth most populus nation. Indonesia faces a unique set of challenges. The geographic, social and economic diversity of this vast archipelago country is exceptional.17 More than half of its population of 270 million people are squeezed into Java Island, just the 6% of the land mass.18 The other 120 million citizens are scattered across some other 7000 islands, spread out over the area of 5.1 million square kilometres.19 While fiscal capacity of districts in Java tends to be classified as high and very high, the others, especially rural districts in Eastern Indonesia, were mostly classified as low and very low.20
Indonesia has managed to sign up 98% of its population for its mandatory national health insurance scheme, which promises free access to essential medicines in public facilities.17 21 Primary health centres (PHCs) play a key role in providing health services and ensuring access to medicines. There are over 10 000 PHCs, which are strategically located throughout the archipelago and are the most accessible health service points for the population.22 23 A recent study indicates that while the availability of the 17 most-needed essential medicines in PHCs is relatively high at 82%, the availability drops to 58% when considering a broader selection of 60 essential medicines.18 24
A major concern is the significant variation in medicine availability across the country. Medicine stockouts are most frequently reported in more remote and peripheral areas in Indonesia, especially in the rural districts in the east, where the population tends to have the lowest income and highest health need, and access to complementary medicine dispensing points, such as hospitals and drug stores, is also most limited.25
To reduce the stark local variation and improve access to medicines across Indonesia, analysts should not only focus on national policies and regulations but also examine the local factors that shape medicine availability. Indonesia has 514 district health offices (DHOs), which play a key role in allocating staff, such as pharmacists, and in managing the supply of medicines to (PHCs).26 27 DHOs procure, store and distribute medicines to PHCs within their districts. Large PHCs classified as financially independent are permitted to procure their own medicines, while other PHCs may do so only in emergency situations and with DHO approval.
Several aspects of DHOs and PHCs can influence their capacity to manage pharmaceutical supplies, including the availability of trained personnel, adequate facilities, transportation capacity, sufficient funding and effective monitoring systems. A core idea underpinning this study is that these interrelated local factors collectively form and function as a Local Pharmaceutical System (LOPHAS), which is inspired by the existing conceptual framework of a pharmaceutical system.1 2 28 A local pharmaceutical system comprises the people, structures, resources, practices and interactions at the subnational level that contribute to ensuring access to medicines, promote their appropriate use and support the delivery of health services that improve health outcomes.28 In Indonesia, these local systems encompass community-level, health facility-level and district-level entities that operate within the broader national health and pharmaceutical system.
Local circumstances, including health needs, the socioeconomic situation and logistical and geographical factors, are also related to the local availability of medicines. Local differences in health needs, health insurance coverage, income levels and poverty rates directly influence the demand for medicines. Logistical factors also differ for different areas, including the travel time, infrastructure quality and the need to cross the sea to travel to another island.29
Although multiple factors influence the performance of local pharmaceutical systems, it remains unclear which are most critical for ensuring access to medicines. Generating new insights into the key drivers of medicine availability is essential for guiding interventions, targeting investments, improving access, reducing inequalities and advancing understanding of effective strategies to achieve universal access to medicines in a large, diverse and decentralised nation.
In this study, we assess the availability of essential medicine in PHCs in Indonesia and analyse the local pharmaceutical, health system, socioeconomic and geographical indicators driving variation in medicines availability. In 2019, enumerators visited each of the 514 DHOs and 9831 PHC to conduct a health facility assessment and collect data on the availability of essential medicines. We analysed the availability of 50 essential medicines and explored its relationship with the organisation of the local pharmaceutical system, health insurance coverage, district fiscal capacity, health expenditure and demographic and geographical indicators, such as the distance to the district capital. Since the PHCs are nested within districts and provinces, we conducted a multilevel analysis. To gain insight into the geographical clustering of medicines availability, we also performed a spatial autocorrelation analysis.
Methods
This article presents the results of a nationwide health facility survey, for which enumerators visited all 514 district health offices and all primary health centres (Pusat Kesehatan Masyarakat) across Indonesia. The 2019 cross-sectional survey, named Riset Fasilitas Kesehatan (Rifaskes), was organised by the Indonesian National Institute of Health Research and Development (Balitbangkes), with technical guidance and support from academic experts. For our analysis, we combined this with additional data regarding district characteristics related to accessibility, financial and demographical determinants and geographical and spatial information, which were derived from four other datasets. These are (1) the fiscal capacity map of Indonesian provinces and districts, (2) local government expenditures data containing provinces and districts, (3) health insurance coverage per district and (4) village potential survey.30 31 A detailed description of the Local Pharmaceutical Systems (LOPHAS) approach and framework can be found in online supplemental figure 1 and online at: https://dataverse.harvard.edu/dataverse/Local_Pharmaceutical_System.
Sample size and data collection
The data in the Rifaskes study were gathered on site from all 514 DHOs and 9909 PHCs in Indonesia. We included all registered PHCs that were listed as active at the start of 2019 and were functioning as PHCs when physically reached by the enumerators (n=9831 PHCs).
Data collection and management
The data collection began with a pilot phase in Cirebon District, West Java. The pilot phase was led by staff of the Ministry of Health, who later participated as field coordinators at the provincial level.
Data collectors interviewed the PHC staff with a paper-based structured questionnaire and submitted the data through the Redcap online platform. To control the quality of data collection, the field coordinators provided daily supervision and regularly checked the performance of each enumerator. Field coordinators checked the data and ensured that data in the system matched the paper questionnaire. The electronic data were stored at the data management unit at the National Institute for Health Research and Development. Data were ready to be used in 2021 after compiling them in 2020. More details about the research method have been published in the Rifaskes report.32
The additional datasets were derived from two ministry data repositories and the Indonesian statistics agency. The data about PHCs’ characteristics were derived from the Ministry of Health, and data about fiscal capacity of districts and provinces and local government expenditure were obtained from the Ministry of Finance.
Spatial data concerning the euclidean distance (km) from each PHC to the district capital, provincial capital and nearest PHC were calculated using QGIS software based on latitude and longitude coordinates.
All data were merged before being statistically analysed using district and province codes provided by the Ministry of Home Affairs. We had 36 observations with missing values. These cases were excluded from the analyses through listwise deletion. Given the small number of missing observations, we believe that their exclusion did not have a substantial effect on our results.
Variables
Our main outcome variable was the availability of 50 essential medicine availability at DHOs and PHCs. The selection of these 50 medicines was guided by the WHO’s Service Availability and Readiness Assessment (SARA) instrument and finalised in consultation with the Indonesian Ministry of Health. Medicines that are only relevant in specific regions, such as antimalarials, were excluded to ensure national applicability. Enumerators visited PHCs and DHOs and physically verified the presence of each of the 50 selected essential medicines at the facility. A medicine was considered available if a full course for at least one patient was present in the facility’s pharmacy at the time of the visit. The outcome variable was then calculated as the percentage of the 50 essential medicines that were available at each facility. In alignment with Indonesia’s national medicine policy, two pairs of medicines were treated as therapeutically substitutable: glibenclamide and metformin (oral antidiabetic agents), and furosemide and hydrochlorothiazide (HCT) (antihypertensive/diuretic agents). For each pair, the presence of at least one of the two medicines was considered sufficient to indicate availability within the respective therapeutic category.
To determine which variables are associated with medicine availability, we used the local pharmaceutical system approach and adapted it to the Indonesian context. We focused our analysis on four core system components (1) managing human and physical resources, (2) financing, (3) monitoring performance and (4) managing pharmaceutical supply. We evaluated the functioning of these core components and their impact on the availability of medicines in PHCs. Our analysis also considered other external factors, including demographic, social and geographic characteristics.33 Online supplemental table 1 shows all covariates and their operational definitions.
Statistical analyses
We started the analysis by inspecting the outcome variable. The medicine availability variable was normally distributed (c.f. figure 1). For each covariate, we calculated the mean and SD of the outcome. For numerical covariates, we presented the median and IQRs. We continued our statistical analysis in three steps.
Distribution of the medicine availability in primary health centres in Indonesia in 2019.
The first step is selecting covariates based on the multivariable analyses within subdimensions. Covariates were tested for multicollinearity prior to model building, covariates with a significant correlation coefficient beyond 0.8 were excluded. Next, separate multivariable models were built for each subdimension. Using a backward selection process, we removed variables from the model that were not statistically significant at the 5% level. The remaining variables were included in the full models. We presented the univariable and multivariable results (crude model).
In the second step, we considered two different methods to account for the dependency of medicine availability between PHCs: (1) by fitting a multilevel model with a random intercept on province and district level, and (2) by fitting a spatial lag model using the average medicine availability of two nearest neighbouring PHCs. We first investigated the strength and scale of spatial autocorrelation in medicine availability by computing the Moran’s I statistic at various district bands. We then tested the residuals of the multilevel model and the spatial-lag model for spatial autocorrelation to ensure that the models accounted for the spatial dependency in medicine availability. We compared the fit of the crude model, the multilevel model and the spatial lag model based on the Akaike information criterion (AIC) and R-squared (R^2^). The residuals and predictions of both models were visualised to ensure assumptions of linear regression analyses hold (online supplemental figure 2).
In the final step, we assessed the contribution of each subdimension of the LOPHAS framework to the multilevel and spatial models. This was done by removing all variables from a single subdimension (eg, financing) from the models and evaluating the change in R^2^ and AIC.
The descriptive and regression analyses were performed using Stata version 18. The assessment of spatial autocorrelation was performed using GeoDa version 1.12.
Patient and Public Involvement
Patients or the public were not involved in the design, or conduct, or reporting, or dissemination plans of our research.
Results
We start with our descriptive analysis. Next, we present the analysis of spatial autocorrelation. We then present the statistical results of multilevel and spatial lag models. Our investigations of collinearity and multivariable analyses within subdimension result in 50 covariates that can be used for the statistical analyses.
Descriptive analyses
On average, 66% of the 50 essential medicines were available in the PHCs as presented in figure 1. Table 1 illustrates the availability of medicines in PHCs, taking into account 58 covariates with nominal and ordinal scales. The numerical covariate descriptions can be found in online supplemental table 2. They represent the characteristics of PHCs, DHOs and district contexts. The result of the multivariable analysis can be found in online supplemental material 2.
Spatial Autocorrelation
The medicine availability of a PHC tends to be similar to its neighbours. Online supplemental figure 3 presents Moran’s I statistic across various distance bands and shows Moran’s I value of 0.34 and p value of <0.05, indicating that the availability of medicines is spatially clustered. Spatial autocorrelation was highest for PHCs within 2 km of one another (Moran’s I: 0.67), indicating that PHCs in close vicinity of one another have similar levels of medicine availability as presented in figure 2 and online supplemental figure 4.
The map of a hotspot analysis to identify clusters of medicine availability at the PHC level in Indonesia. PHC, primary health centre.
Regression models
The multilevel and spatial lag models are presented in table 2. These models provide a better fit compared with the crude model based on the AIC and R2. They also account for all spatial autocorrelation.
At the PHC level, both models provide similar results. There are 16 variables which matter to the availability of medicines at the PHC level in three subdimensions of the local pharmaceutical system. For example, increased capacity for managing human and physical resources (eg, with pharmacists, lighting, guidelines, inpatient service and being accredited) was associated with a higher availability of essential medicines (coefficients range from 0.42 to 1.47). In addition, better managing the medicine supply chain (eg, with the availability of the monthly medicine reports, ability to use capitation fund and medicine management techniques) was also positively associated with medicine availability. Furthermore, in the multilevel model, urban PHCs were associated with a slightly higher medicine availability as compared with remote PHCs, but this association was not significant in the spatial lag model.
At the district level, various covariates describing the management of the supply chain are associated with medicine availability in PHCs, such as procuring medicines via a local auction, which had a positive coefficient. In addition, a higher availability of medicines at the DHO level is also associated with a higher medicine availability at the PHC level.
The main difference between the two models is that covariates such as the type of district, the percentage of subsidised National Health Insurance participants and fiscal capacity are associated with medicine availability in the spatial lag model, but not in the multilevel model.
At the provincial level, only the region variable was associated with medicine availability at the PHC level. There was an 8.8% disparity in medicine availability between PHCs in Eastern Indonesia and those on the Java-Bali region in the descriptive table. The spatial autocorrelation analysis affirms this difference with B: 0.67, CI 0.08 to 1.26.
The contribution of the subdimensions
Table 3 shows the contribution of each subdimension and in each system tier to the multilevel and spatial lag models. Variation in medicine availability is explained most by variation in PHC level covariates, followed by district and then provincial level.
Determinants of the local pharmaceutical system (with the AIC 58016 and R-square 29.1 %) explain more variations in medicine availability than the accessibility, financial and demographic determinant (with the AIC 58919 and R-square 20.1 %). Within the local pharmaceutical system, managing human and physical resources at the PHC level and medicine availability at the DHO level explain more variations compared with the other subdimensions.
Discussion
This study investigates the factors driving variation in essential medicine availability across primary health facilities in Indonesia, with a focus on the performance of local pharmaceutical systems and the impact of socioeconomic and geographical factors. Our findings reveal substantial disparities in medicine availability between districts. On average, only 66% of the 50 essential medicines surveyed were available in PHCs, with district-level availability ranging from 83% in the best-performing areas to just 43% in the lowest-performing ones. A strong correlation emerged between the availability of medicines at DHOs and the stock levels in PHCs within their jurisdiction. PHCs that demonstrated stronger management of human and physical resources consistently reported higher medicine availability. Furthermore, effective supply chain management at the PHC level—marked by regular medicine reporting, strategic use of capitation funds and the application of inventory management techniques—was significantly associated with improved medicine availability. These results highlight the critical role of local pharmaceutical systems in ensuring equitable access to essential medicines.
The substantial variation in medicine availability across districts in Indonesia is consistent with findings from other countries. Similar disparities have been observed in India, where availability ranged from 43% in Bihar to 88% in Tamil Nadu3; in China, with higher availability in the Eastern region compared with the central and western regions34; and in Brazil, where the Southeast region had up to 14% higher availability than the North and Northeast.35 These local differences highlight significant regional inequalities, emphasising the need to look beyond national indicators for medicine availability and conduct local assessments of medicine access. Beyond identifying local differences, our study contributes to the understanding of factors influencing these variations by examining both the organisation of the pharmaceutical system and the local circumstances.
The system component that is most strongly related to medicine availability is the management of human and physical resources, and especially the presence of a pharmacist. PHCs with a pharmacist had a significantly higher medicine availability compared with those without. In Indonesia, approximately 20% of PHCs operate without a pharmacist, a shortage that is particularly problematic in rural and remote areas. In the absence of a pharmacist, other staff—such as assistant pharmacists or nurses—step in to manage medicines, sometimes with support from a pharmacist at another PHC. These other professionals are not trained to make decisions on dispensing medicines, which may impact the quality of pharmaceutical services.
Our findings suggest that having a pharmacist in every PHC not only improves medication dispensing practices but also enhances medicine availability. However, increasing the number of pharmacists in remote PHCs remains a significant challenge.36 Studies from Indonesia and other regions indicate that pharmacists are often reluctant to work in these areas due to geographical isolation, inadequate infrastructure and lower living standards.37 In contrast, urban settings provide better opportunities for professional growth and additional income.38 Addressing these challenges requires a comprehensive approach, including improving working conditions and collaborating with health and non-health sector authorities to make rural placements more appealing.37
The availability of essential medicines was positively associated with procurement and storage practices. PHCs with the flexibility to use their own capitation funding for medicine procurement maintained higher stock levels than those relying solely on district health office supplies. This highlights the potential benefits of granting PHCs greater autonomy in procurement. In 2023, the Indonesian government reformed its procurement policy, allowing public healthcare facilities more flexibility to source medicines directly from suppliers. Monitoring the impact of this policy on medicine availability will be crucial, as fragmented procurement may lead to higher cost. Particular attention should be given to remote areas, where fragmented demand, high distribution costs and low order volumes could drive up prices and exacerbate shortages.21 26
We also found that medicine availability is positively associated with the use of inventory management principles, such as First-Expired, First-out (FEFO) and First-In, First-out (FIFO). In Indonesia’s pharmaceutical supply chain, FEFO is the preferred method for managing medicine stocks, as it helps to ensure that expired products do not reach patients. Its implementation is seen as critical for minimising waste, ensuring patient safety and maintaining regulatory compliance. Our finding, that the use of these methods is also associated with higher medicine availability, is consistent with a recent study in Ethiopia, which also showed a link between availability and these inventory management principles.39 In Indonesia, the use of FEFO principles should be combined with the use of a digital inventory management system, named LPLPO (Laporan Pemakaian dan Lembar Permintaan Obat), which is also associated with higher medicine availability. Together, FEFO principles and LPLPO inventory management can help prevent shortages and waste. To truly benefit from these systems, the health sector needs to address challenges such as manual reporting, logistics issues and limited digital integration.
A key component of effective pharmaceutical services is promoting the rational use of medicines. While our study did not assess actual dispensing practices, our analysis shows that reporting on rational medicine use is associated with higher medicine availability. This finding may reflect the clustering of various aspects of good pharmaceutical practice at the local level. These patterns need to be explored further in qualitative studies and could perhaps be a starting point for developing interventions aimed at improving pharmaceutical practices.40
Our study found that essential medicine availability in PHCs was closely tied to the availability at DHOs. Districts with more proactive DHOs that employed a variety of purchasing channels generally had better medicine availability. In contrast, DHOs relying on a single procurement strategy often faced shortages, leaving health facilities and communities without essential medicines. Additionally, districts experiencing frequent payment delays tended to have lower medicine availability, likely due to reduced supplier willingness to deliver medicines. These findings highlight the need to strengthen the capacity of DHOs in managing pharmaceutical supply chains. Special attention should be given to improving supply chains in remote districts and PHCs, which are particularly prone to shortages.26 Pooling procurement for these areas could be an effective strategy, as increasing order volumes may make distribution more attractive to suppliers.41 42
Our analysis reveals that medicine availability is shaped not only by the district health office but also by local clustering patterns among PHCs. This local clustering of medicine availability was significant. We found clusters of PHCs in Java Island with low medicine availability, and clusters in relatively poor parts of East Nusa Tenggara, Sumatra and Maluku provinces with high medicine availability. This clustering, observed within a few kilometres, appears to be driven by two key factors. First, nearby PHCs may collaborate by sharing stock during shortages or referring patients to other facilities for specific health programmes.26 Second, medicine distribution may be influenced by established supply routes, contributing to the observed clustering. These findings highlight the significance of local dynamics in determining medicine availability, suggesting that interventions aimed at improving access should consider localised strategies. Further research is needed to evaluate the extent of stock-sharing practices and identify ways to optimise them for enhanced medicine availability.
Our findings highlight the need to consider local systems and contextual factors when aiming to improve access to medicines. This observation is in line with a recent study in Afghanistan, which used the same LOPHAS framework and methodology, revealing that variations in medicine availability were less affected by the security situation and more by the type of organisation managing healthcare, with non-governmental organisations (NGOs) generally performing better than local government entities.6
Policy implications
Given Indonesia’s vast size and regional diversity, it is worth questioning whether a single national essential medicines list is suitable for all districts across the archipelago. Currently, Indonesians enrolled in the National Health Insurance Scheme are entitled to free access to nearly 300 medicines through their PHCs. Our results show that even among the 50 most commonly used medicines, a significant number are frequently unavailable. This inconsistency generates uncertainty for both patients and healthcare providers, undermines trust in the public healthcare system and often compels patients to seek medicines from alternative sources, increasing their risk of exposure to costly, expired, substandard or even falsified medicines.43 44
One potential strategy to improve access to medicines is to streamline the list of promised medicines, focusing on a smaller, more manageable selection that can be consistently supplied. By narrowing the scope, health systems can allocate resources more effectively, ensuring reliable availability of essential medicines rather than overpromising and underdelivering. In parallel, increasing the number of PHCs staffed with qualified pharmacists can directly enhance medicine availability, as pharmacists play a critical role in inventory management, procurement and rational dispensing. Additionally, providing up-to-date, transparent information on medicine availability at each PHC could enhance patient trust and enable healthcare providers to make more informed prescribing decisions. Together, these strategies not only help manage patient expectations and reduce unnecessary stockouts but also strengthen the credibility, efficiency and overall performance of the healthcare system.
Additionally, a more localised approach to essential medicines lists—tailored at the provincial or district level—could better reflect regional healthcare needs and practical conditions.45 A similar model, the Municipal Essential Medicine Lists (MEMLs) has been implemented in Brazil and is used effectively to assess local PHCs and reduce stock-outs.46 Adopting a comparable system in Indonesia may help align procurement with local needs, provide greater clarity to patients regarding medicine availability and enable healthcare providers to better meet expectations while enhancing accountability within the system.
Strengths and Limitations
This is the first study to use nationwide data from all districts, DHOs and PHCs in Indonesia, incorporating a wide range of health system and contextual indicators. By combining these datasets, we were able to conduct comprehensive multilevel and spatial analyses of medicine availability in one of the world’s largest and most diverse nations. A key limitation is that our data reflect availability only in public facilities and do not capture the extent to which local communities can access these medicines. Additionally, measurements were taken at a single point in time, so temporal fluctuations in availability are not captured, although the large sample size reduces the likelihood of major deviations. Importantly, this study examines associations between variables and medicine availability, which does not establish causality. As a result, observed patterns should be interpreted as indicative of potential relationships rather than definitive causal effects. Future research using longitudinal or quasi-experimental designs could provide stronger evidence of causal links and guide targeted interventions to improve medicine availability.
Conclusion
Overall, this study demonstrates that the availability of essential medicines in Indonesian PHCs varies widely across districts and is closely linked to the functionality of local pharmaceutical systems. Ensuring consistent medicine availability requires a multifaceted approach that addresses both facility-level and district-level factors. Our findings underscore the importance of investing in the physical and human resources of PHCs, particularly by ensuring the presence of trained pharmacists. Furthermore, the application of sound inventory management practices and strong coordination between PHCs and district health offices is critical for optimising medicine distribution. While locally specific initiatives to strengthen PHCs are important, targeted interventions that build the capacity of DHOs to manage pharmaceutical supply chains are equally vital. Strengthening these local pharmaceutical systems will be essential to achieving a reliable, equitable supply of essential medicines across Indonesia’s diverse regions.
Supplementary material
10.1136/bmjgh-2025-019616online supplemental file 1
10.1136/bmjgh-2025-019616online supplemental file 2
10.1136/bmjgh-2025-019616online supplemental file 3
The reference list from the paper itself. Each links out to its DOI / PubMed record.
- 1Soucy Brown M Wirtz V Hafner T et al PSS Insight v 2 - A Framework and Indicators for Measuring Pharmaceutical Systems Strengthening Management Sciences for Health 2021
- 2Hafner T Walkowiak H Lee D et al Defining pharmaceutical systems strengthening: concepts to enable measurement Health Policy Plan 201732572841310.1093/heapol/czw 15328025324 PMC 5400040 · doi ↗ · pubmed ↗
- 3Prinja S Bahuguna P Tripathy JP et al Availability of medicines in public sector health facilities of two North Indian States BMC Pharmacol Toxicol 20151610.1186/s 40360-015-0043-8PMC 469030526699711 · doi ↗ · pubmed ↗
- 4Phuong JM Penm J Chaar B et al The impacts of medication shortages on patient outcomes: A scoping review P Lo S One 202114 e 021583710.1371/journal.pone.0215837 PMC 649946831050671 · doi ↗ · pubmed ↗
- 5Atif M Sehar A Malik I et al What impact does medicines shortages have on patients? A qualitative study exploring patients’ experience and views of healthcare professionals BMC Health Serv Res 20212182710.1186/s 12913-021-06812-734404420 PMC 8369330 · doi ↗ · pubmed ↗
- 6van Gurp M Alba S Ammiwala M et al The availability of essential medicines in public healthcare facilities in Afghanistan: navigating sociopolitical and geographical challenges Health Policy Plan 2025403687910.1093/heapol/czae 12139697139 PMC 11886856 · doi ↗ · pubmed ↗
- 7Chow CK Nguyen TN Marschner S et al Availability and affordability of medicines and cardiovascular outcomes in 21 high-income, middle-income and low-income countries BMJ Glob Health 20205 e 00264010.1136/bmjgh-2020-002640 PMC 764050133148540 · doi ↗ · pubmed ↗
- 8Mekuria GA Ali EE The financial burden of out of pocket payments on medicines among households in Ethiopia: analysis of trends and contributing factors BMC Public Health 20232380810.1186/s 12889-023-15751-337138248 PMC 10155387 · doi ↗ · pubmed ↗