A telomere-to-telomere gapless genome assembly of the Tibetan wild ass (Equus kiang)
Bilige Wuyun, Jie Liu, Rihan Wu, Yunxia Li, Fangyuan Liu, Hengquan Zhao, Chunxia Hao, Gaoping Zhao, Wei Sun, Yongli Song, Wei Wang, Yu Wang, Cunxin Ma, Fengyi Xu, Jian He, Pengyue Wang, Xiangnan Bao, Guifang Cao, Yong Zhang, Ying Lu, Xihe Li

TL;DR
Scientists created a complete genome assembly of the Tibetan wild ass, a high-altitude species, to study its genetic adaptations.
Contribution
The first telomere-to-telomere gapless genome assembly of the Tibetan wild ass is presented.
Findings
The genome assembly is 2.49 Gb with 99.94% BUSCO completeness and a contig N50 of 107.02 Mb.
The assembly includes all 54 telomeres and 27 centromeres across autosomes and sex chromosomes.
Genome annotation identified 24,005 protein-coding genes and 36.52% repetitive sequences.
Abstract
As a First-Class Protected species in China, the Tibetan wild ass (Equus kiang) is endemic to the Qinghai-Tibet Plateau and exhibits remarkable adaptation to extreme high-altitude environments characterized by low oxygen, cold temperatures, and high UV radiation. To explore its genetic basis and evolutionary adaptations, we generated the first telomere-to-telomere (T2T) gapless genome using an integrated sequencing strategy that combined PacBio HiFi, ultra-long Oxford Nanopore (ONT), Hi-C, and BGI short-read technologies. The resulting 2.49 Gb assembly achieved a contig N50 of 107.02 Mb, comprising all 54 telomeres and 27 centromeres across 25 pairs of autosomes and the X/Y chromosomes, and reached 99.94% BUSCO completeness. Genome annotation predicted 907 Mb of repetitive sequences (36.52% of the genome) and 24,005 protein-coding genes. Comparative and technical analyses confirmed high…
Genes, proteins, chemicals, diseases, species, mutations and cell lines named across the full text — each resolved to its canonical identifier and authoritative record.
Click any figure to enlarge with its caption.
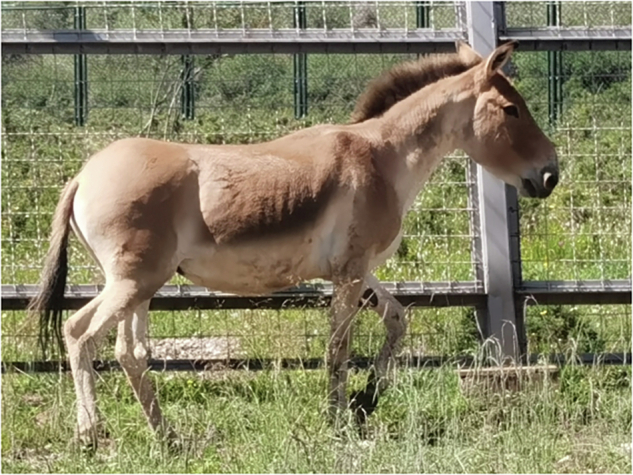 Figure 1
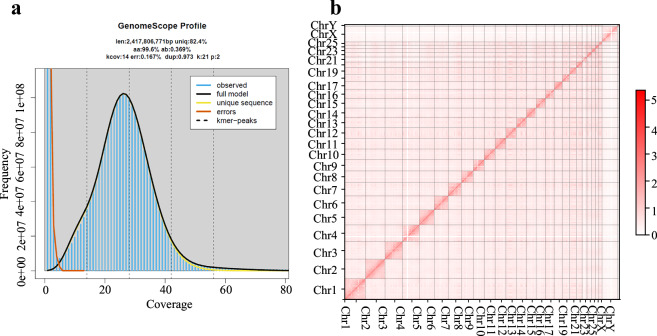 Figure 2
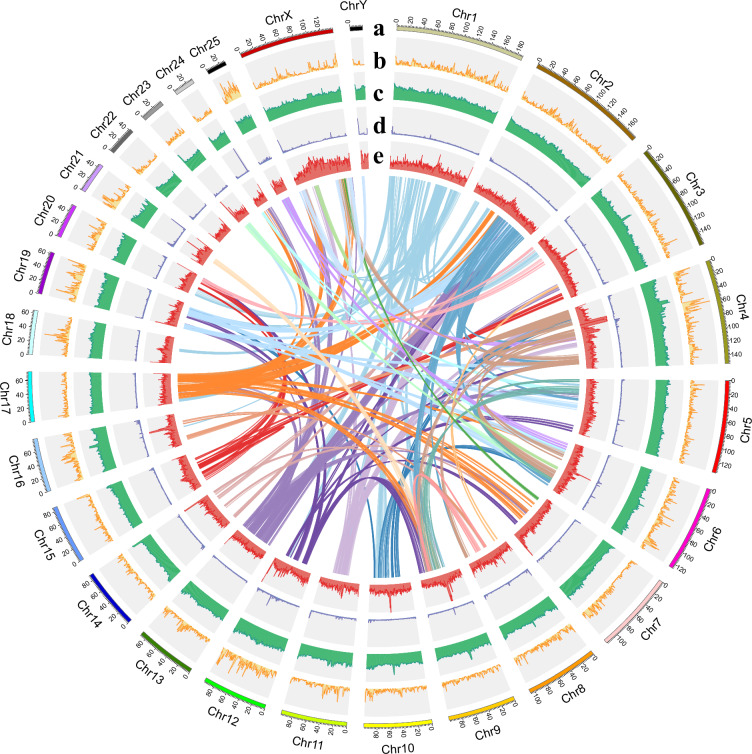 Figure 3
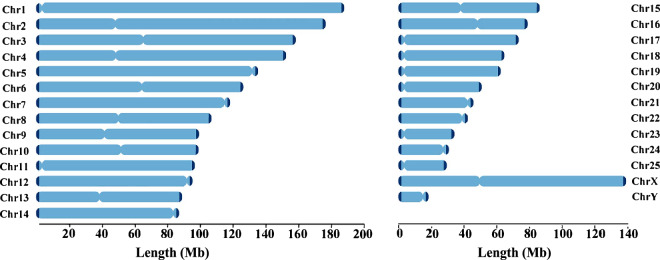 Figure 4
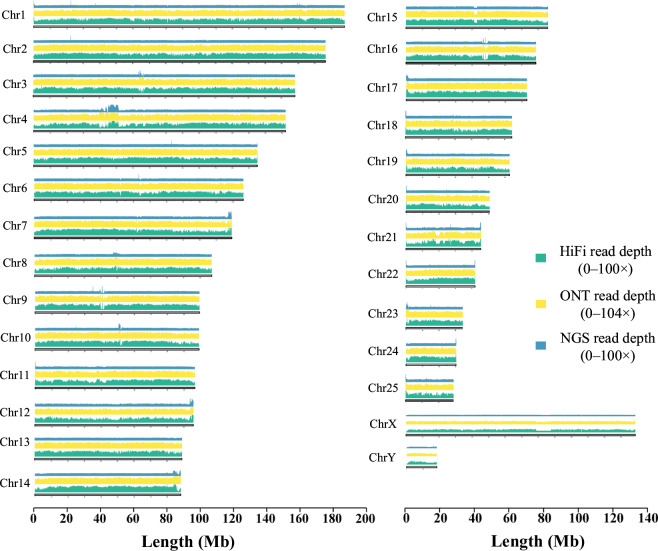 Figure 5
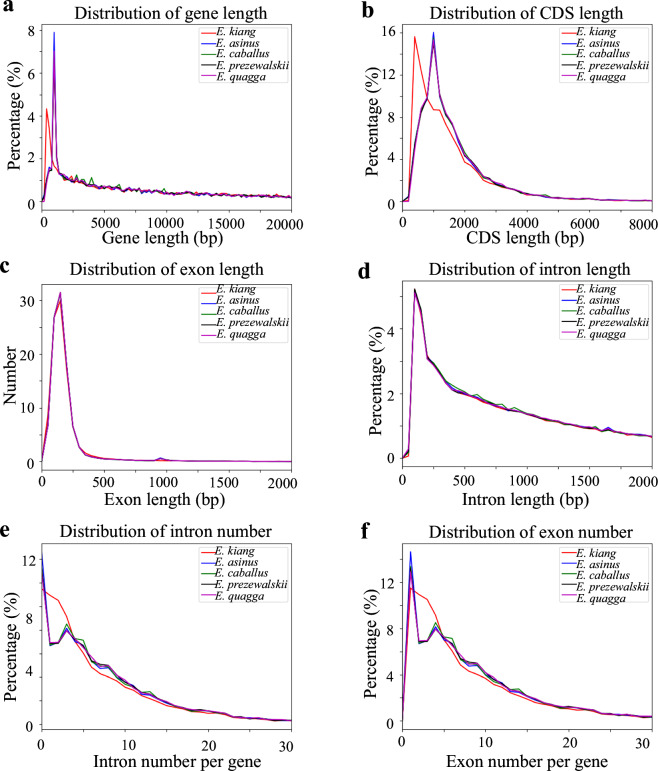 Figure 6
- —Science and Technology Planning Project of Inner Mongolia (Grant Reference Number: 2021GG0403).
Peer Reviews
No public reviews on file for this paper yet. If you reviewed it on a platform where reviews are public (OpenReview, ICLR, NeurIPS, ICML), you can paste yours below so the community can read it here.
Videos
No videos yet. Explain this paper in a talk, walkthrough, or lecture? Add one.
Taxonomy
TopicsGenomics and Phylogenetic Studies · Telomeres, Telomerase, and Senescence · Chromosomal and Genetic Variations
Background & Summary
The Tibetan wild ass (Equus kiang), a subspecies of the Asiatic wild ass (E. hemionus), inhabits the Qinghai–Tibetan Plateau, where it endures hypoxic, cold, and high-radiation conditions at elevations of 4,000–5,500 m^1^. Oxygen levels in these alpine regions are roughly 40% lower than at sea level^2^, while ultraviolet radiation is substantially higher^3^. Over time, this species has evolved physiological and genetic traits that support oxygen transport, cardiac performance, and skeletal development under chronic hypoxia^4^. E. kiang is endemic to the Qinghai–Tibetan Plateau, with most of its population residing in China, and is listed as a National First-Class Protected Species, with an estimated 60,000–70,000 individuals^1^.
Comparative genomics has deepened our understanding of Equus evolution. High-quality assemblies of the horse^5^, donkey^6^, Przewalski’s horse^7^, and plains zebra^8^ have revealed genetic variations linked to pigmentation, chromosomal stability, epigenetic regulation, and immune defense. Yet, how large-scale chromosomal organization contributes to species diversification within Equus remains unclear. To date, only the genomes of the domestic horse and donkey have achieved telomere-to-telomere (T2T) completeness, while a corresponding reference for the Tibetan wild ass has been lacking. The previously published Illumina-based draft genome was fragmented (2,960 scaffolds, scaffold N50 = 17.6 Mb) and lacked functional annotations (Genome Sequence Archive accession: CRA001222^4^), limiting its use for evolutionary and comparative analyses.
In this study, we present the first gapless, telomere-to-telomere genome assembly of the Tibetan wild ass, generated using PacBio HiFi, ultra-long Oxford Nanopore, BGI short-read, and RNA-seq data. This fully annotated reference provides the most complete genomic framework to date for this high-altitude equid. The availability of this T2T genome will enable chromosome-scale comparisons between E. kiang and its lowland relatives, advancing our understanding of high-altitude adaptation and informing future conservation efforts.
Methods
Ethical statement
This study was conducted under the approval of the Institutional Animal Care and Use Committee of Inner Mongolia University (Approval No. IMU-Horse-2024-150). All animal experiments followed both national and institutional regulations. Every effort was made to reduce animal discomfort and prevent unnecessary stress or injury.
Sample collection
Fibroblast tissues were isolated from the ear of a 6-year-old male Tibetan wild ass (Fig. 1) in the Wildlife Rescue and Breeding Center of Qilian Mountain National Park, Qinghai, China (38°03′44″ N, 100°26′29″ E). The hair on the tissue surface was shaved before the sample collection and the area was disinfected with 75% ethanol (Cat. No. SJ2151, Lierkang). The tissues were then rinsed with 0.9% sodium chloride solution (Cat. No. 10139191323806, Kelun) to remove remaining blood and placed in Dulbecco’s phosphate-buffered saline (DPBS; Cat. No. C3590-0500, VivaCell) and transported to the laboratory at 4 °C, which were then used to establish the first fibroblast cell line of the Tibetan wild ass, which were verified by an immunofluorescence staining of Vimentin. The cells were cultured at 38.5 °C in a humidified incubator with 5% CO₂, using MEM-Alpha medium (Cat. No. 12561056, Gibco) supplemented with 10% fetal bovine serum (Cat. No. C04001-500, VivaCell) and penicillin-streptomycin (Cat. No. 15140-122, Gibco)^9^. When the cells exhibited stable growth and had been successfully passaged to the 4th-5th generation, sufficient samples were harvested for genome and transcriptome sequencing. We used the 4th-5th generations of the cells instead of primary cells because the primary cells are more prone to contamination and purity of the fibroblast cells is not high enough. Previous studies have reported that the fibroblast cells with 4-5 passages still maintain genomic stability and do not exhibit significant chromosomal or sequence-level variations, compared to the primary cells^10^.Fig. 1. Image of the sequenced individual.
DNA extraction, library construction and sequencing
Genomic DNA was isolated from somatic cells using the sodium dodecyl sulfate-proteinase K (SDS-PK) method, which avoids toxic organic solvents such as phenol or chloroform and ensures to yield safety and high-quality DNA. High molecular weight genomic DNA (50–200 kb) for Oxford Nanopore Technologies (ONT) sequencing and genomic DNA (>30 kb) for PacBio circular consensus sequencing (CCS) were isolated using the Grandomics Genomic DNA Purification Kit (Cat No. XJZZ-HMW-001-003, GrandOmics, China) following the manufacturer’s standard protocol. DNA purity and quantity were determined with a NanoDrop™ One Microvolume UV-Vis Spectrophotometer (Thermo Fisher Scientific, USA) and a Qubit® 4.0 Fluorometer (Invitrogen, USA), respectively. Qubit measurements indicated concentrations of 330.4 ng/μL for Illumina short-read DNA libraries, 110.0 ng/μL for PacBio DNA libraries, and 158.0 ng/μL for ONT ultra-long DNA libraries. The OD260/280 ratios ranged from 1.8 to 2.0 and the OD260/230 ratios ranged from 2.0 to 2.2, indicating high-quality DNA suitable for long-read sequencing. DNA integrity was further verified by electrophoresis on a 1% agarose gel.
During the preparation of ONT sequencing library, large DNA fragments (>100 kb) were isolated and extracted using the Sage HLS system for high-molecular-weight DNA size selection (Sage Science, USA). DNA termini were subsequently repaired to convert heterogeneous blunt and sticky ends into a uniform state followed by dA-tailing, using the NEBNext FFPE DNA Repair Mix (Cat. No. M6630, New England Biolabs, USA) in combination with the NEBNext Ultra II End Repair/dA-Tailing Module (Cat. No. E7546, New England Biolabs, USA). Adapter ligation and purification were performed with the Ligation Sequencing Kit SQK-LSK114 (Oxford Nanopore Technologies, UK). The final sequencing library was quantified with a Qubit® 3.0 Fluorometer (Invitrogen, USA) and loaded onto the Oxford Nanopore PromethION platform (Oxford Nanopore Technologies, UK), which generated the raw sequencing data. When the reads were processed with Dorado in sup mode for quality control, those with a quality value (QV) < 7 were removed, producing 184.97 Gb of clean reads with an average length of 31.35 kb and an N50 length of 92.07 kb for downstream genome assembly (Table 1). In parallel, genomic DNA was sheared into 15–20 kb fragments using a Megaruptor 3 system (Diagenode) and purified for PacBio HiFi sequencing. Library construction was performed with the SMRTbell Prep Kit 3.0 (Pacific Biosciences, USA), followed by size selection and cleanup with the PippinHT system (Sage Science, USA). Sequencing on a PacBio Revio instrument (Pacific Biosciences, USA) operated by Grandomics (Wuhan, China) produced 145.03 Gb of data with a mean read length of 20.11 kb and an N50 of 21.36 kb. Additionally, a short-read library was prepared using the MGIEasy Universal DNA Library Prep Kit V1.0 (Cat. No. 1000005250, MGI) and sequenced on a DNBSEQ-T7RS platform (MGI, China), yielding 89.77 Gb of high-quality paired-end reads following quality control.Table 1. Statistics of the sequencing data used in the genome assembly (len. for length).Sequencing PlatformTotal bases (bp)Sequencing Depth (x)Mean read len. (bp)Maximum read len. (bp)N50 read len. (bp)ONT184,970,760,4847431,3451,161,95792,072PacBio HiFi145,027,773,7245820,11373,54621,362Hi-C248,798,107,200100150150150NGS data89,767,184,40036150150150
The High-throughput Chromosome Conformation Capture (Hi-C) libraries were prepared from purified DNA digested with DpnII in 1 × NEB buffer. Blunt ends were filled in by adding 10 mM dTTP, 10 mM dCTP, 10 mM dGTP, 5 mM biotin-14-dATP, water, and 40 U of Klenow enzyme. Following ligation, crosslinks were reversed, and DNA was purified using the QIAamp DNA Mini Kit, then sheared to an average fragment size around 400 bp. Biotinylated junction fragments were captured with Dynabeads MyOne Streptavidin C1 beads, and libraries were constructed using the NEBNext Ultra II DNA Library Prep Kit. Sequencing was performed on an MGI-2000 platform, generating 248.80 Gb of clean reads after quality control (Table 1).
RNA isolation and transcriptome-sequencing
Total RNA was extracted from the cell lines frozen in liquid nitrogen using TRIzol (Cat. No. DP424, TIANGEN) following the manufacturer’s protocol. Poly(A) RNA was enriched from total RNA using the Dynabeads mRNA Purification Kit (Cat. No. 61006, Invitrogen). Qubit analysis indicated RNA concentrations of 255.0 ng/μL for both short- and long-read RNA sequencing libraries. The long-read RNA sequencing library was prepared by first synthesizing full-length cDNA using an oligo(dT) primer and a template-switch oligonucleotide (TSO), followed by PCR amplification with barcoded primers to generate second-strand cDNA for Kinnex full-length RNA library construction. Sequencing of the long-read RNA library was performed on a PacBio Revio platform, yielding a total of 19.13 Gb of data, which enabled comprehensive characterization of full-length transcript structures. The short-read RNA sequencing library was constructed by purifying RNA with the Dynabeads mRNA Purification Kit, fragmenting it using the MGIEasy RNA Library Prep Kit V3.1 (Cat. No. 1000005276, MGI), and synthesizing first-strand cDNA with random primers and reverse transcriptase, followed by second-strand synthesis. The cDNA then underwent end repair, A-tailing, adapter ligation, and size selection using MGIEasy DNA Clean Beads (Cat. No. 1000005279, MGI), before PCR amplification to generate the transcriptome library. Sequencing on the MGI-T7 platform produced 7.6 Gb of paired-end reads, which were used for T2T genome annotation, allowing precise identification of exon boundaries and splice sites.
Genome assembly
Prior to genome assembly, the depth and frequency distributions of 21-bp k-mers were analyzed with Jellyfish (v2.2.6)^11^ using 89.76 Gb of clean BGI reads (Table 1). GenomeScope2^12^ estimated the genome size at 2.42 Gb, with a low heterozygosity of 0.369% (Fig. 2a). Genome was de novo assembled with HiFiams (v0.19.5)^13^ using PacBio HiFi reads and ONT ultra long data (>50 kb) to generate a primary assembly, with a genome size of 2.56 Gb and a contig N50 value of 89.07 Mb.Fig. 2. Genome features and Hi-C contact map. (a) GenomeScope plots of the 21-mer frequency. The curves in black indicate the distribution of the k-mer frequency. The red curves near the y-axis show the error of the k-mers, which normally occur at low coverage. The estimated genome sizes (Len) and heterozygosity rates (Het) are shown at the top of each plot, as is the percentage of uniquely mapped reads (Uniq), k-mer coverage (Kcov), PCR error rate (Err), percentage of PCR-derived duplicates (Dup), and k-mer length (K). (b) Hi-C contact map at 200 Kb resolution. Strength of intra- and inter-chromosomal Hi-C interaction frequencies is indicated by a color gradient scale displayed with strong interactions in red and weaker in lighter colors.
The Hi-C reads were aligned to the assembled contigs using BWA (v0.7.17-r1198-dirty, mem -5SP)^14^, then filter the resulting BAM with filter_bam (v2.0.0, 1–nm 3)^15^, retaining only alignments with mapping quality ≥ 1 and edit distance < 3. Scaffold clustering was carried out successively by filtering, reassigning, ordering, and orienting with HapHiC (v1.0.5)^16^ according to the alignments. The clustered scaffolds were further manually curated based on Hi-C contact maps (Fig. 2b). The X and Y chromosomes were built from the phased assemblies by Hifiasm (v0.24.0)^17^ using Oxford Nanopore long reads in combination with Hi-C data (ONT and Hi-C). The sex chromosomes’ sequences were then incorporated into the Hi-C-based scaffolded genome, with the newly assembled Chr-X sequence replacing the original Chr-X in the scaffolds. The chromosome-scale genome is 2.50 Gb in size, with a scaffold N50 length of 107.20 Mb and 39 unclosed gaps.
The ONT ultra-long reads (>50 kb) were aligned to the genome using Minimap2 (v2.26, -ax map-ont)^18^. Reads that were either unmapped or exhibited poor alignment quality (sequence identity <80% and coverage <80%) and uniquely mapped to both flanking regions of a gap were extracted. These reads were subjected to local iterative assembly to generate sequences bridging the gap, which were then aligned back to the original genome and used to replace the corresponding gap regions. Similarly, PacBio HiFi reads were aligned to the genome using Minimap2 (v2.26, -ax map-hifi)^18^. Reads that were unmapped, contained telomeric sequences, or mapped to chromosome ends lacking assembled telomeres were extracted and subjected to local iterative assembly. The resulting sequences were aligned to the genome and used to replace the corresponding gap regions at chromosome termini. Thus, all the 39 gaps were successfully filled in this treatment.
The gapless assemblies were polished using clean short reads to construct 21-kmer and 31-kmer databases with yak (v1.0; count -b37 -k21 and count -b37 -k31)^19^, followed by alignment of PacBio HiFi reads to the genome using minimap2 (v2.26,–secondary = no -ax map-hifi)^18^ and error correction with NextPolish2 (v0.2.0, default settings)^20^. Ultimately, a gapless T2T genome assembly was obtained, spanning 2.49 Gb with a contig N50 of 107.02 Mb, comprising 25 pairs of autosomes and the X/Y chromosomes (18.30–188.01 Mb in length), and exhibiting a GC content of 41.88% (Fig. 3 and Table 2).Fig. 3. Genomic landscape calculated in 500-kb non-overlapping windows. The circles from outside to inside: (a) Length scale of each chromosome, (b) gene density, (c) GC content, (d) tandem repeats, (e) TE density. The lines in the central area of the circles link the syntenic chromosomes.Table 2. Overview of the assemblies.Genome assembly Assembled genome size (bp)2,486,009,346 Number of Chromosomes52 (50 + XY) Number of gap chromosomes0 Number of gap centromeres0 Length of anchored chromosomes (bp)2,486,009,346 Length of non-anchored chromosomes (bp)0 Contig N50 Length (bp)107,027,462 Number of contigs27 Number of telomeres54 Number of centromeres27 QV64.73 Complete BUSCO (%)99.94Gene prediction Total length of annotated repetitive sequences (bp)907,953,162 Percentage of repetitive sequences in the assemblies (%)36.52 Quantity of annotated protein-coding genes24,005 Average Gene Length (bp)38,083 Average CDS length(bp)1,531 Average Exons Number per Gene8.74 Average Exon Length (bp)175 Average intron length (bp)4,724 BUSCO completeness (%)94.66Quantity of predicted non-coding RNAs rRNA529 snRNA490 miRNA2,441 tRNA2,103 Others543
Identification of telomeres and centromeres
Telomeres were annotated by scanning the terminal 100 kb of each chromosome in the T2T assembly with seqkit (v2.5.1, locate -i -p TelomereSeq)^21^, through which any region carrying ten consecutive AACCCT repeats was considered telomeric. Finally, telomeric sequences were identified at both ends of all the chromosomes (Fig. 3 and Table 3). Prediction of the centromere region involved the different tools. TRF (v4.09.1, parameters 2 7 7 80 10 50 500 -f -d -h -l 6)^22^ was employed to identify tandem repeats, after which RepeatMasker (v1.331, options nolow -no_is -gff -norna -engine abblast -lib lib)^23^ was used to annotate repetitive elements and extract regions of high repeat density. These high-density sequences were then used to build a k-mer database with KMC (v3.2.4; kmc followed by kmc_dump)^24^. SRF (-l 6)^25^ was then used to identify candidate centromere repeat units. Blastn (v2.9.0+)^26^ was applied to align candidate centromeric repeat units against the T2T genome and quarTeT (v1.1.6, CentroMiner -t 10 -i Genome–TE TE.gff)^27^ was used to predict centromere regions. In short, centromere regions were identified in all of the chromosomes in the T2T genome (Fig. 4 and Table 3).Table 3. Location of telomeres and centromeres in the genome.ChromosomesTolemeresCentromeresChr. IDLen. (bp)5p Start-End (bp)5p Len. (bp)3p Start-End (bp)3p Len.(bp)Start-End (bp)Len. (bp)Chr1188,013,9574-1313113,128188012009-1880139511,94364936-555010490,074Chr2176,613,81210-44574,448176611231-1766137612,53147873361-48033270159,909Chr3158,254,98026-18841,859158252879-1582548892,01163843373-662593092,415,936Chr4152,367,8740-96509,651152366799-1523678731,07544954817-514692496,514,432Chr5135,271,33810-17261,717135265349-1352713365,988135203297-13525947656,179Chr6126,495,0480-1535415,355126482218-12649504712,83063796011-64505598709,587Chr7119,450,0280-24072,408119447896-1194500272,132117451604-1188186461,367,042Chr8107,027,4330-1351613,517107022900-1070274324,50449115124-504682291,353,105Chr999,402,5052-21702,16999399142-994025043,36339105552-434896634,384,111Chr1099,133,04450-41836999131824-991330421,21950627761-521969601,569,199Chr1196,649,82330-55495,52096632191-9664982217,63255506-270891215,385Chr1295,826,72450-91059,05695822857-958266963,84094480109-957701751,290,066Chr1389,048,94450-47474,69889046443-890489432,50137700002-388499581,149,956Chr1488,180,3323-19871,98588176450-881803313,88285469025-881763112,707,286Chr1586,144,0961-19271,92786138977-861440255,04937210003-37949934739,931Chr1678,732,5510-12501,25178722739-787325419,80346237155-495173023,280,147Chr1773,072,8300-21312,13273054889-7307282917,94157714-9521337,499Chr1864,458,44126-85498,52464454445-644584353,99158488-378472319,984Chr1962,705,79095-43134,21962699940-627057405,80156030-13597451,303,715Chr2050,503,04511-14261,41650502646-5050284720253977-222700168,723Chr2145,510,3690-1639316,39445509512-4551036885745028293-45453002424,709Chr2241,975,4040-13831,38441973956-419754031,44841771427-41916672145,245Chr2334,545,7740-42042134543852-345457231,87236016-18830121,846,996Chr2430,381,95540-55051130377358-303818904,53330163422-30325199161,777Chr2529,224,8200-1093210,93329221586-292248153,23063158-525398462,240ChrX138,721,5150-1955119,552138706248-13872151415,26748970105-49470599500,494ChrY18,296,8350-1482114,82218281795-1829628614,49218113631-1813936625,735Fig. 4Location of centromeres and telomeres in the chromosomes. The filled blocks indicate the length of each chromosome, where deep blue and narrow areas exhibit the location of telomeres and centromeres, respectively.
Annotation of repetitive sequence
From the beginning, tandem repeats were predicted with GMATA (v2.2)^28^ and Tandem Repeats Finder (TRF, v4.07b)^22^. The LTR_retriever pipelines were then applied to build a curated LTR transposable-element library (TE-library), while RepeatModeler (open-1.0.11)^23^ generated a de novo repeat library (RepMod-library). The TE-library, the RepMod-library, and the Repbase database (v20181026) were merged into a comprehensive repeat library, which was subsequently used by RepeatMasker (Revision 1.331)^23^ to mask and annotate repetitive sequences across the entire genome. A total of 907 Mb (36.52% of the genome) was annotated as repetitive sequences, comprising LINEs (529.5 Mb), LTRs (182.8 Mb), SINEs (60.0 Mb), DNA transposons (96.2 Mb), tandem repeats (11.5 Mb), satellites (23.2 Mb), simple repeats (2.1 Mb), unknown elements (1.6 Mb), low-complexity sequences (0.06 Mb), and other minor categories (0.016 Mb) (Table 4).Table 4. Statistics of repetitive sequence in the genome.TypeQuantityLength of sequence (bp)Percentage of the genome (%)Total TEs2,771,155869,496,71834.98 LINE1,169,958529,459,78721.30 LTR584,979182,827,2557.35 SINE391,12660,026,8862.41 DNA613,53696,235,6753.87 RC11,556947,1150.04Tandem Repeats326,05711,474,9990.46Satellites12,56323,186,3550.93Simple repeats11,7952,076,8920.08Unknown8,7261,640,9970.07Low complexity35861,6660Others17515,5350Sum3,130,829907,953,162****36.52
Prediction and annotation of the protein-coding genes
Gene prediction was performed using a combination of homology-based, transcriptome-based, and ab initio approaches. For homology-based annotation, GeMoMa (v1.6.1)^29^ was used to perform homology-based prediction by aligning against the protein sequences from horse (E. caballus, GCA_041296265.1), Przewalski’s horse (E. przewalskii, GCA_037783145.1), donkey (E. asinus, GCA_041296235.2), and plains zebra (E. quagga, GCA_021613505.1). For ab initio prediction, Augustus (v3.3.1)^30^ and GlimmerHMM (v3.0.4)^31^ were employed. Transcriptome-based annotation was performed by mapping RNA-seq clean reads to the T2T genome using STAR (v2.7.3a)^32^. Subsequently, transcript assemblies were integrated using PASA (v2.3.3)^29^, and gene loci were predicted based on transcriptome data with GeneMark-ST (v5.1, March 2014)^33^ and GMAP^34^. Furthermore, EvidenceModeler (EVM, v1.1.1)^35^ was employed to combine all evidence and generate a non-redundant consensus gene set. A total of 24,005 protein-coding genes were predicted in the T2T genome, with an average gene length of 38,082.92 bp and an average CDS length of 1,530.55 bp. On average, each gene contains 8.74 exons, with an average exon length of 175.16 bp and an average intron length of 4,723.89 bp. BUSCO analysis indicates a completeness of approximately 94.66% (Tables 2, 5).Table 5. Prediction and functional annotation of the protein-coding genes in the genome.Gene predictionGene modelsQuantity of genesAverage gene len. (bp)Average CDS len. (bp)Average exons number per geneAverage exon len. (bp)Average intron len. (bp)De novoAUGUSTUS27,83036,9941,6398.441944,754GLIMMER184,37112,2786604.661413,172Homolog**E. asinus46,20035,4831,4247.082015,597E. caballus47,66635,8811,4497.291995,477E. przewalskii40,86337,1671,4637.381985,599E. quagga40,49937,3541,4647.411975,595RNAseq115,64829,2493,5136.115755,035Evidence Modeler24,00538,0831,53158.741754,724**Functional annotationDatabaseQuantity of annotated genes****Percentage (%)**NR21,48089.48KEGG15,37564.05KOG13,05454.38GO13,70557.09Swissprot19,63381.79Annotated21,67890.31
Functional annotation of the predicted genes was conducted by performing a Blastp (v2.7.1, with an e-value threshold of 1 × 10^−5^)^36^ search against several public databases, including the Non-Redundant Protein Database (NR), Kyoto Encyclopedia of Genes and Genomes (KEGG)^37^, Eukaryotic Orthologous Groups (KOG)^38^, Gene Ontology (GO)^39^, and SwissPro^40^. A total of 21,678 genes (90.31% of all predicted genes) were successfully annotated in at least one database. Specifically, 21,480 genes (89.48%) were annotated in NR, 15,375 (64.05%) in KEGG, 13,054 (54.38%) in KOG, 13,705 (57.09%) in GO, and 19,633 (81.79%) in SwissProt (Tables 2, 5).
Non-coding RNAs were annotated by aligning sequences to the Rfam (v14.0)^41^ database using RNAmmer and the cmscan program from the Infernal package^42^ to predict rRNA, snRNA, and miRNA genes. tRNA genes were identified using tRNAscan-SE^43^. A total of 529 rRNAs, 490 snRNAs, 2,441 miRNAs, and 2,103 tRNAs were predicted (Table 2).
Data Records
All sequencing datasets generated in this study have been deposited in the National Center for Biotechnology Information (NCBI) under BioProject accession PRJNA1299250 (https://www.ncbi.nlm.nih.gov/bioproject/PRJNA1299250) and BioSample accession SAMN50296468 (https://www.ncbi.nlm.nih.gov/biosample/SAMN50296468). The sequencing data are publicly available in the SRA under the top-level accession SRP607874^44^, which includes the following read sets: SRR34937394, SRR34937391, SRR34937392, SRR34937393, SRR34937390, and SRR34997386. These datasets comprise PacBio HiFi sequencing, ONT ultra-long reads, short-read Hi-C data, next-generation sequencing data, and RNA-Seq datasets. The T2T genome assembly has been deposited in the NCBI Genome database under accession GCA_052150635.1^45^. The gene structure annotation file^46^, coding sequences^47^, and protein sequences^48^ have been deposited in Figshare under the following accession numbers: 10.6084/m9.figshare.299415144, 10.6084/m9.figshare.29941520, and 10.6084/m9.figshare.29941517, respectively. All data are publicly available.
Technical Validation
Multiple complementary strategies were applied to assess the completeness and accuracy of the genome assemblies. Hi-C contact maps displayed strong intra-chromosomal interactions across all linkage groups, confirming the correct ordering and orientation of contigs as well as the overall chromosomal architecture (Fig. 2b). Annotation of centromeric regions identified 27 centromeres on 25 autosomes and 2 sex chromosomes, each corresponding to an individual chromosome, while telomeric sequences were detected at both ends of all chromosomes, further supporting assembly integrity (Fig. 4). Short paired-end reads were aligned using BWA (v0.7.17)^14^, resulting in a mapping rate of 99.38% for BGI reads and 96.58% for RNA-Seq reads. Long-read alignments performed with minimap2^49^ also demonstrated high mapping efficiencies, with 95.76% of ONT reads and 99.99% of PacBio HiFi reads successfully mapping to the T2T genome (Fig. 5).Fig. 5. Sequencing coverage of Hi-C, ONT, and NGS reads on each chromosome. Coverage depth is plotted using 50-kb bins.
Comparative analyses of gene feature distributions (such as gene counts, CDS regions, exons, and introns) between the Tibetan wild ass and closely-related species revealed consistent patterns, supporting the accuracy of gene annotation (Fig. 6). CRAQ^50^ evaluation of the assembly indicated a high coverage rate of 99.29%, with only 0.032% of regions classified as low-confidence, and near-perfect assembly quality indices for reads (R-AQI: 99.17) and scaffolds (S-AQI: 98.69), reflecting excellent continuity and base-level precision. Merqury (v1.3)^51^, based on a 21-mer database constructed with Merfin, estimated the consensus quality value (QV) at 53.74 for BGI short reads (overall error rate: 4.23 × 10^−6^) and 64.73 for PacBio HiFi reads (overall error rate: 3.37 × 10^−7^), confirming exceptional base-level accuracy. Additionally, BUSCO test^52^ using compleasm (v0.2.5)^53^ with the mammalia_odb10 dataset^54^ of 9,226 single-copy orthologs confirmed a genome completeness of 99.94%.Fig. 6. Distribution of the genome features among different species. (a) Distribution of gene length. (b) Distribution of CDS length. (c) Distribution of exon length. (d) Distribution of intron length. (e) Distribution of intron numbers per gene. (f) Distribution of exon numbers per gene.
Overall, the validation of the genome data set demonstrated that the current T2T genome of the Tibetan wild ass was highly completed and structurally reliable, which established a robust reference for investigating the evolutionary and adaptive mechanisms of hoofed mammal in high-altitude environments.
The reference list from the paper itself. Each links out to its DOI / PubMed record.
- 1Beall, C. M. Two Routes to Functional Adaptation: Tibetan and Andean High-Altitude Natives. www.nasonline.org/adaptationandcomplexdesign (2007).10.1073/pnas.0701985104 PMC 187644317494744 · doi ↗ · pubmed ↗
- 2Dahlback, A., Gelsor, N., Stamnes, J. J. & Gjessing, Y. UV measurements in the 3000–5000 m altitude region in Tibet. Journal of Geophysical Research Atmospheres 112 (2007).
- 3Kalbfleisch, T. S. et al. Improved reference genome for the domestic horse increases assembly contiguity and composition. Commun Biol 1 (2018).10.1038/s 42003-018-0199-z PMC 624002830456315 · doi ↗ · pubmed ↗
- 4Wang, C. et al. Donkey genomes provide new insights into domestication and selection for coat color. Nat Commun 11 (2020).10.1038/s 41467-020-19813-7PMC 772304233293529 · doi ↗ · pubmed ↗
- 5Flack, N. et al. The genome of Przewalski’s horse (Equus ferus przewalskii). G 3: Genes, Genomes, Genetics 14 (2024).10.1093/g 3journal/jkae 113PMC 1130494738805182 · doi ↗ · pubmed ↗
- 6Ranallo-Benavidez, T. R., Jaron, K. S. & Schatz, M. C. Genome Scope 2.0 and Smudgeplot for reference-free profiling of polyploid genomes. Nat Commun 11 (2020).10.1038/s 41467-020-14998-3PMC 708079132188846 · doi ↗ · pubmed ↗
- 7Cheng, H. et al. Haplotype-Resolved Assembly of Diploid Genomes without Parental Data HHS Public Access Author Manuscript. https://github.com/chhylp 123/hifiasm.10.1038/s 41587-022-01261-x PMC 946469935332338 · doi ↗ · pubmed ↗
- 8Hu, J. et al. Next Polish 2: A Repeat-aware Polishing Tool for Genomes Assembled Using Hi Fi Long Reads. Genomics Proteomics Bioinformatics 22 (2024).10.1093/gpbjnl/qzad 009PMC 1201603638862426 · doi ↗ · pubmed ↗