Synthesis and assessment of ionic liquid derived from benzalkonium chloride as corrosion inhibitor for carbon steel
Ashraf M. Ashmawy, Reda Abdel-Hameed, Odeh A. O. Alshammari, Maher I. Nessim, Modather F. Hussein, Abdalrahman G. Al-Gamal

TL;DR
This study creates and tests ionic liquids that effectively prevent carbon steel corrosion in acidic environments.
Contribution
The synthesis and evaluation of novel ionic liquids as highly efficient corrosion inhibitors for carbon steel in 1 M HCl.
Findings
The ionic liquids achieved up to 97% corrosion inhibition at 100 ppm in 1 M HCl.
The compounds act as mixed-type inhibitors by adsorbing onto the steel surface.
Quantum chemical analysis showed ILII–ILIV had better inhibition due to their aromatic ring structure.
Abstract
Corrosion poses a significant challenge in the materials industry, especially when carbon steel (C-steel) is subjected to highly corrosive environments such as 1 M HCl. In this study, four ionic liquids (ILs)-1-benzyl-1-methylpiperidin-1-ium chloride (ILI), 1-benzyl-2-methylpyridin-1-ium chloride (ILII), 1-benzyl-3-methylpyridin-1-ium chloride (ILIII), and 1-benzyl-4-methylpyridin-1-ium chloride (ILIV) were synthesized and characterized using spectroscopic techniques, including FT-IR and 1HNMR. Electrochemical analyses such as potentiodynamic polarization (PP), electrochemical impedance spectroscopy (EIS), and electrochemical frequency modulation (EFM) demonstrated excellent protective performance for C-steel in 1 M HCl, reaching a maximum inhibition of 97% at an optimum concentration of 100 ppm. Insights from polarization and impedance analyses confirmed that these compounds act as…
Genes, proteins, chemicals, diseases, species, mutations and cell lines named across the full text — each resolved to its canonical identifier and authoritative record.
Click any figure to enlarge with its caption.
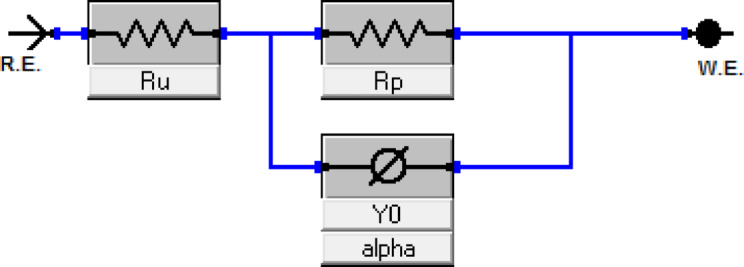 Figure 10
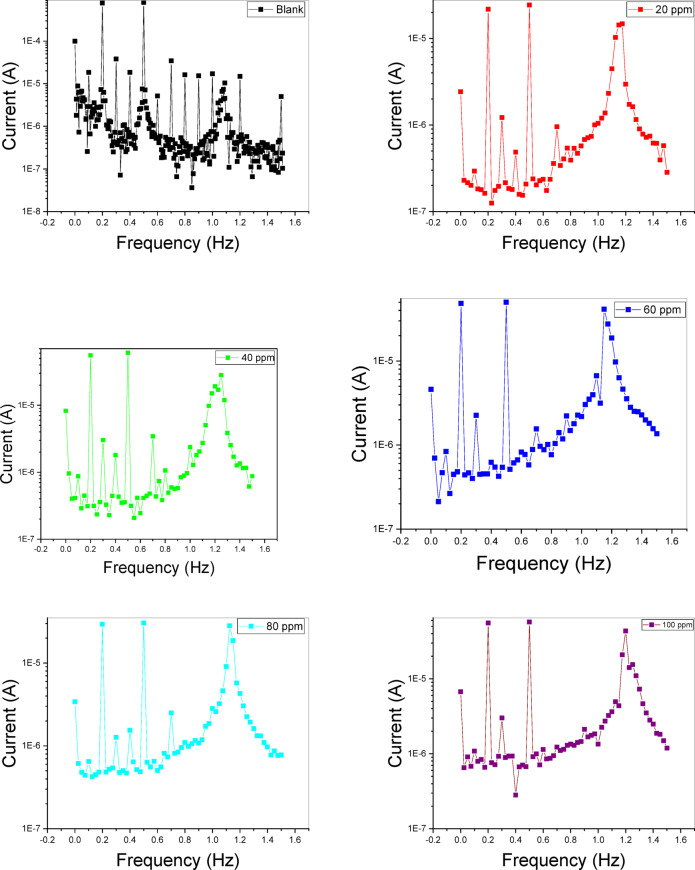 Figure 11
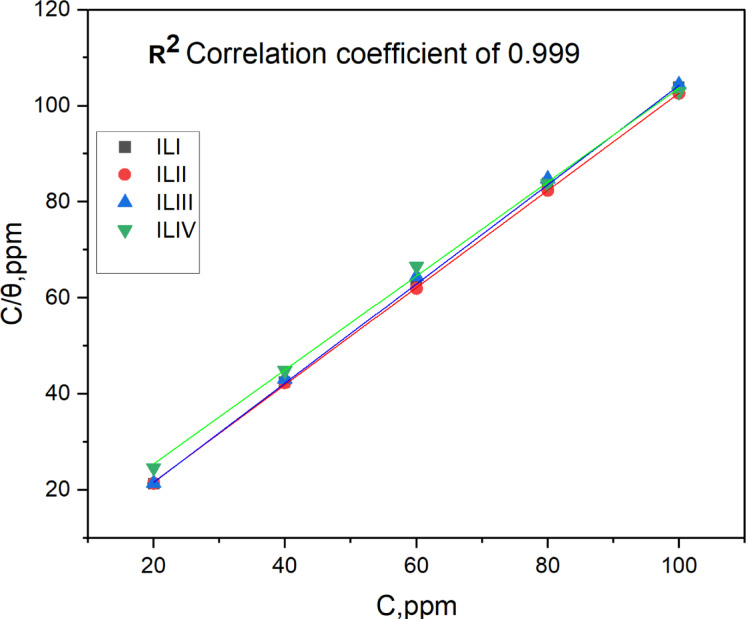 Figure 12
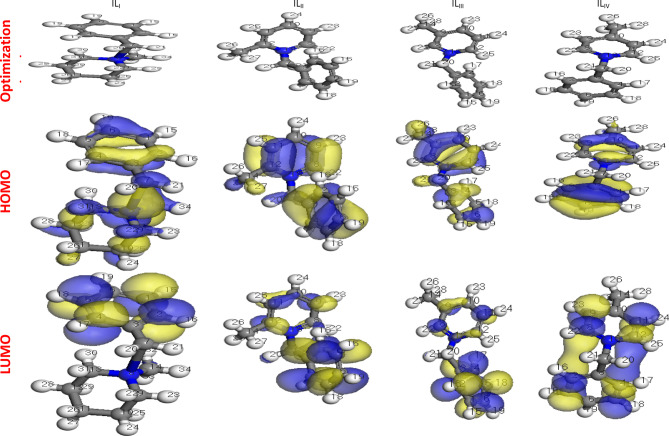 Figure 13
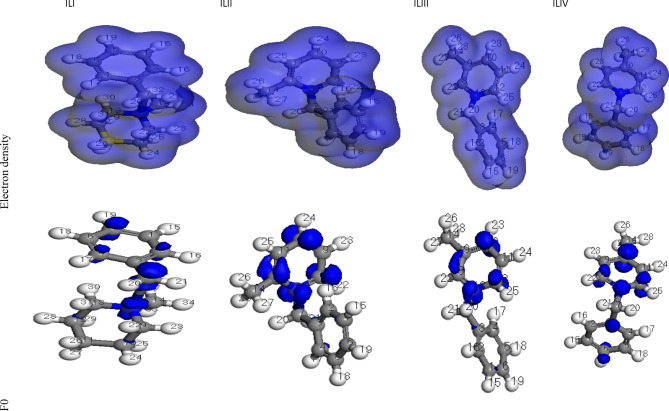 Figure 14
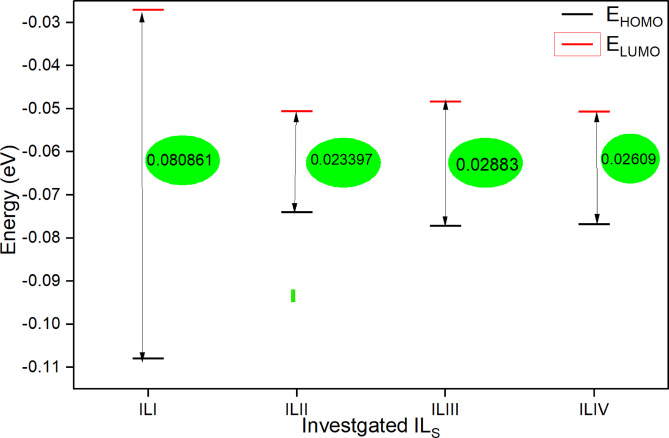 Figure 15
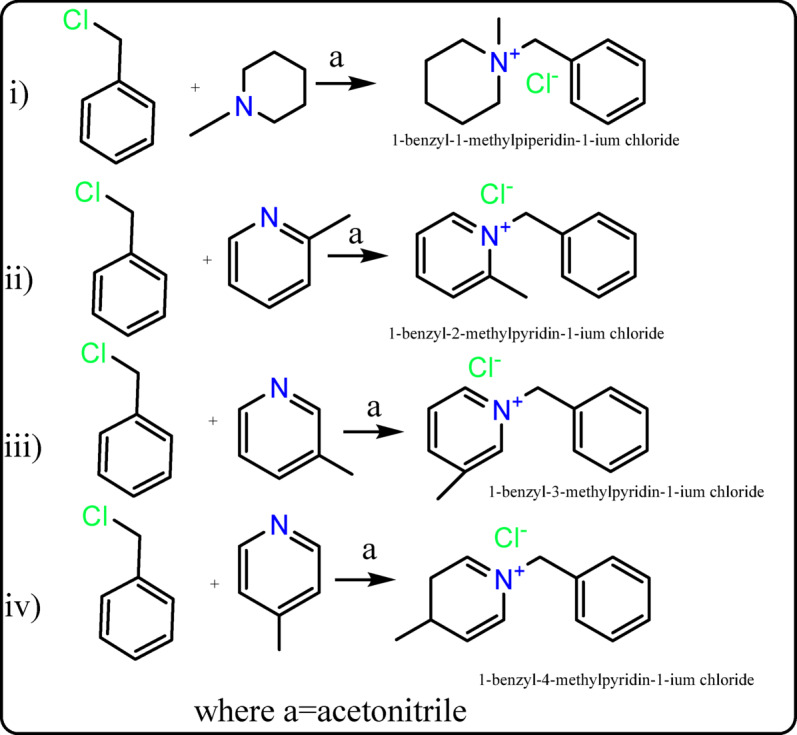 Figure 1
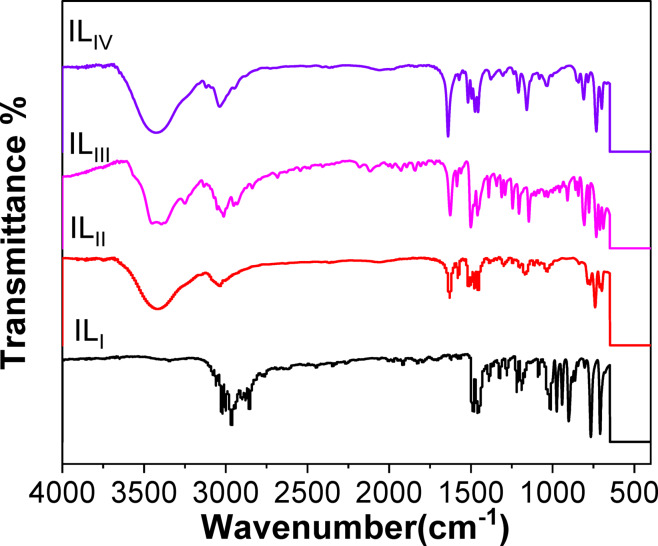 Figure 2
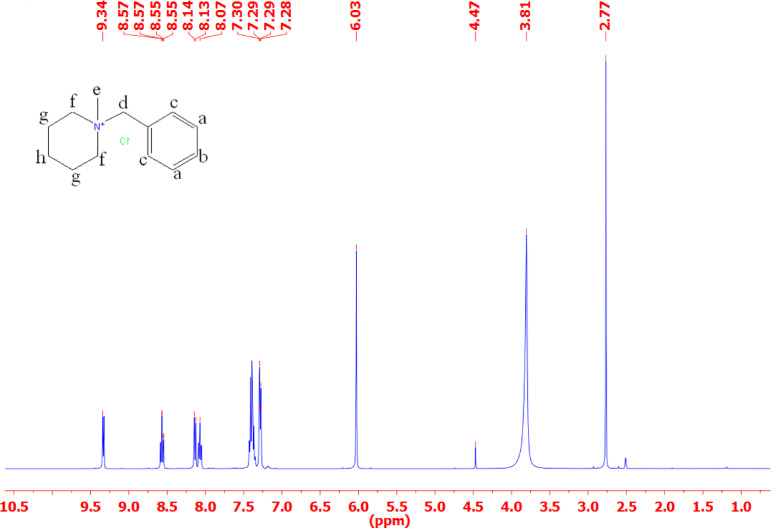 Figure 3
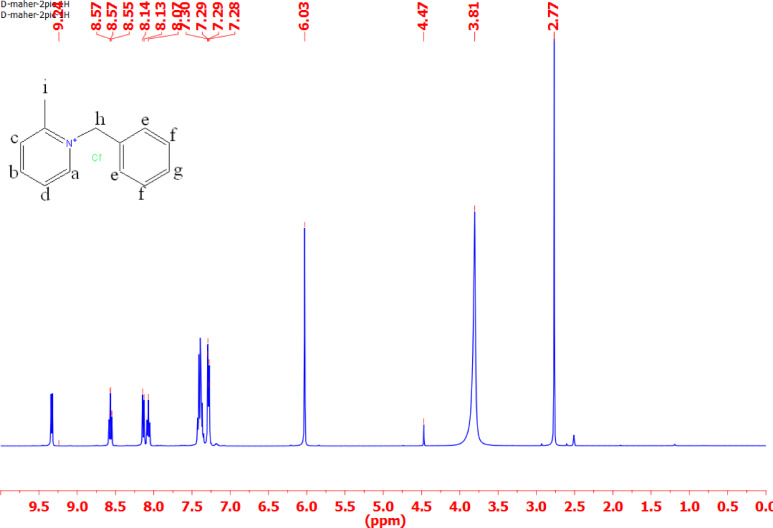 Figure 4
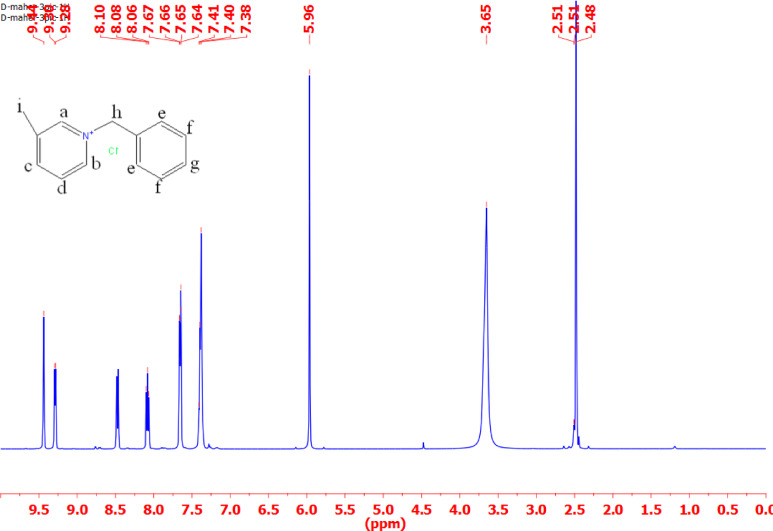 Figure 5
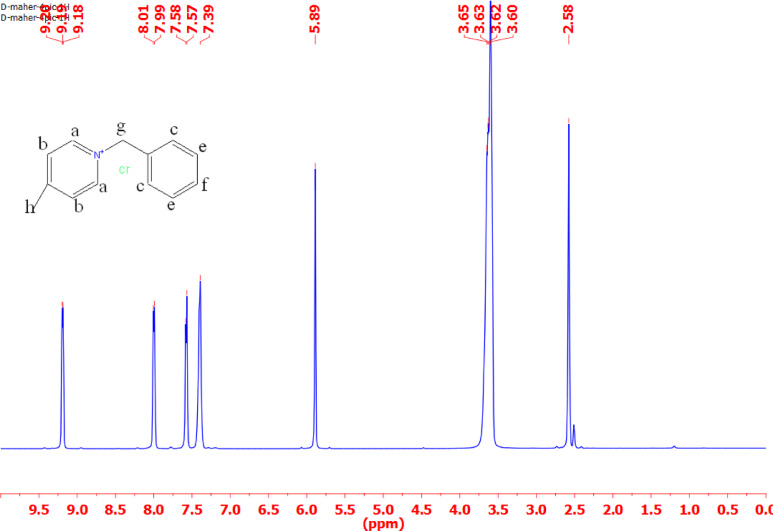 Figure 6
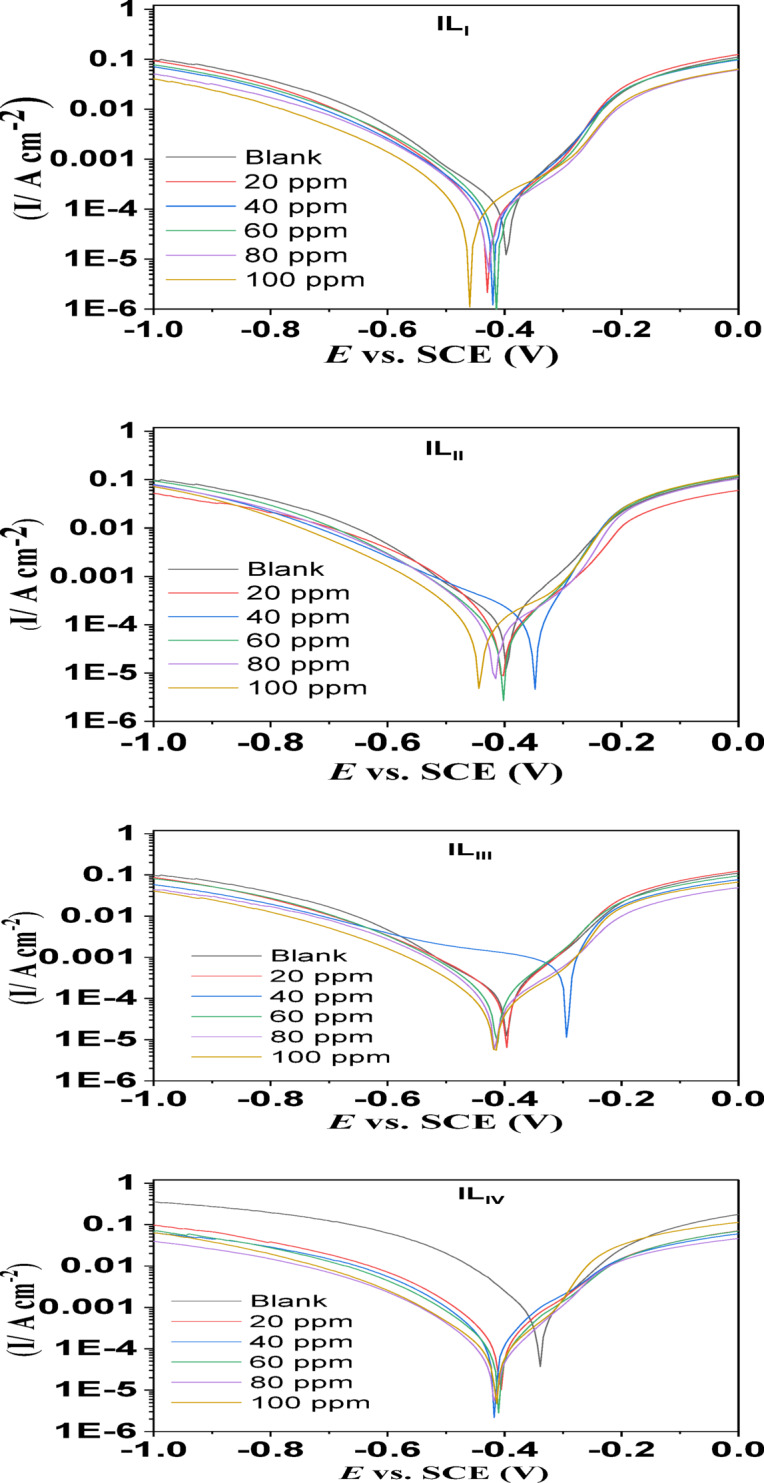 Figure 7
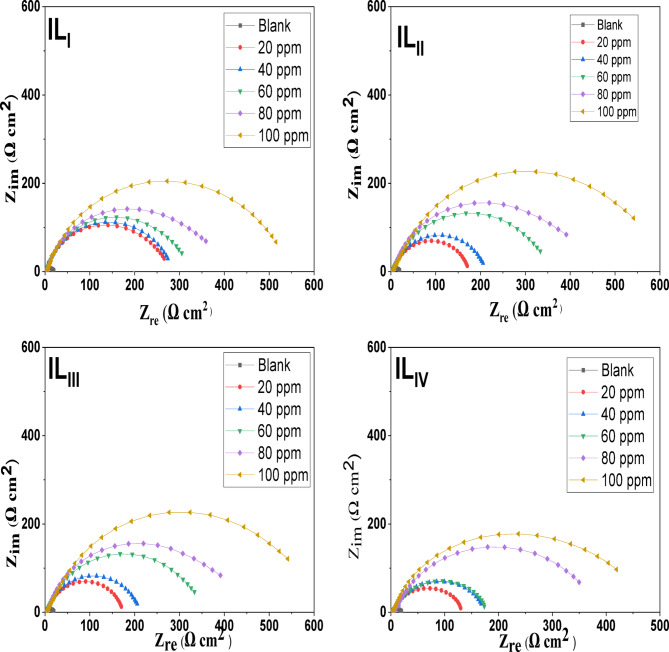 Figure 8
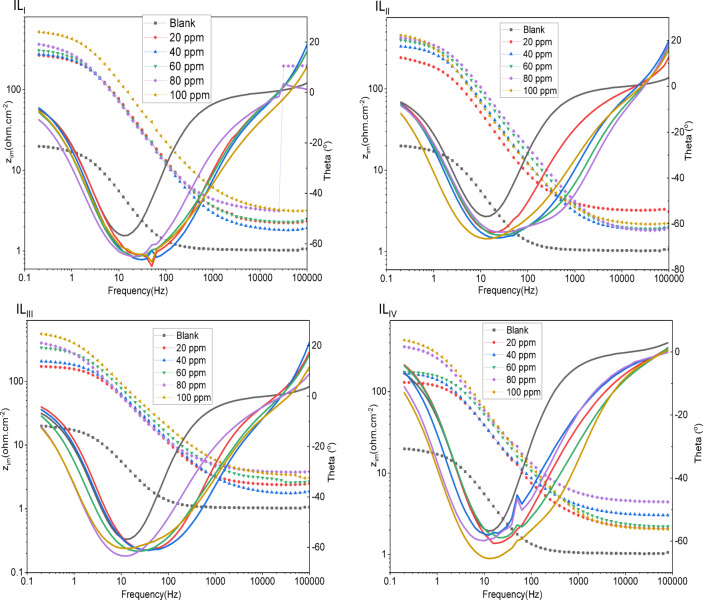 Figure 9
- —Egyptian Petroleum Research Institute
Peer Reviews
No public reviews on file for this paper yet. If you reviewed it on a platform where reviews are public (OpenReview, ICLR, NeurIPS, ICML), you can paste yours below so the community can read it here.
Videos
No videos yet. Explain this paper in a talk, walkthrough, or lecture? Add one.
Taxonomy
TopicsCorrosion Behavior and Inhibition · Ionic liquids properties and applications · Polymer composites and self-healing
Introduction
Ionic liquid (IL) compounds are widely utilized as anticorrosive agents due to several advantages, including high efficiency, environmental compatibility, and cost-effectiveness^1–4^. Owing to their inherent hydrophilic-lipophilic properties, ILs can readily form micelles by reducing surface tension, thereby optimizing the balance between adhesion and cohesion forces. This leads to improved adhesiveness and enhanced adsorption capacity^5^. Their distinctive characteristics make ILs an excellent alternative to replace hazardous materials in industrial applications, and they are frequently employed as solvents in numerous chemical processes^6^. Recently, researchers have shown increasing interest in exploring the behavior of ILs as corrosion inhibitors (CIs)^7–11^.
Deyab and Mohsen investigated the corrosion inhibition performance of a phosphate-based IL, specifically Tributylmethylphosphonium Bis(trifluoromethanesulfonyl)imide (PBIL), for steel structures exposed to brine water containing H₂S and CO₂ at a pH = 2. Their findings demonstrated that PBIL achieved an inhibition efficiency of nearly 92% at a concentration of 100 ppm^12^. In another study, Pisanenko, Klimko et al. synthesized three IL derivatives—3-(N-arylcarboxamido)-N-benzyl pyridinium chlorides—where the aryl groups were phenol (I), 1-naphthyl (II), and 2-naphthyl (III). These compounds were evaluated for their anticorrosion performance against 08 kp steel in 3 M hydrochloric acid within the temperature interval of 20–80 °C. The results indicated that ILs II and III exhibited significant anticorrosion activity^13^.
To accurately describe the behavior of these molecules, factors such as the aromatic structure, along with accessible π-electrons or free electron pairs outside the coordination sphere, play a crucial role in determining their adsorption on metal surfaces. Once adsorbed, these molecules obstruct active sites, thereby mitigating the corrosion rate^14–16^.
Oilfield corrosion creates numerous operational challenges, triggering leaks in critical infrastructure, including tanks, casings, tubing, and pipelines, that adversely affect both production processes and maintenance procedures^17,18^. Such issues often lead to repeated partial or complete shutdowns, accounting for over 20% of the maintenance budget, resulting in substantial financial losses^19^. “Despite their extensive use in industrial processes such as pickling, cleaning, and descaling, acids accelerate the degradation of steel-based equipment, especially C-steel. Therefore, this study is dedicated to synthesizing four ILsand assessing their corrosion inhibition performance for C-steel in 1 M HCl.”
Experimental
Materials
- The precursor chemicals required for the synthesis four target ILs were procured. Benzylwasride (99%), 1-methylpiperidine (98%), 2-picoline (98%), 3-picoline (98%), and 4-picoline (97%) were obtained from Alfa Aesar, while acetonitrile and diethyl ether were sourced from Merck. All chemicals and reagents were utilized as received without undergoing further purification.
- Chemical Composition of the Tested C-steel.
The C-steel employed in this study had the following chemical composition (wt.%): Fe (balance), Mn 0.853%, C 0.093%, Al 0.032%, Cr 0.025%, Ni 0.013%, P 0.014%, Si 0.011%, and Cu 0.012%.”
- 3.Corrosion Medium.
A 1 M HCl solution was prepared as the corrosive medium by diluting 37% HCl (AR grade) with distilled water. The concentration range of the synthesized ILs compound used in the study varied between 20 and 100 ppm.
Synthesis of ionic liquids (ILI-ILIV)
The four compounds (IL_I_–IL_IV_) have been synthesized previously using various methods^20–22^. In this study, they were prepared following the procedure described in the reference^23^, as illustrated in Fig. 1. A solution of benzyl chloride (0.05 mol) in acetonitrile was mixed with equimolar amounts (0.05 mol) of 1-methylpiperidine, 2-picoline, 3-picoline, and 4-picoline. The reaction mixture was subjected to reflux at 80 °C for 6 h. After completion, the resulting solution was evaporated under vacuum, and the obtained products (IL_I_–IL_IV_) were thoroughly washed multiple times with diethyl ether^20–22^. A flowchart of the research method in Fig. S1.
Fig. 1. Preparation of ionic liquids IL_I_-IL_IV_.
Characterization of ionic liquid
To confirm the molecular structure of the synthesized ILs, elemental composition was determined using a Perkin Elmer 240 C elemental analyzer. The infrared (IR) spectra were measured on a Nicolet iS10 spectrometer within the range of 4000 to 400 cm^− 1^, applying a resolution of 4 cm^− 1^ and a scanning speed of 32 cm/min. Additionally, proton nuclear magnetic resonance (^1^H NMR) spectra were recorded on a BRUKER 400.19 MHz spectrometer, equipped with a 5-mm broadband inverse Z-gradient probe, utilizing DMSO-d_6_ as the solvent.”
Electrochemical measurement
Steel (C-steel) with a surface area of 1 cm^2^ served as the working electrode. The reference electrode was a saturated calomel electrode (SCE), and a platinum wire acted as the counter electrode. Various electrochemical techniques, including impedance spectroscopy (EIS), polarization measurements, and electrochemical frequency modulation (EFM), were sequentially performed in the same experimental setup. The EIS measurements were carried out at open circuit potential (OCP) with a 10 mV alternating voltage applied, covering a frequency range from 100 kHz to 20 mHz at 25 °C. For EFM, a 10 mV AC amplitude was applied at 2 and 5 Hz frequencies. Polarization curves for anodic and cathodic surface interactions were also measured with a voltage sweep of ± 1.5 V/SCE relative to OCP at a scan rate of 5 mV/s. All data from the experiments were processed using the Echem Analyst software, with the measurements being carried out using a Gamry 3000 Potentiostat/Galvanostat/ZRA^3,24–27^.
Quantum chemical calculations
The present investigation focused on molecules that were designed and optimized geometrically through the DMol^3^ calculation model in Materials Studio v7.0. The geometry optimization process employed high-quality settings, utilizing the Local Density Approximation (LDA) functional and the DNP basis set, with all electrons treated for the core. Key quantum chemical parameters were evaluated, including the energies of the highest occupied molecular orbital (E_HOMO_) and the lowest unoccupied molecular orbital (E_LUMO_), as well as the energy gap (ΔE = E_LUMO_ - E_HOMO_)^28,29^. The ionization potential (I) was determined from -E_HOMO_ and the electron affinity (A) was calculated as -E_LUMO_. Electronegativity (χ) was derived as the average of I and A, while global hardness (η) was computed as their difference divided by 2. Softness (σ) was calculated as the reciprocal of η, and the electrophilicity index (ω) was given by ω = µ^2^/2η, where µ = (I - A)/2 denotes the chemical potential. For reference, the electronegativity and hardness of iron (χFe ≈ 7 eV and ηFe = 0) were assumed. Additionally, the Fukui indices for nucleophilic (f^+^) and electrophilic (f^−^) local reactivity were calculated using the DMol^3^ method^30–35^.
Results and discussion
Characterization of ILI-ILIV structures
Elemental analysis
The data shown in Table 1 demonstrate that the calculated percentages for each element align with the theoretical predictions.
Table 1. Elemental analysis results of ionic liquid (IL_I_-IL_IV_).Cpd.C%H%N%Cl%Calc.Obs.Calc.Obs.Calc.Obs.Calc.Obs.IL_I_69.1668.968.938.046.206.9015.7016.01IL_II_71.0771.926.426.956.386.0416.1316.91IL_III_71.0772.016.426.816.385.8716.1315.89IL_IV_71.0770.926.425.826.385.9516.1317.01
FT-IR spectroscopy
Table 2 and Fig. 2 present the key IR Data about three distinct classes of compounds or chemical groups. FT-IR analysis was performed to verify the formation of the novel ILs, with the spectra shown in Fig. 2 and the recorded absorption bands summarized in Table 2. The absorption bands observed between 3339 and 3464 cm^− 1^ are ascribed to the stretching vibrations of hydrogen-bonded H₂O molecules. In the range of 3120–3170 cm^− 1^, the novel IL compound exhibits absorbance maxima associated with the stretching vibrations of C–H bonds in the aromatic ring. Additionally, the stretching vibrations of aliphatic C–H bonds are seen between 2855 and 2930 cm^− 1^. Bands in the 1383–1420 cm^− 1^ region are associated with C–N stretching modes in the piperidine and pyridine rings^36–38^.
Table 2. Infra-Red spectra of (IL_I_-IL_IV_) (wavenumber cm^-1^).Cpd.CH-H_2_OC-H AromaticC-H aliphaticC-N AromaticIL_I_33443023-30022964-28551420IL_II_3420303629881415IL_III_33933133-30122951-283711,425IL_IV_3424303729211416
Fig. 2FTIR for ionic liquids IL_I_-IL_IV_.
1H-NMR
Tables 3 and Figs. 3, 4, 5 and 6 present the chemical shifts (δ ppm) observed in the proton nuclear magnetic resonance (NMR) spectra for the various compounds labeled as IL_I_, IL_II_, IL_III_, and IL_IV_. These chemical shifts provide insight into the local chemical environment of specific protons in each compound. For example, in compound IL_I_, protons ‘a,’ ‘b,’ ‘c,’ ‘d,’ ‘e,’ ‘f,’ ‘g,’ and ‘h’ exhibit distinct chemical shifts at 7.58, 7.55, 7.51, 4.65, 3.35, 1.87, 1.86, and 1.85 ppm, respectively. The corresponding spectral descriptions (e.g., ‘t’ for triplet, ‘d’ for doublet, ‘s’ for singlet) offer additional information about the proton’s coupling and multiplicity. Similarly, compounds IL_II_, IL_III_, and IL_IV_ display their respective chemical shifts and multiplicity patterns for their protons. These chemical shifts are essential for elucidating the molecular structure and connectivity of the compounds, assisting in their identification and structural characterization through NMR spectroscopy.
Table 3. Chemical shifts for different types of protons in IL_I_-IL_IV_.Chemical shifts of different types of protons (δ ppm)Cpd.abcdefghiIL_I_7.58(t)7.55(t)7.51(d)4.65(s)3.35(s)1.87(t)1.86(t)1.85(t)-IL_II_9.24(d)8.75(d)8.14(d)8.07(d)7.3(d)7.29(d)7.28(d)6.03(s)3.81(s)IL_III_9.44(s)9.3(d)8.1(d)8.08(d)7.66(d)7.41(d)7.38(d)5.96(s)3.65(s)IL_IV_9.19(d)8.01(d)7.99(d)7.58(d)7.39(d)5.89(s)3.62(s)-
Fig. 3^1^HNMR for ionic liquid IL_I_.
Fig. 4^1^HNMR for ionic liquid IL_II_.
Fig. 5^1^HNMR for ionic liquid IL_III_.
Fig. 6^1^HNMR for ionic liquid IL_IV_.
Electrochemical measurement
PP measurements
The plot of OCP against time for C-Steel in 1 M HCl solution in the absence and presence of different doses of ILs at 25 °C is shown in Fig. S2. After 900 s, the OCP became stable and steady values. Fig. 7 presents the Tafel polarization curves for C-steel in a 1 M (HCl) solution, both with and without inhibitors, at different concentrations of ILs at 25 °C. These curves provide insight into the electrochemical behavior of C-steel when exposed to the corrosive solution, with and without the presence of IL-based inhibitors. The polarization parameters associated with these curves are detailed in Table 4, including the current corrosion density (Icorr), which indicates the rate of electrochemical corrosion, as well as the Tafel slopes (βa and βc) that characterize the kinetics of the anodic and cathodic reactions, respectively. In addition to these parameters, the polarization resistance (Rp), which reflects the resistance of the material to corrosion, and the corrosion rate (C.R.), which quantifies the rate of material degradation, were also measured. Surface coverage (θ) was calculated, representing the fraction of the C-steel surface protected by the inhibitors, and the inhibitor efficiency (ηp%) was determined to evaluate how effectively the ILs prevent corrosion. As the concentration of ILs increases, a significant decrease in the corrosion current density (I_corr_) is observed, which implies that the ILs are successful in reducing the rate of corrosion of C-steel in the HCl solution. This reduction in Icorr suggests that, at the optimal concentration, the ILs function effectively as corrosion inhibitors. Furthermore, both the anodic and cathodic branches of the polarization curves shift toward more negative current densities with increasing IL concentration. This shift indicates that the inhibitor acts in a mixed inhibition mode, simultaneously affecting both anodic and cathodic reactions. In other words, the inhibitor not only slows down the anodic dissolution of the steel but also reduces the cathodic reactions, thereby significantly decreasing the overall corrosion rate^39,40^. Furthermore, the adsorption of ILs onto the steel surface, which blocks the active sites, does not alter the underlying corrosion reaction mechanism^41^. The θ and ηp% were determined using the following Eqs.^42,43^:
Fig. 7PP for ionic liquids (IL_I_-IL_IV_).
Table 4. Polarization parameters for IL_I_-IL_IV_ in 1 M HCl without and with various concentrations.Cpd.Conc. (M )-Eco. (mV) vs. SCEIco. (μA cm^-2^)βa (mV dec^-1^)βc (mV dec^-1^)k (m.p.y)θηp %Blank0 ppm3394180313.13501911-IL_I_20 ppm429248186.5258.0113.30.940794.0740 ppm420240156.4232.6109.90.942694.2660 ppm414202142.0214.492.510.951795.1780 ppm427162159.3217.374.230.961296.12100 ppm460156173.5226.571.440.962796.27IL_II_20 ppm403272202.6272.0124.50.934993.4940 ppm349230109.7249.5105.30.944994.4960 ppm402133121.0190.660.850.968196.8180 ppm416122132.0199.355.810.970897.08100 ppm442105131.6190.848.110.974897.48IL_III_20 ppm397284129.6224.1129.90.932193.2140 ppm416304252.9321.3138.70.927392.7360 ppm413289154.4227.1132.00.930993.0980 ppm416237207.4277.3108.30.943394.33100 ppm416164189.2290.780.310.957995.79IL_IV_20 ppm407783255.8299.2357.60.812781.2740 ppm418453181.2243.9207.10.891689.1660 ppm410418195.0276.4190.90.901290.1280 ppm416187164.4247.785.520.955395.53100 ppm41412297.6176.355.870.970897.08
\documentclass[12pt]{minimal} \usepackage{amsmath} \usepackage{wasysym} \usepackage{amsfonts} \usepackage{amssymb} \usepackage{amsbsy} \usepackage{mathrsfs} \usepackage{upgreek} \setlength{\oddsidemargin}{-69pt} \begin{document}$$\Theta {\text{ }}={\text{ }}\left[ {\left( {{{\mathrm{I}}_{0{\text{ corr}}}}-{\text{ }}{{\mathrm{I}}_{{\mathrm{corr}}}}} \right)/{{\mathrm{I}}_0}{\mathrm{corr}}} \right]$$\end{document} \documentclass[12pt]{minimal} \usepackage{amsmath} \usepackage{wasysym} \usepackage{amsfonts} \usepackage{amssymb} \usepackage{amsbsy} \usepackage{mathrsfs} \usepackage{upgreek} \setlength{\oddsidemargin}{-69pt} \begin{document}$${\mathrm{\boldsymbol{\upeta}p}}\% {\text{ }}={\text{ }}\left[ {\left( {{{\mathrm{I}}_{0{\text{ corr}}}}-{\text{ }}{{\mathrm{I}}_{{\mathrm{corr}}}}} \right)/{{\mathrm{I}}_{0{\mathrm{corr}}}}} \right] \times {\text{ 1}}00$$\end{document}where I_corr_ and I_0 corr_ represent the corrosion current densities in the presence and absence of the inhibitor, respectively, after calculating ηp%, we found that the inhibition efficiency of the ILs was approximately 96%.
EIS measurements
EIS offers crucial information regarding the dynamics of electrode processes as well as the surface properties of the system being studied. The patterns observed in the Nyquist plots reveal important mechanistic details about the interactions occurring at the electrode interface^44,45^. Fig. 8 displays the Nyquist plots for ILs in a 1 M HCl solution at 25 °C, showing data for both the absence and presence of different concentrations of the inhibitors. The impedance parameters obtained from the EIS measurements are summarized in Table 5. The Nyquist plots clearly indicate that the presence of the inhibitors significantly influences the impedance response of mild steel in the acidic solution. This observation suggests that as the concentration of the inhibitors increases, the impedance of the solution also rises. The plots display a single depressed semicircle common to both the uninhibited and inhibitor-containing solutions. However, the diameter of this semicircle expands considerably with higher inhibitor concentrations, reflecting a shift in impedance. This increase in diameter with rising IL concentrations indicates that the corrosion mechanism remains unchanged with the addition of the inhibitors^46^. The observed rise in impedance at low frequencies (Fig. 9) can be attributed to the adsorption of inhibitor compounds onto the surface of C-steel. To analyze the impedance spectra of mild steel corrosion in 1 M HCl, both with and without various concentrations of the inhibitor compounds, the Randle equivalent circuit was applied to model the data (Fig. 10). Furthermore, a single maximum in the Bode plots (Fig. 9) suggests that a single charge transfer primarily hindered the corrosion process^47,48^. The inhibition efficiency improves as the inhibitor concentration increases, with the highest concentration of 100 ppm showing a maximum inhibition efficiency of approximately 96%. The (ηp %) was determined by the following equations^49^:
Fig. 8. Nyquist plots for ionic liquids (IL_I_-IL_IV_).
Table 5EIS parameters for ILI-ILIV in 1 M HCl without and with various concentrations.Cpd.Conc. (M)Rs (Ru)(Ω cm^2^)Rct (Rp)(Ω cm^2^)Y_o_(μ Ω ^-1^ s^n^ cm^-2^) X10^-3^ n chi squaredX10^-3^θηp %BlankBlank1.03818.874.4770.8990.352--IL_I_20 ppm2.298278.20.3920.8245.500.932293.2240 ppm1.864288.90.4020.8326.250.934793.4760 ppm2.339329.80.4400.8.115.750.942894.2880 ppm3.36387.60.4540.8191.020.951395.13100 ppm3.263570.10.2770.7864.650.966996.69IL_II_20 ppm3.3240.50.5840.8364.200.921592.1540 ppm1.897360.80.4290.8207.770.947794.7760 ppm1.881425.10.3670.7986.520.955695.5680 ppm1.781456.70.3270.7917.500.958795.87100 ppm2.23534.50.5120.7997.160.964796.47IL_III_20 ppm2.403177.70.4970.8245.140.893889.3840 ppm1.787220.50.5220.7928.100.914491.4460 ppm2.806371.50.4720.7768.050.949294.9280 ppm3.915441. 70.5900.8010.4390.957295.72100 ppm3.359676.20.4480.7475300.972197.21IL_IV_20 ppm2.18142.70.890.794.950.867886.7840 ppm3.177191.10.990.764.820.901390.1360 ppm2.284194.50.720.764.120.903090.3080 ppm4.563421.40.660.763.090.955295.52100 ppm2.062507.40.560.782.880.962896.28
Fig. 9. Bode plots for ionic liquids (IL_I_-IV).
Fig. 10. Equivalent circuit used for EIS analysis.
\documentclass[12pt]{minimal} \usepackage{amsmath} \usepackage{wasysym} \usepackage{amsfonts} \usepackage{amssymb} \usepackage{amsbsy} \usepackage{mathrsfs} \usepackage{upgreek} \setlength{\oddsidemargin}{-69pt} \begin{document}$$\Theta {\text{ }}={\text{ }}[({{\mathrm{R}}_{{\mathrm{oct}}}} - {{\mathrm{R}}_{{\mathrm{ct}}}})/{{\mathrm{R}}_{{\mathrm{oct}}}}]$$\end{document} \documentclass[12pt]{minimal} \usepackage{amsmath} \usepackage{wasysym} \usepackage{amsfonts} \usepackage{amssymb} \usepackage{amsbsy} \usepackage{mathrsfs} \usepackage{upgreek} \setlength{\oddsidemargin}{-69pt} \begin{document}$${\mathrm{\boldsymbol{\upeta}p}}\% ={\text{ }}[({{\mathrm{R}}_{{\mathrm{oct}}}} - {{\mathrm{R}}_{{\mathrm{ct}}}})/{{\mathrm{R}}_{{\mathrm{oct}}}}] \times {\text{ 1}}00$$\end{document}where R_ct_ and R_oct_ represent the charge transfer resistances with and without inhibitors, respectively. The inhibition efficiency increases with higher inhibitor concentrations, reaching its peak at the maximum concentration.
EFM measurements
Fig. 11 presents a representative electrochemical frequency modulation (EFM) spectrum for C-steel in 1 M HCl at 25 °C for ILI, illustrating the harmonic and intermodulation current peaks. These prominent peaks were utilized to determine the Icorr, Tafel slopes (βc and βa) and causality factors (CF-2 and CF-3), with the extracted values summarized in Table 6. The corrosion rate of C-steel declines as the inhibitor concentration increases. A significant reduction in the C.R. from approximately 460 m.p.y to 11.40 m.p.y for ILIV demonstrates the high efficiency of the corrosion inhibitors studied. At the highest concentration, the inhibition efficiency reaches approximately 97%.
Fig. 11EFM for IL_I_.
Table 6EFM parameters for IL_I_-IL_IV_ in 1 M HCl without and with various concentrations.Cpd.Conc. (M)Icorr (μA cm^-2^ )βa (mV dec^-1^ )βc (mV dec^-1^ )CF-2CF-3k (m.p.y)θI_EFM_ %Blank0 ppm100773.7692.822.0333.191460--IL_I_20 ppm37.3542.8344.571.9203.29217.070.962996.2940 ppm33.8535.640.521.5433.51215.470.966396.6360 ppm25.7432.735.501.3592.91811.760.974497.4480 ppm21.8943.7352.651.3202.7710.000.978297.82100 ppm21.5724.2725.71.5212.5939.8580.978597.85IL_II_20 ppm66.7489.42144.51.8831.84530.500.933793.3740 ppm49.7464.5878.761.6784.01122.730.950695.0660 ppm48.3566.6796.792.0764.95322.090.951995.1980 ppm44.2984.6598.971.9962.62620.240.956095.60100 ppm42.2465.3189.711.6822.74919.300.958195.81IL_III_20 ppm122.889.9193.72.373.19856.120.878087.8040 ppm101.486.1093.602.5522.9546.320.899389.9360 ppm60.8684.83101.62.1623.41327.810.939693.9680 ppm56.1892.4997.371.1592.62825.670.944294.42100 ppm46.51106.8131.92.232.54321.250.953895.38IL_IV_20 ppm89.9750.3751.864.1723.10741.110.910691.0640 ppm89.8965.6571.921.353.4141.080.910791.0760 ppm67.0947.5150.344.6062.35730.650.933393.3380 ppm31.9248.9964.722.0810.114.590.968396.83100 ppm24.1453.964.7711.876.8511.030.976097.60
Based on the data obtained from PP, EIS, and EFM, the four IL compounds (ILI-IV) effectively inhibit the steel erosion of 1 M HCl at a concentration of 100 ppm. The primary structural difference among these compounds lies in the number of aromatic rings and the position of methyl substitution, with all four compounds possessing nitrogen atoms with lone pairs of electrons. ILI, containing only a single aromatic ring, exhibits lower inhibition efficiency compared to ILII-IV. This can be related to the greater ability of multiple aromatic rings to donate e- to the vacant d-orbitals of Fe while simultaneously accepting electrons from Fe, thereby enhancing adsorption and corrosion inhibition (See supplementary fig.S3)^47–49^.
Adsorption isotherm
Isotherms are essential tools for characterizing the mode and extent of these interactions. In this research, adsorption is linked to the θ of the metal by the inhibitor and its concentration in the corrosive medium. A range of adsorption isotherm models including Langmuir, Freundlich, Temkin, Frumkin, and Flory-Huggins were applied to fit the potentiodynamic polarization data. The linear equations, along with the corresponding slope values, intercepts, and regression coefficients (R²), are summarized in Table 7. Among these models, the Langmuir isotherm provided the best fit, as indicated by R² values closest to unity, suggesting monolayer adsorption of the ILs on the C-steel surface^50^. The adsorption of ILs onto the mild steel surface is best represented by the Langmuir adsorption isotherm, which is mathematically described by the following expression^50^:
Table 7. Adsorption isotherm models for ILI–ILIV inhibitors, including R² values, slopes, and intercepts, based on data from potentiodynamic polarization measurements at 25 °C.Adsorption isothermFlory-Huggins isothermFreundlich isothermFrumkin isothermLangmuir isothermTemkin isothermEquationlog(θ/C) = log K + n log (1-θ)log θ = log k + 1/n log Clog θ/(1−θ) C = log k+ 2a θ \documentclass[12pt]{minimal} \usepackage{amsmath} \usepackage{wasysym} \usepackage{amsfonts} \usepackage{amssymb} \usepackage{amsbsy} \usepackage{mathrsfs} \usepackage{upgreek} \setlength{\oddsidemargin}{-69pt} \begin{document}$$\:\frac{{\boldsymbol{C}}_{\:}\:}{\boldsymbol{\theta\:}}=\frac{1}{{\boldsymbol{K}}_{\:}\:}+\:{\boldsymbol{C}}_{\:}$$\end{document}
\documentclass[12pt]{minimal} \usepackage{amsmath} \usepackage{wasysym} \usepackage{amsfonts} \usepackage{amssymb} \usepackage{amsbsy} \usepackage{mathrsfs} \usepackage{upgreek} \setlength{\oddsidemargin}{-69pt} \begin{document}$$\:\boldsymbol{\uptheta\:}=-\frac{1}{{2\boldsymbol{a}}_{\:}\:}\mathbf{ln}\boldsymbol{C}\:-\frac{1}{{2\boldsymbol{a}}_{\:}\:}\mathbf{ln}\boldsymbol{K}$$\end{document} IL_I_R^2^0.91330.99690.91500.99990.8488Slope1.3872-0.0498-3.78481.0301-2.8739intercept-0.05200.076110.42770.962816.7627IL_II_R^2^0.91250.99150.97240.99990.9228Slope1.3691-0.0441-2.50461.0123-1.5288intercept-0.03170.06407.78741.401110.4580IL_III_R^2^0.91760.99430.70620.99960.5077Slope1.3918-0.0589-3.07601.0377-2.1447intercept-0.05170.09379.25321.385414.0048IL_IV_R^2^0.90510.91370.97050.99860.8594Slope1.2511-0.0903-1.89180.9784-0.8718intercept0.14580.15196.88735.85728.2135
\documentclass[12pt]{minimal} \usepackage{amsmath} \usepackage{wasysym} \usepackage{amsfonts} \usepackage{amssymb} \usepackage{amsbsy} \usepackage{mathrsfs} \usepackage{upgreek} \setlength{\oddsidemargin}{-69pt} \begin{document}$$\:\frac{c}{\theta\:}=\:\frac{1}{\mathrm{k}}+\:c$$\end{document}where K_ads_ is the equilibrium constant of the adsorption process, and C represents the inhibitor concentration. By substituting the experimentally obtained θ values from PP measurements into this equation and plotting C/θ against C, K_ads_ can be determined, as shown in Fig. 12.
Fig. 12. Langmuir adsorption for ILs at 25 °C. Obtained from pp data.
The calculation of the standard free energy of adsorption (ΔG°ads) was carried out using the following equation^51^:
\documentclass[12pt]{minimal} \usepackage{amsmath} \usepackage{wasysym} \usepackage{amsfonts} \usepackage{amssymb} \usepackage{amsbsy} \usepackage{mathrsfs} \usepackage{upgreek} \setlength{\oddsidemargin}{-69pt} \begin{document}$$\Delta {{\mathrm{G}}^0}{\mathrm{ads}}\,=\, - \,{\text{RT ln }}\left( {{\mathrm{55}}.{\text{5 }}{{\mathrm{K}}_{{\mathrm{ads}}}}} \right)$$\end{document}In this equation, the constant 55.5 corresponds to the molar concentration of water in the solution, R denotes the universal gas constant (8.314 J K^− 1^ mol^− 1^), and T represents the absolute temperature.
The calculated values of ΔG°ads are − 34.30, − 33.38, − 33.41, and − 29.89 kJ·mol⁻¹ for IL_I_, IL_II_, IL_III_, and IL_IV_, respectively. The adsorption process can be categorized based on the values of ΔG°ads as follows:
- (i)When ΔG°ads exceeds − 20 kJ mol⁻¹, the adsorption is mainly due to physical interactions (physisorption), which are governed by electrostatic forces.
- (ii)When ΔG°ads is below − 40 kJ mol⁻¹, the adsorption is primarily chemical (chemisorption), involving the formation of bonds through electron transfer from the inhibitor to the metal surface.
- (iii)For values of ΔG°ads between − 20 and − 40 kJ mol⁻¹, a combination of both physical and chemical adsorption mechanisms occurs.
For the ILs studied here, the computed ΔG°ads values fall below − 40 kJ mol⁻¹, indicating that the adsorption mechanism is a blend of both physical and chemical adsorption^52–55^.
Quantum chemical calculations
Figs. 13 and 14 illustrate the optimized geometry structure, along with the HOMO, LUMO, and electron density distribution of the cationic inhibitor. The HOMO (Highest Occupied Molecular Orbital) signifies the ability of the inhibitor molecule to release electrons. In contrast, the LUMO (Lowest Unoccupied Molecular Orbital) represents its capacity to receive electrons from the metal surface^53^. The energy values of HOMO and LUMO correlate with parameters such as work function (Ø), chemical hardness (h), global softness (S), and electrophilicity index (ω). Table 8 presents the Fukui indices and Mulliken atomic charges for the four synthesized ionic liquids (IL_I_–IL_IV_)^28^ .
Fig. 13. Optimized structures, HOMO and LUMO distributions of IL_I_-IL_IV_.
Fig. 14. Electron density and Muliken charge for ILs.
Table 8. Calculated quantum-chemical parameters for the synthesized Azo phenol compounds IL_I_-IL_IV_.Chemical Parameter*IL_I_IL_II_IL_III_IL_IV_E_HOMO_-0.1079-0.0739-0.0771-0.0767E_LUMO_-0.0271-0.0506-0.0483-0.0507ΔE _Gap_0.08090.02340.02880.0261I0.10790.07390.07710.0767A0.02710.05060.04830.0507X0.06750.06230.06270.0637h0.040430.01170.01440.0131 S 24.733885.481069.372276.6577w0.05640.16580.13640.1557ΔE _Back-donation_0.01010.00290.00360.0033ΔN87.4032301.8459244.9779270.7449All parameters in eV except ΔN is a dimensionless quantity.
According to frontier molecular orbital theory, an inhibitor molecule with a higher E_HOMO_ value can more readily transfer electrons to the vacant d-orbitals of iron. Conversely, a lower E_LUMO_ value enhances the molecule’s ability to accept electrons from Fe. A smaller energy gap (ΔE = E_LUMO_ - E_HOMO_) generally indicates a higher adsorption capability of the inhibitor onto the surface of C-steel, enhancing its corrosion inhibition potential^56,57^. As shown in Table 9; Fig. 15, the ΔE values for IL_II_–IL_IV_ are lower compared to IL_I_. This suggests that IL_II_–IL_IV_, which contains two aromatic rings, can more effectively donate and accept electrons in interactions with Fe. Among them, ILII exhibits the highest adsorption strength on C-steel and superior inhibition performance relative to the other ionic liquids. These findings align well with the experimental data, further confirming the theoretical calculations. Table 10 presents a comparative analysis of the inhibition efficiency (IE%) of various ionic liquids (ILs) used as corrosion inhibitors for carbon steel in acidic media, specifically at relatively high concentrations. The inhibition efficiencies were determined using Electrochemical Impedance Spectroscopy (EIS), a reliable technique for evaluating corrosion protection performance^58,59^.
Table 9. Calculated Fukui indices and mulliken atomic charges for IL_I_-IL_IV_.IL_I_IL_II_IL_III_IL_IV_ Atom
F0
f+
f- Atom F ^0^
f ^+^
f ^-^ Atom F ^0^
f ^+^
f ^-^ Atom F ^0^
f ^+^
f ^-^ C (1)0.0080.0080.008C (1)0.0170.0190.014C (1)0.020.0240.016C (1)0.0090.0090.009C (2)0.0350.0330.037C (2)-0.011-0.01-0.011C (2)0.0060.0060.006C (2)0.0040.0080.001C (3)-0.015-0.01-0.015C (3)-0.008-0.006-0.009C (3)-0.018-0.014-0.022C (3)0.0050.0050.005C (4)0.0360.0370.036C (4)0.0120.0160.009C (4)0.0050.010.001C (4)0.0090.0090.008C (5)0.0070.0070.008C (5)0.0080.0080.008C (5)0.0160.0180.014C (5)0.0060.0060.006C (6)0.0630.0620.063C (6)0.0150.0160.013C (6)0.0080.0070.01C (6)0.0320.0340.03C (7)0.090.090.09C (7)-0.027-0.027-0.027C (7)-0.039-0.04-0.038C (7)-0.031-0.029-0.033N (8)-0.002-0-0.001C (8)0.0840.0820.087C (8)0.0580.0520.065C (8)0.0450.0470.043C (9)-0.025-0.03-0.025C (9)-0.001-0.0020C (9)-0.002-0.001-0.004C (9)0.0120.0060.019C (10)-0.018-0.02-0.019C (10)0.1040.0990.108C (10)0.1040.10.107C (10)0.0640.0610.067C (11)-0.016-0.02-0.015C (11)0.0150.0150.015C (11)0-0.0010.001C (11)0.0060.0080.004C (12)-0.015-0.02-0.015C (12)0.0360.0310.041C (12)0.0860.0830.089C (12)0.060.0520.067C (13)-0.022-0.02-0.024N (13)0.0410.0390.043N (13)0.0280.0210.034N (13)0.0250.0230.027C (14)-0.021-0.02-0.021C (14)-0.023-0.022-0.023C (14)-0.021-0.02-0.021C (14)-0.025-0.025-0.026H (15)0.0690.070.069H (15)0.0350.0370.033H (15)0.0460.0470.044H (15)0.0490.050.047H (16)0.0630.0640.062H (16)-0.018-0.015-0.022H (16)0.0360.0380.033H (16)0.0330.0350.032H (17)0.0620.0620.063H (17)0.0380.040.035H (17)-0.005-0.001-0.009H (17)0.0340.0360.032H (18)0.0690.0690.069H (18)0.0450.0470.044H (18)0.0380.040.036H (18)0.0480.050.047H (19)0.080.080.079H (19)0.0450.0470.043H (19)0.0450.0460.043H (19)0.0540.0560.052H (20)0.0780.0780.077H (20)0.0380.0380.039H (20)0.090.0950.085H (20)0.0620.0630.06H (21)0.080.0810.08H (21)0.0650.0680.062H (21)0.0420.0410.044H (21)0.0590.060.058H (22)0.0340.0340.035H (22)0.0780.0760.08H (22)0.0740.0730.074H (22)0.0680.0660.069H (23)0.0350.0350.035H (23)0.080.0790.082H (23)0.0910.090.093H (23)0.0690.0690.069H (24)0.0470.0460.047H (24)0.0960.0950.098H (24)0.0770.0750.079H (24)0.070.0690.071H (25)0.0220.0220.022H (25)0.0780.0770.079H (25)0.0710.0680.075H (25)0.0690.0680.07H (26)0.0220.0220.022H (26)0.0460.0450.046H (26)0.0510.0510.05H (26)0.0590.0650.053H (27)0.0380.0380.038H (27)0.0510.0490.053H (27)0.0420.0410.043H (27)0.0580.0520.063H (28)0.0380.0380.038H (28)0.060.0590.06H (28)0.0510.0490.053H (28)0.0460.0430.048H (29)0.0210.0210.021------------H (30)0.0050.0030.007------------H (31)0.0320.0310.032------------H (32)-0.0010-0.001------------H (33)0.0610.0610.062------------H (34)0.0360.0360.036------------WhereF0: Mulliken atomic chargesf+: Nucleophilic attackf-: Electrophilic attack
Fig. 15ΔE values for compound IL_I_-IL_IV_.
Table 10. Comprehensive comparison of ILs as corrosion inhibitors at high concentration.Inhibitor/concentrationMediumMetal(EIS) IE %Refs.IL_I_(100ppm)1 M HClCarbon Steel96.69Present StudyIL_II_(100ppm)1 M HClCarbon Steel96.47IL_III_(100ppm)1 M HClCarbon Steel97.21IL_IV_(100ppm)1 M HClCarbon Steel96.28 1-butyl-3-methylimidazolium methane sulfonate (800 ppm) M H_2_SO_4_Carbon Steel91.158 -hexadecyl-3-(4-methylbenzyl)-1 H-imidazol-3-ium chloride(120 ppm) 1 M HClCarbon Steel92.90591-hexadecyl-3-(4-nitrobenzyl)-1 H-imidazol-3-ium chloride*(120 ppm)*1 M HClCarbon Steel94.5059
Conclusion
The structural characterization of the synthesized ionic liquids (IL_I_–IL_IV_) was comprehensively established using elemental analysis, FT-IR spectroscopy, and ^1^H-NMR spectroscopy. The elemental analysis results confirmed that the experimental composition of all inhibitors closely matched their theoretical values. FT-IR spectroscopy validated the presence of key functional groups, while ^1^H-NMR spectra provided deeper insights into the molecular environment and proton interactions within each compound.
Various electrochemical approaches, including PP, EIS, and EFM, showed that all four inhibitors effectively reduced the corrosion of C-steel by 1 M HCl, reaching up to 97% protection at an optimal concentration of 100 ppm. These inhibitors mainly function as dual-action inhibitors, where their adsorption onto the metal surface plays a crucial role in lowering the C.R. Further quantum chemical calculations confirmed these findings, revealing that IL_II_–IL_IV_ exhibited better performance due to their ability to coordinately share electrons more effectively, which is attributed to their aromatic ring structures and narrower energy gaps.
Overall, both experimental and theoretical results confirm that the investigated ionic liquids serve as effective corrosion inhibitors for C-steel in acidic solutions.
Supplementary Information
Below is the link to the electronic supplementary material.
Supplementary Material 1
The reference list from the paper itself. Each links out to its DOI / PubMed record.
- 1Moustafa, A. A., Ashmawy, A. M., Ghayad, I. M., El-Zomrawy, A. A. & Abdelbasir, S. M. Novel imidazole-based, ionic liquid: synthetics linked to enhancing the life cycle of lead-acid batteries. J. Energy Storage. 5610.1016/j.est.2022.105932 (2022).
- 2Wang, Z. Y. Zwitterionic Chromophores and Macromolecules Containing Such Chromophores (Google Patents, 2010).
- 3Mohammed, H. A., Mostafa, H. Y., El-Aty, D. M. A. & Ashmawy, A. M. Novel gemini ionic liquid for oxidative desulfurization of gas oil. Sci. Rep.13 (1). 10.1038/s 41598-023-32539-y (2023).10.1038/s 41598-023-32539-y PMC 1010645437062776 · doi ↗ · pubmed ↗
- 4Ahmed, Y. M., Ashmawy, A. M., Abbas, A. A. & Mohamed, G. G. Synthesis, characterization, antibacterial, antioxidant activities, density functional theory, and molecular Docking studies of new organic metal complexes and links to application of corrosion inhibitors. Appl. Organomet. Chem.37 (4). 10.1002/aoc.7015 (2023).
- 5Ahmed, Y. M., Ashmawy, A. M., Abbas, A. A. & Mohamed, G. G. New morpholino acetamide ligand’s rare earth metal complexes through synthesis, structural, and theoretical studies. Effect of ligand on aluminum alloy corrosion inhibition. J. Mol. Struct.130510.1016/j.molstruc.2024.137607 (2024).
- 6Alanazi, K. D. et al. Thermodynamic, chemical, and electrochemical studies of Aloe ferox mill extract as a naturally developing copper corrosion inhibitor in H Cl solution. Sci. Rep.14 (1). 10.1038/s 41598-024-62169-x (2024).10.1038/s 41598-024-62169-x PMC 1112666638789541 · doi ↗ · pubmed ↗
- 7Selim, Y. A. et al. An electrochemical, and surface studies of synthesized gemini ionic liquid as corrosion inhibitor for carbon steel in petroleum field. Sci. Rep.14 (1). 10.1038/s 41598-024-58321-2 (2024).10.1038/s 41598-024-58321-2PMC 1108756538730028 · doi ↗ · pubmed ↗
- 8Udunwa, D. I., Onukwuli, O. D., Menkiti, M. C., Anadebe, V. C. & Chidiebere, M. A. 1-Butyl-3-methylimidazolium methane sulfonate ionic liquid corrosion inhibitor for mild steel alloy: experimental, optimization and theoretical studies. Heliyon ;9(7).e 18353-e 83731 (2023).10.1016/j.heliyon.2023.e 18353 PMC 1039554237539257 · doi ↗ · pubmed ↗